1
- Department of Sports Sciences, Polytechnic Institute of Guarda. Education, Communication and Sport School (IPG), Guarda, Portugal
2 - Research Centre for Sports Sciences, Health and Human Development (CIDESD), Vila Real, Portugal
3- Department of Sport Sciences, University of Beira Interior (UBI), Covilhã, Portugal
4 - Department of Sport Sciences, Exercise and Health, University of Trás-os-Montes and Alto Douro (UTAD), Vila Real, Portugal
5- Department of Sports Sciences, Polytechnic Institute of Bragança, Bragança, Portugal
Somatotype is More Interactive with Strength than Fat Mass
and Physical Activity in Peripubertal Children
by
Carlos Marta
1,2, Daniel A. Marinho
2,3, Aldo M. Costa, Tiago M. Barbosa
2,5,
Mário C. Marques
2,3The purpose of this study was to analyse the interaction between somatotype, body fat and physical activity in prepubescent children. This was a cross-sectional study design involving 312 children (160 girls, 152 boys) aged between 10 and 11.5 years old (10.8 ± 0.4 years old). Evaluation of body composition was done determining body mass index and body fat by means of skin-fold measurements, using the method described by Slaughter. Somatotype was computed according to the Carter’s method. Physical activity was assessed with the Baecke questionnaire. The physical activity assessment employed sets of curl-ups, push-ups, standing broad jump, medicine ball throw, handgrip strength and Margaria-Kalamen power stair. There were negative associations for body fat, endomorphy and mesomorphy with curl-ups, push-ups and broad jump tests and positive associations with ball throw, handgrip strength and Margaria-Kalamen power tests. The associations for ectomorphy were the inverse of those for endomorphy and mesomorphy. Non obese children presented higher values for curl-ups, push-ups and standing broad jump. In medicine ball throw, handgrip strength and Margaria-Kalamen power test obese children presented higher scores, followed by children who were overweight. The mesoectomorphic boys and ectomesomorphic girls performed higher in all tests. The morphological typology presented more interactions with strength than % of body fat and physical activity. These data seem to suggest that the presence/absence of certain physical characteristics is crucial in the levels of motor provision in prepubescent children.
Key words: physical fitness, motor performance, strength, anthropometric
Introduction
Children with high levels of motor competence are more active, more capable (Castelli and Vale, 2007) and spend less time on sedentary tasks (Wrotniak et al., 2006). On the other hand, improvement in the motor proficiency of children can also influence levels of habitual physical activity beyond school age, creating expectations of future maintenance of active lifestyles (Sharkey, 2002; Andersen et al., 2004) and is thus indispensable to potential decisions influencing the promotion of health (Stodden et
al., 2008). Health-related fitness includes, besides others, aerobic endurance, muscular strength, and flexibility (Hands et al., 2009). On this, most studies on physical fitness have focused specially on aerobic capacity neglecting, among for instance, neuromotor fitness based on muscular strength (Cepero et al., 2011). Some studies reported positive associations between physical activity in children and adolescents with performance on tests of muscular strength and muscular endurance (Lennox et al. 2008;
Martínez-Gómez et al., 2011). Added to that, an evolution of muscular strength skills throughout adolescence associated with higher levels of physical activity were also described (Zac and Szopa, 2001). Others, by contrast, report no significant associations between physical activity and performance in similar tests (Hands et al., 2009). It is also possible to find studies that negatively relate body fat with tests of strength and muscular endurance (Castro-Pistro et al. 2009; Dumith et al., 2010) or, conversely, a positive relationship in tests such as ball throwing or handgrip strength (Artero et al., 2010; D'Hondt et al. 2009).
Somatype assessment may be used to describe changes in the human physique over the lifespan or as a result of physical activity and has been found to be inherited to a greater extent than body mass index (Reis et al., 2007). Yet, there are few studies that link somatype with muscular strength in young people, with the exception of the recent studies by Jakšić and Cvetkovic (2009) and Shukla et al. (2009) relating this exclusively to the standing broad jump and curl-ups. Currently, efforts to promote physical fitness levels in the young ought to be a priority (Cepero et al., 2011), but clearly these cannot exceed the limits imposed by genotype, i.e., the manifestation of genetic determinism; just as important as the dimensional values are their relative degrees of presence, observed from the morpho-constitutional perspective (Malina and Bouchard, 1991). We can define the morphological typology as a complex entity that describes the overall configuration of
the body, as opposed to individual anatomical characteristics (Malina and Bouchard, 1991). It is therefore pertinent to examine, in addition to the correspondence between physical activity, body composition and performance in tests of muscle strength and endurance, the correlation between somatotype and any such tests.
Therefore, the purpose of the present study was to analyze the relationship between physical activity, body fat, and somatotype with performance in tests of strength and muscular endurance. An additional objective is to find which of the variables is most interactive with the muscular strength and endurance parameters selected. It was hypothesized that there is some kind of relationship between physical activity, body fat and somatotype with muscular strength and muscular endurance performances.
Material and Methods
Sample
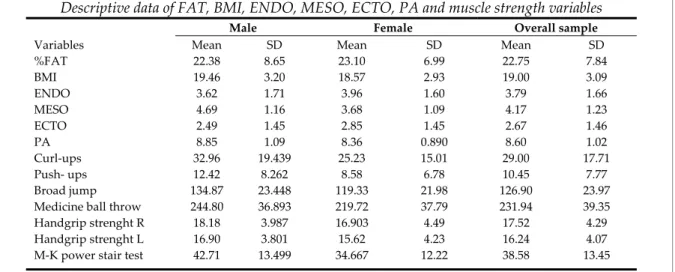
The sample, cross-sectional in type, consisted of 312 prepubescent children (160 girls, 152 boys) who volunteered for this study. The age, height and weight of the whole sample were: 10.8 ± 0.4 years, 1.45 ± 0.08 m, 40.0 ± 8.7 kg, respectively (girls: 10.8 ± 0.4 years, 1.44 ± 0.07 m, 38.9 ± 8.5 kg; boys: 10.8 ± 0.4 years, 1.45 ± 0.09 m, 41.2 ± 8.8 kg). Descriptive data of the percentage of fat mass (%FAT), body mass index (BMI) endomorphy (ENDO), mesomorphy (MESO), ectomorphy (ECTO), physical activity index (PA) and muscle strength variables are presented in Table 1.
Table 1
Descriptive data of FAT, BMI, ENDO, MESO, ECTO, PA and muscle strength variables
Male Female Overall sample
Variables Mean SD Mean SD Mean SD
%FAT 22.38 8.65 23.10 6.99 22.75 7.84 BMI 19.46 3.20 18.57 2.93 19.00 3.09 ENDO 3.62 1.71 3.96 1.60 3.79 1.66 MESO 4.69 1.16 3.68 1.09 4.17 1.23 ECTO 2.49 1.45 2.85 1.45 2.67 1.46 PA 8.85 1.09 8.36 0.890 8.60 1.02 Curl-ups 32.96 19.439 25.23 15.01 29.00 17.71 Push- ups 12.42 8.262 8.58 6.78 10.45 7.77 Broad jump 134.87 23.448 119.33 21.98 126.90 23.97
Medicine ball throw 244.80 36.893 219.72 37.79 231.94 39.35
Handgrip strenght R 18.18 3.987 16.903 4.49 17.52 4.29
Handgrip strenght L 16.90 3.801 15.62 4.23 16.24 4.07
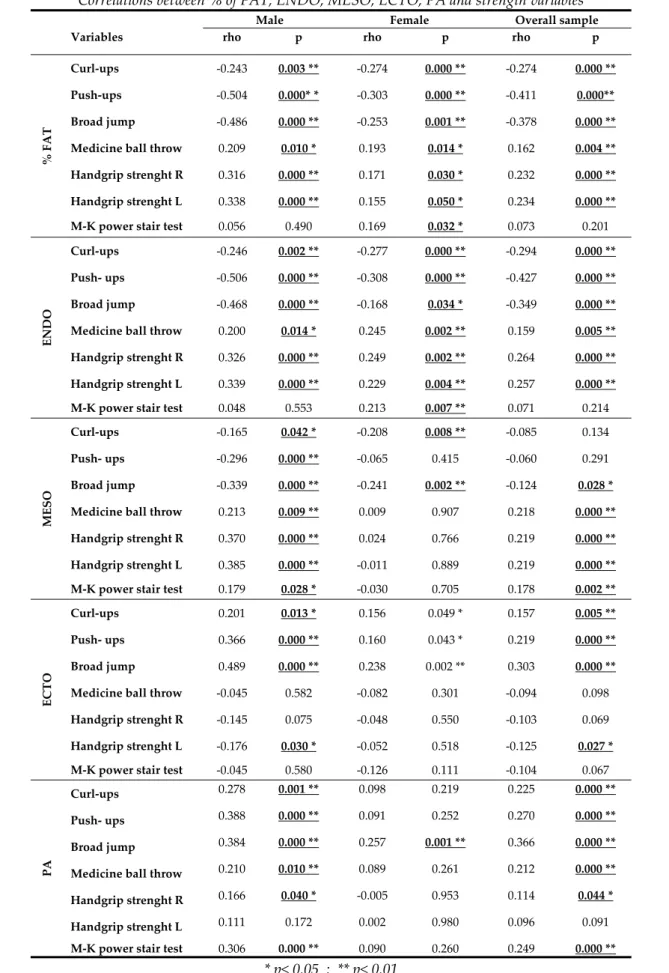
Table 2
Correlations between % of FAT, ENDO, MESO, ECTO, PA and strength variables
Male Female Overall sample
Variables rho p rho p rho p
% F A T Curl-ups -0.243 0.003 ** -0.274 0.000 ** -0.274 0.000 ** Push-ups -0.504 0.000* * -0.303 0.000 ** -0.411 0.000** Broad jump -0.486 0.000 ** -0.253 0.001 ** -0.378 0.000 **
Medicine ball throw 0.209 0.010 * 0.193 0.014 * 0.162 0.004 **
Handgrip strenght R 0.316 0.000 ** 0.171 0.030 * 0.232 0.000 **
Handgrip strenght L 0.338 0.000 ** 0.155 0.050 * 0.234 0.000 **
M-K power stair test 0.056 0.490 0.169 0.032 * 0.073 0.201
ENDO
Curl-ups -0.246 0.002 ** -0.277 0.000 ** -0.294 0.000 **
Push- ups -0.506 0.000 ** -0.308 0.000 ** -0.427 0.000 **
Broad jump -0.468 0.000 ** -0.168 0.034 * -0.349 0.000 **
Medicine ball throw 0.200 0.014 * 0.245 0.002 ** 0.159 0.005 **
Handgrip strenght R 0.326 0.000 ** 0.249 0.002 ** 0.264 0.000 **
Handgrip strenght L 0.339 0.000 ** 0.229 0.004 ** 0.257 0.000 **
M-K power stair test 0.048 0.553 0.213 0.007 ** 0.071 0.214
MESO
Curl-ups -0.165 0.042 * -0.208 0.008 ** -0.085 0.134
Push- ups -0.296 0.000 ** -0.065 0.415 -0.060 0.291
Broad jump -0.339 0.000 ** -0.241 0.002 ** -0.124 0.028 *
Medicine ball throw 0.213 0.009 ** 0.009 0.907 0.218 0.000 **
Handgrip strenght R 0.370 0.000 ** 0.024 0.766 0.219 0.000 **
Handgrip strenght L 0.385 0.000 ** -0.011 0.889 0.219 0.000 **
M-K power stair test 0.179 0.028 * -0.030 0.705 0.178 0.002 **
ECTO
Curl-ups 0.201 0.013 * 0.156 0.049 * 0.157 0.005 **
Push- ups 0.366 0.000 ** 0.160 0.043 * 0.219 0.000 **
Broad jump 0.489 0.000 ** 0.238 0.002 ** 0.303 0.000 **
Medicine ball throw -0.045 0.582 -0.082 0.301 -0.094 0.098
Handgrip strenght R -0.145 0.075 -0.048 0.550 -0.103 0.069
Handgrip strenght L -0.176 0.030 * -0.052 0.518 -0.125 0.027 *
M-K power stair test -0.045 0.580 -0.126 0.111 -0.104 0.067
PA
Curl-ups 0.278 0.001 ** 0.098 0.219 0.225 0.000 **
Push- ups 0.388 0.000 ** 0.091 0.252 0.270 0.000 **
Broad jump 0.384 0.000 ** 0.257 0.001 ** 0.366 0.000 **
Medicine ball throw 0.210 0.010 ** 0.089 0.261 0.212 0.000 **
Handgrip strenght R 0.166 0.040 * -0.005 0.953 0.114 0.044 *
Handgrip strenght L 0.111 0.172 0.002 0.980 0.096 0.091
M-K power stair test 0.306 0.000 ** 0.090 0.260 0.249 0.000 **
Both boys and girls were in Tanner stages 1-2. Participants' parents provided their written and informed consent and the procedures were approved by the institutional review board following the Helsinki Declaration.
Procedures
Parameters of body fat, somatotype, level of physical activity and physical fitness were evaluated for all subjects participating in the study. For anthropometric measurements the participants were barefoot and wore only underwear. Body weight was measured using the standard digital floor scale (Seca 841), body height using a precision stadiometer (Seca 214), and skinfolds using a skinfold caliper. For perimeter measurement a circumference tape was used (Seca 200).
It was assessed the bi-condilofemoral diameter and the leg diameter (Campbell, 20, RossCraft, Canada). In the evaluation of body composition, body mass index (BMI) and body fat (%FAT) were calculated using the skinfold method described by Slaughter et al. (1988). Cohort groups were defined based in the body mass index according to the cut-off values suggested by Cole et al. (2000). The definition of morphological typology (TYPE) used the method described by Heath-Carter (1971), while the evaluation of biological maturation followed the sexual maturation stages of Tanner (1962). Individuals selected were self-evaluated as being in stages 1 and 2. The index of physical activity (PA) was measured using the Baecke et al. (1982) questionnaire. For the assessment of physical fitness, motor tests were chosen to include the assessment of muscle strength and endurance (curl-ups and push-ups: the score was the number of correct curl-ups performed at a cadence of 20 curl-ups per minute, i.e., 1 curl-up every 3 seconds), explosive strength (standing broad jump and medicine ball throw 2 kg: the score was the the furthest distance), isometric strength and anaerobic endurance (hand-grip strength - using a Jamar hydraulic hand dynamometer of 000-200 lbs: three trails were given for each hand separately and the score was recorded in kg) and muscular power (Margaria-Kalamen power stair test: Power = body mass (kg) x vertical distance between steps). The test-retest reliability, as shown by the intraclass correlation coefficient (ICC) was between 0.91 and 0.94 for all measures.
Statistics
Normality of distribution was checked by applying the Kolmogorov-Smirnov tests (SPSS 17.0). Statistical analysis used the Kruskal-Wallis test in the comparison between groups. Relationships between variables was performed with the Spearman correlation. Interaction between the variables referred to the General Linear Model, MANOVA. The statistical significance was set at p ≤ 0.05.
Results
There were significant negative associations between % FAT, endomorphy (ENDO) and mesomorphy (MESO) with performance on tests of curl-ups, push-ups and standing broad jump, and positive associations with medicine ball throw, handgrip strength and M-K tests. In the opposite direction, ectomorphy (ECTO) was negatively associated with left handgrip strength, and positively with curl-ups, push-ups and standing broad jump. With the exception of left handgrip strength, for which there were no significant correlations, PA was positively associated with all the variables of muscle strength and endurance (Table 2).
Comparing groups with different BMI, one can observe significant differences between normal weight, overweight, and obese children on curl-ups, push-ups, standing broad jump, medicine ball throw, handgrip strength and M-K power test (Table 3). Normal weight children presented higher performance on curl-ups, push-ups and standing broad jump, followed by children who were overweight. In medicine ball throw, handgrip strength and M-K power test, obese children presented higher scores, followed by children who were overweight (in boys, girls, and whole sample). MANOVA results showed that the variable TYPE presented more interactions with the muscle strength and endurance variables than % FAT and PA variables (Table 5).
The comparison between groups of different TYPE showed significant differences in the curl-ups, push-curl-ups, standing broad jump, handgrip strength and M-K power test (Table 4). In addition, the current experiment presented higher performance values for mesoectomorphic boys and ectomesomorphic girls in all tests.
Table 3
Comparison between different BMI groups with respect to muscle strength variables
Male Female Total
Variables K p K p K p
Curl-ups 5.041 0.080 5.442 0.066 8.773 0.012 *
Push- ups 20.216 0.000 ** 10.723 0.005** 23.445 0.000 **
Broad jump 26.479 0.000 ** 1.078 0.583 14.192 0.001 **
Medicine ball throw 4.694 0.096 8.892 0.012 * 14.179 0.001 **
Handgrip strenght R 11.526 0.003 ** 8.067 0.018 * 21.356 0.000 **
Handgrip strenght L 16.031 0.000 ** 8.739 0.013 * 26.602 0.000 **
M-K power stair test 0.941 0.625 10.750 0.005 ** 10.808 0.004 **
* p< 0.05 ; ** p< 0.01
Table 4
Comparison between different TYPE groups with respect to strength variables
Male Female Total
Variables K p K p K p
Curl-ups 15.206 0.055 20.961 0.034 * 33.267 0.000 **
Push- ups 43.772 0.000 ** 27.985 0.003 ** 67.080 0.000 **
Broad jump 37.300 0.000 ** 25.003 0.009 ** 44.295 0.000 **
Medicine ball throw 8.731 0.365 13.274 0.276 6.764 0.818
Handgrip strenght R 11.282 0.186 20.144 0.043 * 14.404 0.211
Handgrip strenght L 12.442 0.133 27.964 0.003 ** 17.019 0.107
M-K power stair test 2.760 0.949 29.445 0.002 ** 20.754 0.036 *
* p<0.05 ; ** p< 0.01
Table 5
Interaction of morphological type (TYPE), body fat (% FAT) and physical activity (PA) with strength variables: GLM-MANOVA test
Male Female Total
Variables F p F p F p
Curl-ups %FAT 2.674 0.035 *
Push- ups TYPE 2.713 0.002 **
%FAT 4.205 0.007 **
Broad jump TYPE 2.909 0.001 **
PA 4.383 0.037 *
Med ball throw %FAT 2.601 0.037 *
H grip strenght R TYPE 2.135 0.023 *
H strenght L TYPE 2.920 0.002 **
M-K power stair TYPE 3.018 0.001 ** 2.408 0.007 **
%FAT 2.762 0.028 *
Discussion
The purpose of this study was to examine the interaction between physical activity, body fat, somatotype and performance with muscle strength and endurance. The main results suggest that in subjects undergoing pre pubescence, somatotype is a more significantly determining factor than PA and % FAT to the performance in strength tests.
The significant and negative relationship of body fat with body tasks is consistent with results of previous studies that referred to similar relationships in tests of curl-ups (Fogelholm et al. 2008; Castro-Piñero et al. 2009; D'Hondt et al., 2009; Dumith et al., 2010), standing broad jump (Artero et al., 2010; Xianwen et al., 2010), and push-ups (Castro-Piñeroet al., 2009). The current results are also consistent with others researches that report positive associations of body fat with handgrip strength and ball-throwing, as evidenced by studies undertaken by Deforche et al. (2003), Casajús et al. (2007) and Artero et al. (2010), in the hand dynamometry test, and D'Hondt et al. (2009), in the basketball throw. On the other hand, Dumith et al. (2010) found no significant association of body fat with medicine ball throw. In the M-K test, it was not possible to compare the results with other studies in the literature. However, the fact that in the equation for calculating power the numerator must take into account the weight of the subject, which in addition to body fat also includes the muscle mass associated with it, might somehow explain the positive association observed in girls. Concerning the relation of somatotype with physical fitness, it should be stressed-out that, more important than the association of each major component with performance, it is the critical to consider the degree of relative presence of each component, defined by morphological typology.
ENDO was positively related only with handgrip strength, ball-throwing power and the M-K test, these being the same tests in which %FAT had a positive association. These two variables are very close, either in terms of definition, or by the way they are calculated. Here, ENDO expresses the degree of adiposity development (Malina and Bouchard, 1991). So the primary effect of this component in performance will differ depending on the type of task, being a limiting factor in body propulsion and lifting
tasks in which body fat plays a similar function. Also Malina and Bouchard (1991) reported that ENDO, unlike the tasks of throwing objects, tends to negatively correlate with performance on most motor tasks, because the absolute lean body mass is more related to these tasks than the relative lean body mass. However, according to the same authors, the correlations between body type and motor performance are generally low and limited in pre pubescence.
MESO reflects muscle development positively associated with strength and motor performance in general (Malina and Bouchard, 1991). This component is only negatively correlated with tests related to the propulsion and lifting of the body, in which tasks ECTO has the advantage, since it is based on weighting index, i.e. the quotient of height by the cube root of body weight (Malina and Bouchard, 1991). While observing a positive influence for MESO in most tests, it is also necessary to consider sexual dimorphism in relation to body type component of the somatotype, reflected in the differences in the values of ECTO and MESO. These differences only begin to be observed and favorable to boys from early adolescence, thus increasing with age, while girls tend to increase the value of ENDO (Malina et al., 2004). If the analysis is carried-out according to the dominant component, the children whom the MESO and ECTO were dominant had the best results in all tests considered.
ECTO reflects linearity and muscular hypotonia (Dumith et al. 2010). On this, there were only positive associations for ECTO with propulsion and lifting body tasks, precisely the reverse of the associations for ENDO and MESO because of the negative effect of body weight in these tasks (Dumith et al. 2010; Xianwen et al., 2010). Regarding left handgrip strength, there is a negative association, since it is a different test, which does not require propulsion or lifting the body.
In the relationship of TYPE with motor performance it appears that meso-ectomorphs and ecto-mesomorphs, i.e. individuals with a predominance of the primary components of ECTO and MESO presented higher performances in all tests considered, which is consistent with the advantage of MESO, noticed in the literature, concerning the tasks that require strength and
motor performance in general. By contrast, the advantage of ECTO was found in tasks related to the propulsion and lifting movements of the body. Suchomel (2002) also reported a positive association between the prevalence of these components with the total score of the battery UNIFITT as did Jakšić and Cvetkovic (2009) with the performance analysis in the curl-ups, bent-arm hang and longest jump distance.
The relationship between PA and motor performance corroborates the findings of most studies that report a positive association between PA and muscular strength and endurance as well as overall physical fitness, particularly in the standing broad jump (Lennox et al., 2008; Loko et al. 2003; Wrotniak et al., 2006), medicine ball throw (Loko et al., 2003), push-ups (Lennox et al., 2008, Tovar et al., 2008) and isometric hand-dynamometry (Tovar et al., 2008). Different results were obtained by Hands et al. (2009), who found no significant associations between PA and performance in standing broad jump, curl-ups, hand dynamometry and ball throw. The greatest
number of interactions of TYPE with the selected tests highlights the importance of this parameter in muscle strength and endurance in prepubescent children.
In summary, body fat, physical activity and somatotype determine physical fitness levels in children and adolescents. The current study presented similar data, although underlying the main role of the somatotype on muscular strength and resistance in prepubescent children. The data from this study seem to suggest that one cannot exceed the limits imposed by what is a manifestation of genetic determinism, observed from the morpho-constitutional point of view, by which the presence/absence of certain physical traits determines the appropriate levels of motor performance required.
It can be considered as main limitations: (i) there are several other biological and behavior variables that might also determine the muscular strength performance; (ii) it was only applied field tests. Laboratory tests with a higher control standard might present more accurate data.
Acknowledgments
The authors would like to thank all the students who participate in this research.
References
Andersen L, Hasseltrom H, Gronfeldt V, Hansen S, Karsten K. The relationship between physical fitness and clustered risk, and tracking of clustered risk from adolescence to young adulthood: Eight years follow-up in the Danish Youth and Sport Study. Int J Behav Nutr Phys Act, 2004; 1: 6
Artero E, España-Romero V, Ortega F, Jiménez-Pavón D, Ruiz J, Vicente-Rodríguez G, Bueno M, Marcos A, Gómez-Martínez S, Urzanqui A, González-Gross M, Moreno L, Gutiérrez A, Castillo M. Health-related fitness in adolescents: underweight, and not only overweight, as an influencing factor. The AVENA study. Scand J Med Sci Spor, 2010; 20(3): 418-427
Baecke J, Burema J, Frijiters J. A short questionnaire for the measurement of habitual physical activity in epidemiological studies. Am J Clin Nutr, 1982; 36(5): 936-942
Casajús J, Leivia M, Villarroya A, Legaz A, Moreno L. Physical performance and school physical education in overweight Spanish children. Ann Nutr Metab, 2007; 51(3): 288-296
Castelli D, Valley J. The relationship of physical fitness and motor competence to physical activity: Chapter 3. J Teach Phys Educ, 2007; 26: 358-374
Castro-Piñero J, González-Montesinos J, Mora J, Keating X, Girela-Rejón M, Sjöström M, Ruiz J. Percentile values for muscular strength field tests in children aged 6 to 17 years: influence of weight status. J Strength Cond Res, 2009; 23(8): 2295-2310
Cepero M, López R, Suárez-Llorca C, Andreucabrera E, Rojas F. Fitness test profiles in children aged 8-12 years old in Granada (Spain). J Hum Sport Exerc, 2011; 6(1): 135-146
Cole T, Billizzi M, Flegal K, Dietz W. Establishing a standard definition for child overweight and obesity worldwide: International survey. Brit Med J, 2000; 320(6): 1240-1243
Deforche B, Lefevre J, De Bourdeaudhui I, Hills A, Duquet W, Bouckaert J. Physical fitness and physical activity in obese and nonobese Flemish youth. Obes Res, 2003; 11: 434-441.
D`Hont E, Deforche B, Bourdeaudhuij I, Lenoir M. Relationship between motor skill and Body Mass Index in 5-to 10-year-old children. Adapt Phys Act Q, 2009; 26: 21-37
Dumith S, Ramires V, Souza M, Moraes D, Petry F, Oliveira E, Ramires S, Hallal P. Overweight/Obesity and physical fitness among children and adolescents. J Phys Act Health, 2010; 7: 641-648
Fogelholm M, Stigman S, Huisman T, Metsämuuronen J. Physical fitness in adolescents with normal weight and overweight. Scand J Med Sci Sport, 2008; 18(2): 162-170
Heath H, Carter L. Growth and somatotype patterns of Manus children, Territory of Papua and New Guinea: Application of a modified somatotype method to the study of growth patterns. Am J Phys Anthropol, 1971; 35(1): 49-67
Hands B, Larkin D, Parker H, Straker L, Perry M. The relationship among physical activity, motor competence and health- related fitness in 14-year-old adolescents. Scand J Med Sci Sport, 2009; 19(5): 655-663
Jakšić D, Cvetković M. Neural network analysis of somatotype differences among males related to the manifestation of motor abilities. Acta Kinesiologica, 2009; 3(1): 107-113
Lennox A, Pienaar A, Wilders C. Physical fitness and the physical activity status of 15-year-old adolescents in a semi-urban community. S Afr J Res Sport Phys Educ Recreation, 2008; 30(1): 59-73
Loko J, Aule R, Sikkut T, Ereline J, Viru A. Age differences in growth and physical abilities in trained and untrained girls 10-17 years of age. Am J Hum Biol, 2003; 15: 72-77
Malina R, Bouchard C. Growth maturation and physical activity. Champaign, Illinois: Human Kinetics. 1991 Malina R, Bouchard C, Bar-Or O. Growth, maturation and physical activity. Champaign, Illinois: Human
Kinetics. 2004
Martínez-Gómez D, Welk G, Puertollano M, del-Campo J, Moya J, Marcos A, Veiga O. Associations of physical activity with muscular fitness in adolescents. Scand J Med Sci Sport, 2011; 21(2): 310-318 Reis VM, Machado JV, Fortes MS, Fernandes PR, Silva AJ, Dantas PS, Filho JF. Evidence for higher
heritability of somatotype compared to body mass index in female twins. J Physiol Anthropol, 2007; 26(1): 9-14
Sharkey, BJ. Fitness & Health. Hong Kong: Human Kinetics. 2002
Shukla M, Venugopal R, Mitra M. A cross sectional study of body composition somatotype and motor quality of rural and urban boys of Chhattisgarh. Int J Fitness, 2009; 5(1): 1-7
Slaughter M, Lohman T, Boileau R, Horswill C, Stillman R, VanLoan M, Bemben D. Skinfold equations for estimation of body fatness in children and youth. Hum Biol, 1988; 60(5): 709-723
Stodden D, Goodwway J, Langendorfer S, Roberton M, Rudisill M, et al. A developmental perspective on the role of motor skill competence in physical activity: An emergent relationship. Quest, 2008; 60: 290-306
Suchomel A. Relation between anthropometric somatotype and motor performance in prepubescent and pubescent Czech. Anthropologie, 2002; 40(2): 193-201.
Tanner JM. Growth at adolescence. Oxford: Blackwell Scientific Publications. 1962.
Tovar G, Poveda J, Pinilla M, Lobelo F. Relationship between overweight, physical activity and physical fitness in school-aged boys in Bogotá Colombia. Arch Latinoam Nutr, 2008; 58(3): 265-273
Wrotniak B, Epstein L, Dorn J, Jones K, Kondilis V. The relationship between motor proficiency and physical activity in children. Pediatrics, 2006; 118(6): 1758-1765
Xianwen S, Ailing L, Yanping L, Xiaoqi H, Lin D, Jun M, Guifa X, Ying L, Hongwei G, Guansheng, M. The association of weight status with physical fitness among Chinese children. Int J Pediatr, 2010;
Article ID 515414, doi:10.1155/2010/515414515-414.
Zak S, Szopa J. Effects of diversified motor activity on the level of motor fitness in children and Youth from Cracow (Poland). J Hum Kinetics, 2001; 6: 47-58.
Corresponding author Mário C. Marques
Department of Sport Sciences, University of Beira Interior (UBI), Covilhã, Portugal. Research Centre for Sport Sciences, Health and Human Development (CIDESD), Vila Real, Portugal. Department of Sport Sciences, University of Beira Interior (UBI): Rua Marquês D´Ávila e Bolama 6200-001 Covilhã, Portugal Tel. +(351) 275329153
Fax. +(351) 275329157