Echocardiographic Assessment of Ventricular Function in Young
Patients with Asthma
Camilla Rayane De-Paula,
1Giselle Santos Magalhães,
1,2Nulma Souto Jentzsch,
1Camila Figueredo Botelho,
1Cleonice de Carvalho Coelho Mota,
2Tatiane Moisés Murça,
3Lidiana Fatima Correa Ramalho,
4Timothy C. Tan,
6,7,8Carolina Andrade Braganca Capuruço,
2,5Maria da Gloria Rodrigues-Machado
1Faculdade Ciências Médicas - Minas Gerais (FCM-MG), Belo Horizonte, MG - Brazil;1 Universidade Federal de Minas Gerais (UFMG), Belo Horizonte, MG - Brazil;2 Universidade Salgado de Oliveira, Belo Horizonte, MG - Brazil;3
Prefeitura de Belo Horizonte - Unidade de Referência Secundária Saudade, Belo Horizonte, MG - Brazil;4 Clínica Conrad, Belo Horizonte, MG - Brazil;5
Westmead Hospital - Faculty of Medicine - University of Sydney, Sidney - Austrália;6 Blacktown Hospital - Faculty of Medicine - University of Western Sydney, Sidney - Austrália;7 School of Medical Sciences - Faculty of Medicine - University of New South Wales, Sidney - Austrália8
Mailing Address: Maria da Gloria Rodrigues Machado •
Alameda Ezequiel Dias, 275. Postal Code 30130-110, Centro, Belo Horizonte. MG – Brazil
E-mail: [email protected]
Manuscript received December 30, 2016, revised mansucript July 04, 2017, accepted November 16, 2017
DOI: 10.5935/abc.20180052
Abstract
Background: Despite significant advances in understanding the pathophysiology and management of asthma, some of systemic effects of asthma are still not well defined.
Objectives: To compare heart function, baseline physical activity level, and functional exercise capacity in young patients with mild-to-moderate asthma and healthy controls.
Methods: Eighteen healthy (12.67 ± 0.39 years) and 20 asthmatics (12.0 ± 0.38 years) patients were enrolled in the study. Echocardiography parameters were evaluated using conventional and tissue Doppler imaging (TDI).
Results: Although pulmonary acceleration time (PAT) and pulmonary artery systolic pressure (PASP) were within normal limits, these parameters differed significantly between the control and asthmatic groups. PAT was lower (p < 0.0001) and PASP (p < 0.0002) was higher in the asthma group (114.3 ± 3.70 ms and 25.40 ± 0.54 mmHg) than the control group (135.30 ± 2.28 ms and 22.22 ± 0.40 mmHg). The asthmatic group had significantly lower early diastolic myocardial velocity (E’, p = 0.0047) and lower E’ to late (E’/A’, p = 0.0017) (13.75 ± 0.53 cm/s and 1.70 ± 0.09, respectively) compared with control group (15.71 ± 0.34 cm/s and 2.12 ± 0.08, respectively) at tricuspid valve. In the lateral mitral valve tissue Doppler, the asthmatic group had lower E’ compared with control group (p = 0.0466; 13.27 ± 0.43 cm/s and 14.32 ± 0.25 cm/s, respectively), but there was no statistic difference in the E’/A’ ratio (p = 0.1161). Right isovolumetric relaxation time was higher (p = 0.0007) in asthmatic (57.15 ± 0.97 ms) than the control group (52.28 ± 0.87 ms), reflecting global myocardial dysfunction. The right and left myocardial performance indexes were significantly higher in the asthmatic (0.43 ± 0.01 and 0.37 ± 0.01, respectively) compared with control group (0.40 ± 0.01 and 0.34 ± 0.01, respectively) (p = 0.0383 and p = 0.0059, respectively). Physical activity level, and distance travelled on the six-minute walk test were similar in both groups. Conclusion: Changes in echocardiographic parameters, evaluated by conventional and TDI, were observed in mild-to-moderate asthma patients even with normal functional exercise capacity and baseline physical activity level. Our results suggest that the echocardiogram may be useful for the early detection and evoluation of asthma-induced cardiac changes. (Arq Bras Cardiol. 2018; 110(3):231-239)
Keywords: Exertional Dyspnea / physiopathology; Echocardiography, Doppler; Asthma / physiopathology; Vascular Remodeling, Ventricular Dysfunction.
Introduction
Asthma is characterized by chronic inflammation and remodeling of the airways.1 This remodeling leads to structural changes in the walls of the airways induced by repeated injury and repair, which can cause an irreversible loss of lung function.2 Moreover, asthma can lead to an increase in bronchial angiogenesis3 and remodeling of the pulmonary
vessels, culminating in changes in both bronchial and pulmonary circulation.4
The interaction between respiratory diseases and cardiovascular function is complex. Changes in the structure and function of the right ventricle are associated with pulmonary hypertension.5 Recurring hypoxemia and hypercapnia associated with different mediators and cytokines related to chronic inflammation of the airways in patients with asthma cause pulmonary vasoconstriction and the development of pulmonary hypertension, with the consequent hypertrophy/ dilatation of the right ventricle.6 Diastolic dysfunction of the right ventricle is the earliest hemodynamic change found in patients with asthma due to the increase in the afterload imposed on the ventricle.7 Pulmonary disease affects the size, shape and function of the right ventricle, but altered respiratory function
Echocardiography is a non-invasive, relatively safe, cost effective and easily accessible method for the right ventricle assessment. Tissue Doppler imaging (TDI) has been demonstrated to furnish a quantitative measure of regional velocities in the myocardium as well as systolic and diastolic intervals.8 TDI can detect subclinical abnormalities of the right ventricle in a phase when conventional echocardiographic findings are still within normal ranges,8 thereby enabling the detection of right ventricular dysfunction in the early stage of a disease.9-11
Recent studies on young adults with asthma have employed TDI and found subclinical diastolic dysfunction directly related to the severity of the condition, suggesting that this imaging technique has greater predictive value than conventional echocardiography for the evaluation of right ventricular function9. Similar findings have been reported for children and adolescents in the stable phase of asthma. Shedeed et al.11 evaluated children and adolescents aged 5 to 15 years with mild to severe asthma and found that TDI demonstrated right ventricular dysfunction that was positively correlated with the severity of the condition, despite the conventional echocardiogram being apparently normal. Likewise, Ozdenir et al.10 found a negative correlation between right ventricular dysfunction and peak expiratory flow in children with asthma, suggesting that TDI has important diagnostic value for the early detection and monitoring of heart repercussions in children with asthma.
The clinical phenotype of asthma can differentially affect myocardial performance. Children with asthma and a predominance of shallow breathing exhibit more severe myocardial dysfunction than those with a predominance of wheezing as the manifestation of the condition.12 The aim of the present study was to compare heart function, quality of life, physical activity level, functional exercise capacity and inspiratory muscle strength/endurance in young patients with mild-to-moderate asthma and healthy controls to determine the impact of this condition on echocardiographic variables.
Methods
Study population
Male and female children and adolescents from 10 to 16 years with mild to moderate asthma were enrolled in the present study. Asthma severity was established based on the guidelines of the Global Strategy for Asthma Management and Prevention.13 The control group comprised of children and adolescents considered healthy. The groups were matched for sex and age.
Inclusion criteria
The group with asthma comprised children and adolescents with clinical and spirometric diagnosis of asthma, for more than 30 days with no history of acute upper or lower airway infection or exacerbation of the condition. The participants in the control group had a normal clinical history and normal lung function.
Exclusion criteria
Children and adolescents with acute or chronic lung disease, major thoracic deformities, neuromuscular, cardiovascular,
digestive, rheumatic, osteoarticular or genital-urinary disorders, genetic syndromes or any adverse health conditions that limited the safe performance of the tests proposed in the protocol were excluded from the study.
Evaluation protocol
Height (meters) and weight (kilograms) were measured using an anthropometric scale (FilizolaTM, São Paulo, SP, Brazil). The tests were conducted in two steps. Step 1 – spirometric analysis was performed to confirm the diagnosis and classification of asthma. Next, the quality of life and baseline physical activity questionnaires were administered. The strength and endurance of the inspiratory muscles were then measured. Functional capacity was evaluated using the six-minute walk test (6MWT) 30 minutes after the evaluation of the inspiratory muscles. Step 2 – Echocardiography was performed. The order of the two steps was determined randomly and a maximum interval of 15 days was respected between steps.
Pulmonary function test
The spirometric variables analyzed were forced vital capacity (FVC), forced expiratory volume in the first second of FVC (FEV1) and the Tiffeneau index (FEV1/FVC). The group with asthma was also submitted to the bronchodilator test 20 minutes after the inhalation of salbutamol (400 μg/dose) distributed in four inhalations of 100 μg with a one-minute period between inhalations. Predicted values were analyzed and described using the equations proposed by Polgar and Promadhat.14 An increase in FEV
1 equal to or greater than 12% of the predicted after the administration of salbutamol confirmed the variable limitation to airflow.
Evaluation of maximum inspiratory pressure
Maximum inspiratory pressure (MIP) was evaluated using an analog pressure gauge (MDI® model MVD300, Porto Alegre, Brazil) beginning from residual volume. At least five reproducible measurements were taken and the maneuvers were repeated until the two highest measurements did not differ by more than 5%.15 The highest measurement was used to establish the load for the evaluation on inspiratory muscle endurance.
Evaluation of inspiratory muscle endurance
Inspiratory muscle endurance was evaluated after the determination of MIP, using a modified version of the protocol proposed by Sette et al.16 Inspiratory muscle endurance was defined as the maximum time tolerated of spontaneous breathing with a load corresponding to 30% of MIP until exhaustion, which was defined as the inability to overcome inspiratory resistance in two consecutive attempts. The criteria for interrupting the test were intense weariness, dizziness, discomfort, cheek pain or peripheral oxygen saturation (SpO2) less than 85%.
Evaluation of functional capacity using the 6MWT
to walk as fast as possible along a 30-meter flat corridor marked every three meters and received standardized verbal encouragement every 30 seconds by the same evaluator. A second evaluator remained at one of the extremities of the track to assist in the data collection at the beginning and end of the test. Blood pressure (BP), respiratory rate (RR), heart rate (HR), SpO2, and the Borg dyspnea score at rest and during exertion were the variables measured at the beginning and end of the test. The 6MWT was performed twice, with a 30-minute rest interval between tests. The test on which the participant travelled the longer distance was considered in the statistical analysis. The criteria for interrupting the test were extreme weariness, SpO2 less than 85% or any other discomfort. The participant was told that the test could be interrupted at any type if he/she felt any discomfort. Dyspnea at rest and during exertion was evaluated using the modified Borg scale,17 which is scored from 0 to 10 points based on verbal responses that correspond to no or maximum shortness of breath, respectively.
Evaluation of quality of life
Quality of life was evaluated using the Pediatric Quality of Life InventoryTM version 4.0 (PedsQL 4.0).18,19 Self-assessments were available for the following age groups: 5 to 7, 8 to 12 and 13 to 18 years. The items on the forms for each age group are similar, differing only in terms of the use of language adequate to the level of development. The quality of life of the group with asthma was also evaluated using the Paediatric Asthma Quality of Life Questionnaire (PAQLQ),20 which has been translated and culturally adapted to Brazilian Portuguese for children and adolescents aged 7 to 17 years.21
Evaluation of baseline physical activity
Physical activity was evaluated using the Physical Activity Questionnaire – Child (PAQ-C),22 which measures the level of physical activity of children and adolescents in the previous week.
Evaluation of echocardiographic variable
A single pediatric cardiologist who was blinded to the respiratory status of the participants performed the echocardiogram. The exam was performed with the participant positioned in left lateral and dorsal decubitus. The Toshiba echocardiograph was used with variable frequency transducers from 2.0 to 7.0 MHz. At least five consecutive beats were obtained from the parasternal window to determine the inner diameters of the ventricles. The exams were recorded and analyzed offline by two specialists in pediatric echocardiography.
The left and right ventricular functions were assessed by two-dimensional echocardiography: M-mode, color-flow imaging, standard pulsed-wave Doppler and TDI, according to guidelines of the American Society of Echocardiography. The following data were collected for statistical evaluation: measurements of aortic dimension, left atrium, right ventricle anterior wall, right ventricular end-diastolic dimension, interventricular septum, left ventricular end-diastolic dimension, left ventricular systolic dimension and left ventricle posterior wall obtained by the M mode paraesternal
long and short axis view. There was no patient with congenital heart disease and all of them had symmetric left ventricular systolic function.
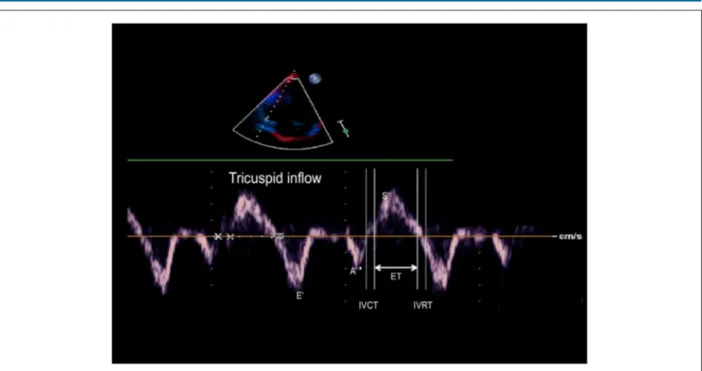
The apical four-chamber view enables studying blood inflow through the atrioventricular valves. The early (E) and late (A) diastolic velocities of mitral and tricuspid valves and E/A ratio were used to evaluate biventricular filling function. TDI was used to evaluate cardiac load and determine the myocardial performance index (MPI). The left ventricular TDI was achieved at the lateral wall through the mitral annulus, whereas the right ventricular TDI was achieved through the tricuspid lateral annulus. The recordings of peak early (E’) and late (A’) diastolic velocities, E´/A´ ratio, systolic (S´) annular velocity, isovolumetric relaxation time (IVRT) and isovolumetric contraction time (IVCT) were obtained in the apical four-chamber view. MPI is defined as the IVCT and IVRT divided by the ejection time (ET) (Figure 1).
The right ventricular systolic function was assessed by fractional area change (FAC), derived from tricuspid lateral annular systolic velocity wave (S’) and tricuspid annular plane systolic excursion (TAPSE).
Pulmonary systolic arterial pressure (PSAP) was also estimated using two methods. Pulsed-wave Doppler tracing across the pulmonary valve was performed using the pulmonary acceleration time (PAT) by left parasternal short-axis view (Figure 2). The normal profile is symmetrical in shape. When pulmonary pressure and pulmonary vascular resistance are high, the peak occurs earlier. The other method was measuring maximal tricuspid regurgitation velocity, applying the modified Bernoulli equation to convert this value into pressure values and adding the estimated right atrial pressure (RAP). Normal RAP was considered 5 mmHg. PSAP = tricuspid regurgitation gradient + RAP. PSAP = (Vmax² x 4) + RAP. Normal systolic arterial pressure is up to 30 mmHg at rest and up to 40 mmHg during exercise.
Sample size
In order to calculate the sample size, we considered as objective to test the equality of the means of the mitral E-wave velocity among the groups of asthmatic patients and controls.23 In order to detect a minimum difference of 4.7 cm/s between means, with a significance of 5%, minimum power of 80%, and variance based on a previous study,9 it was necessary to obtain a ratio of 0.9 between controls/asthmatics, corresponding to 20 asthmatic children and 18 controls.
Statistical analysis
Figure 1 – Tissue Doppler imaging performed at tricuspid annulus in apical 4-chamber view (E’- peak early diastolic annular tricuspid velocity; A’: peak late diastolic annular tricuspid velocity; S´: systolic an nular velocity; IVRT: isovolumetric relaxation time; IVCT: isovolumetric contraction time; ET: ejection time)
La Jolla, CA, USA). A p-value < 0.05 was considered indicative of statistical significance.
Results
Anthropometric and pulmonary function test data
Control and asthmatic groups were similar with regard to age, weight, height, and body mass index (BMI). FEV1 and the Tiffeneau index (FEV1/FVC) were significantly lower in
the group with asthma than the control group (Table 1). All asthmatic patients were clinically stable. Of the 20 patients, 86.95% presented mild asthma, 8.70% moderate asthma and 4.35% very severe asthma.
Echocardiographic characteristics
In the present study, conventional and tissue echocardiographic parameters in healthy and asthmatic children and adolescents free of any cardiovascular symptoms were assessed.
Figure 2 – Pulsed-wave Doppler of pulmonary artery (PAT: pulmonary acceleration time = interval from onset of pulmonary flow to peak velocity; shorter acceleration
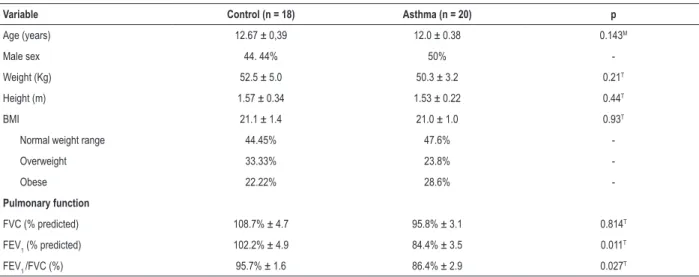
Table 1 – Anthropometric data, and pulmonary function test in control and asthmatic groups
Variable Control (n = 18) Asthma (n = 20) p
Age (years) 12.67 ± 0,39 12.0 ± 0.38 0.143M
Male sex 44. 44% 50%
-Weight (Kg) 52.5 ± 5.0 50.3 ± 3.2 0.21T
Height (m) 1.57 ± 0.34 1.53 ± 0.22 0.44T
BMI 21.1 ± 1.4 21.0 ± 1.0 0.93T
Normal weight range 44.45% 47.6%
-Overweight 33.33% 23.8%
-Obese 22.22% 28.6%
-Pulmonary function
FVC (% predicted) 108.7% ± 4.7 95.8% ± 3.1 0.814T
FEV1 (% predicted) 102.2% ± 4.9 84.4% ± 3.5 0.011
T
FEV1 /FVC (%) 95.7% ± 1.6 86.4% ± 2.9 0.027T
Data expressed as mean ± SEM. BMI: body mass index; FVC: forced vital capacity; FEV1: forced expiratory volume in first second of FVC; FEV1/FVC: Tiffeneau index. Comparison between the two groups was made through the t-student or non-parametric statistical test Mann-Whitney test. T t-Student and MMann-Whitney.
TAPSE, FAC% and S’ were similar in both asthmatic and control groups. MPI was higher in asthmatic group. TDI of right diastolic function revealed that E', A' and the E'/A' ratio, evaluated in the tricuspid annulus, differed significantly between groups. Similarly, E and A diastolic annular tricuspid velocity and E/A differed significantly between groups (Table 2). Moreover, the IVRT was significantly (p = 0.0007) higher in asthmatic group (57.15 ± 0.97 ms) in relation to control (52.28 ± 0.87 ms) group.
Although PAT and PASP were within normal limits (> 130 ms and < 35 mmHg, respectively), these parameters differed significantly between the control and asthmatic groups. PAT was lower (p < 0.0001) and PASP (p < 0.0002) was higher in the asthma group (114.3 ± 3.70 ms and 25.40 ± 0.54 mmHg) than the control group (135.30 ± 2.28 ms and 22.22 ± 0.40 mmHg).
Table 3 shows that S’ was lower and the MPI was higher in the group with asthma. TDI of left diastolic function revealed that both E' and A' differed significantly between groups. Peak E and A diastolic annular mitral velocity and E/A differed significantly between groups.
Among the 18 healthy children and adolescents submitted to echocardiograms, nine were submitted to an evaluation of inspiratory muscle endurance and functional capacity, along with the administration of the questionnaires on quality of life and level of physical activity. The group with asthma was submitted to all tests employed in the present study.
Inspiratory muscle endurance
No significant differences between control and asthma groups were found regarding MIP (109.4 ± 14.19 cmH2O and 92.14 ± 5.62 cmH2O, p = 0.178) or baseline dyspnea (0.14 ± 0.09 and 0.18 ± 0.10, p = 0.871). Despite the shorter respiratory muscle endurance time in the group with
asthma (128.9 ± 14.08 s), the difference did not achieve statistical significance in comparison with control group (154.9 ± 46.69 s). Final Borg scale scores were significantly higher in comparison to the baseline evaluation in both groups. Moreover, the group with asthma (6.1 ± 0.39) had significantly (p = 0.0129) higher final Borg scores in comparison to the control group (3.67 ± 0.41).
Baseline physical activity and functional exercise capacity
Mean baseline physical activity, evaluated by PAQ-C, was similar (p = 0.65) in both control (2.2) and asthmatic (2.04) groups. The mean number of hours spent in front of the television per day was five hours in the control group and 5.71 hours in the group with asthma.
The functional exercise capacity was evaluated by 6MWT. All participants completed the test without interruption. No significant differences between groups were found regarding the cardiopulmonary variables (BP, HR, SpO2, and dyspnea). The walked distance did not differ (p = 0,239) between control (327.3 ± 15.73 m) and asthma (328.8 ± 8.61 m) groups.
Evaluation of quality of life
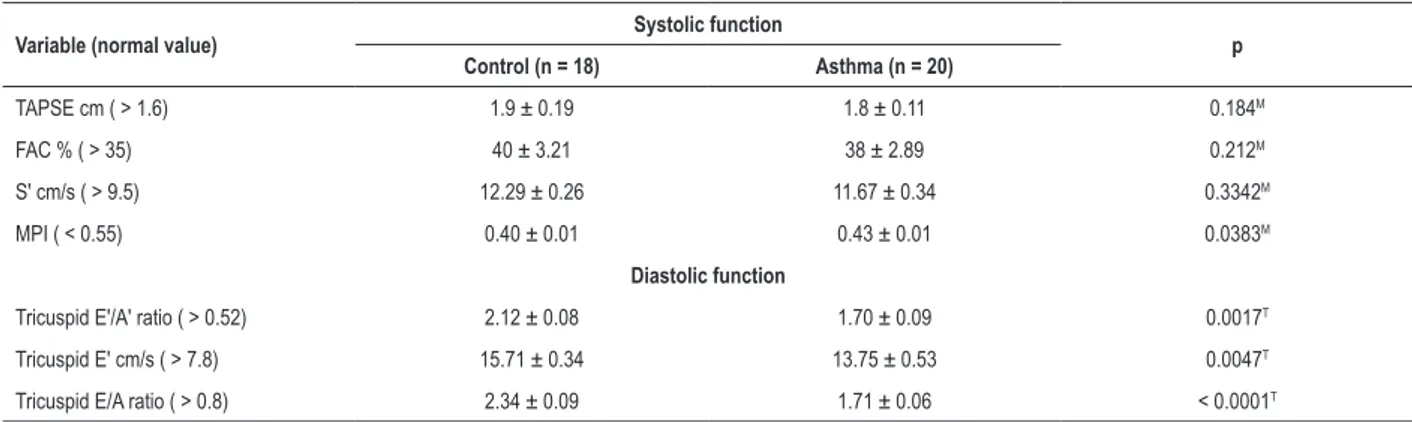
Table 2 – Doppler echocardiogram parameters of right ventricle systolic and diastolic function in control and asthmatic groups
Variable (normal value) Systolic function p
Control (n = 18) Asthma (n = 20)
TAPSE cm ( > 1.6) 1.9 ± 0.19 1.8 ± 0.11 0.184M
FAC % ( > 35) 40 ± 3.21 38 ± 2.89 0.212M
S' cm/s ( > 9.5) 12.29 ± 0.26 11.67 ± 0.34 0.3342M
MPI ( < 0.55) 0.40 ± 0.01 0.43 ± 0.01 0.0383M
Diastolic function
Tricuspid E'/A' ratio ( > 0.52) 2.12 ± 0.08 1.70 ± 0.09 0.0017T
Tricuspid E' cm/s ( > 7.8) 15.71 ± 0.34 13.75 ± 0.53 0.0047T
Tricuspid E/A ratio ( > 0.8) 2.34 ± 0.09 1.71 ± 0.06 < 0.0001T
Data expressed as mean ± SEM. TAPSE: tricuspid annular plane systolic excursion; FAC %: fractional area change; S’: systolic myocardial velocity; MPI: myocardial performance index; E’: early diastolic myocardial velocity; A’: late diastolic myocardial velocity; E: peak early diastolic annular tricuspid velocity; A: peak late diastolic annular tricuspid velocity (atrial contraction). Data analysis for comparison between the two groups was made through the t-student or non-parametric statistical test Mann-Whitney test. T t-Student and MMann-Whitney. In the tricuspid valve, the value of MPI is 0.39 (0.6) and 0.43 (0.6) for control and asthmatic groups.
Discussion
The present findings demonstrate for the first time that PAT was significantly lower and PSAP was significantly higher in the group with asthma compared to the controls. TDI has been used to evaluate quantitative measurements of regional velocities of the myocardium and both the systolic and diastolic intervals.8 TDI enables the detection of right ventricular dysfunction in the early stages of respiratory disease.9 In the current study, significant differences between groups were found regarding E' and A' evaluated in the tricuspid and mitral annuli. In addition, the MPI of the right and left ventricles was significantly higher in the group with asthma. Interestingly, respiratory muscle performance, baseline physical activity level and exercise capacity were similar in both groups. Taken together, these findings suggest that echocardiographic parameters, especially TDI parameters, can be useful as a complementary evaluation for patients with asthma, allowing the early detection of repercussions on the heart.
The interaction between respiratory diseases and cardiovascular function is complex. Changes in the structure and function of the right ventricle are associated with pulmonary hypertension.5 In the present study, although the conventional echocardiogram demonstrated no evidence of changes in the structure of the right ventricle, the group with asthma exhibited a reduction in PAT and an increase in PSAP in relation to control group. Recent study has demonstrated that PAT inversely correlates with right heart catheterization-measured pulmonary hemodynamics and directly correlates with pulmonary arterial compliance in children.24 Unlike findings described in studies by Shedeed et al.,11 Ozdemir et al.10 and Zedanet al.,12 no right ventricular hypertrophy was found in the group with asthma in the present investigation. Moreover, in the current study the conventional Doppler echocardiogram revealed statistically significant difference between the controls and the group with asthma regarding peak velocities during the early diastole and atrial contraction (E, A and E/A) evaluated Table 3 – Doppler echocardiogram parameters of left ventricle systolic and diastolic function in control and asthmatic groups
Variable (normal value) Systolic function p
Control (n = 18) Asthma (n = 20)
Ejection fraction % (> 35) 69.0 ± 0.47 69.0 ± 0.80 0.4677T
Lateral mitral S' cm/s (> 6.7) 8.01 ± 0.20 7.30 ± 0.21 0.0170M
MPI (< 0.55) 0.34 ± 0.01 0.37 ± 0.01 0.0059T
Diastolic function
Lateral mitral E'/A' ratio (> 0.82) 2.89 ± 0.09 2.52 ± 0.20 0.1161T
Lateral mitral E' cm/s (> 10.0) 14.32 ± 0.25 13.27 ± 0.43 0.0466T
Mitral E/A ratio (> 0.8) 3.42 ± 0.17 2.25 ± 0.14 < 0.0001T
Data expressed as mean ± SEM. S’: systolic myocardial velocity; MPI: myocardial performance index; E’: early diastolic myocardial velocity; A’: late diastolic myocardial velocity; E: peak early diastolic annular mitral velocity; A: peak late diastolic annular mitral velocity (atrial contraction). Data analysis for comparison between the two groups was made through the t-student or non-parametric statistical test Mann-Whitney test. T t-Student and MMann-Whitney. In the mitral valve, the
in the annulus of the mitral and tricuspid valves. In contrast, Shedeed et al.11 found no significant differences in these variables between controls and a group with asthma or between the different degrees of asthma severity.
A number of studies have demonstrated that patients with asthma exhibit diastolic dysfunction.9,11,12 Indeed, in the current study significant differences between the controls and the group with asthma were found regarding myocardial diastolic velocities E' and A’ as well as the E'/A' ratio evaluated in the tricuspid annulus. Similar results were found in the mitral valve annulus, with a reduction in myocardial velocity during early diastole and an increase in myocardial velocity during atrial contraction. A significant increase in the IVRT was also found in the group with asthma, contributing to a significant increase in the MPI. In contrast, the increase in the MPI of the left ventricle occurred at the cost of a reduction in systolic velocity in the ventricle.
The clinical phenotype of asthma may differentially affect myocardial performance. Zedanet al.12 compared the MPI of children with asthma according to the phenotype (predominance of shallow breathing or wheezing as the clinical manifestation) and found that those with shallow breathing had a higher MPI. In the present study, the asthmatic children and adolescents were evaluated in a single group based only on the clinical and spirometric diagnosis of asthma.
In the current study, MIP was similar in both groups, despite the significant reductions in FEV1 and Tiffeneau index in the asthmatic group. The results of studies involving inspiratory muscle strength in asthmatic children and adolescents are conflicting. Some studies show that there is no difference,25 26 and other studies show that the strength of the inspiratory muscles of children and adolescents with asthma is reduced relative to their peers.27 Similar results were observed in inspiratory muscle endurance. Endurance test was similar in the control and asthmatic groups. However, exertion dyspnea evaluated at the end of the endurance test was significantly more intense in the group with asthma, suggesting that this variable may have a discriminative value between healthy individuals and those with asthma when submitted to the same level of inspiratory muscle overload. There is a number of determinant factors of inspiratory muscle endurance, such as contraction strength and duration, shortening velocity, the relationship between baseline inspiratory pressure (IP) and MIP (IP/MIP) and the inspiratory flow pattern adopted by patients during the evaluation.28 Further studies are needed to clarify the greater shortness of breath in the group with asthma.
The 6MWT is considered a safe, easy-to-administer method for the evaluation of sub-maximum exercise capacity in healthy children and adolescents,29 as well as those with respiratory diseases.30-32 Similar to the results of Basso et al.31 and Soares et al.,27 in the present study, no significant difference between groups was found regarding the distance walked or the cardiovascular variables analyzed before and after the 6MWT. In the same way, studies using other functional capacity assessment methods, such as the shuttle walking test33 and cardiopulmonary exercise test34 also did not observe a difference between asthmatic children and adolescents and control group.
Quality of life is one of the most important outcomes in the evaluation of patients with chronic disease. In the present study, this aspect was evaluated using a generic questionnaire as well as a specific questionnaire for children and adolescents with asthma. Regarding the generic questionnaire, quality of life was similar in both groups with regard to most domains, except the score on the physical domain, which was significantly lower in the group with asthma. In agreement with data described by Basaran et al.35 and Andrade et al.,30 the mean score on the asthma-specific questionnaire was 5.67 ± 0.23, which indicates a good quality of life among the children and adolescents studied in the present investigation.
Limitations of the study
The small sample size could be considered a limitation of the present study. However, even with the small number of participants, it was possible to demonstrate changes in conventional and tissue echocardiographic variables among the children and adolescents with asthma in comparison to the control group. Another limitation regards the evaluation of functional capacity. The 6MWT is considered a sub-maximal exercise test for measuring physical functional capacity. It is possible that the variables analyzed on a maximum cardiopulmonary stress test would be more sensitive in detecting differences in functional capacity between individuals considered healthy and those with asthma. A third limitation was the failure to evaluate the breathing pattern adopted during the respiratory muscle endurance test. The record of inspiratory flow allows the evaluation of inspiratory time, expiratory time, total cycle and the inspiratory time/total cycle ratio, as performance on the endurance test can vary depending on the breathing pattern adopted. The precise mechanism to clarify the difference in exertion dyspnea between healthy individuals and those with asthma during the inspiratory muscle endurance test needs to be determined.
Conclusion
Patients with asthma presented significant changes in diastolic velocities of the myocardium and the MPI of both ventricles, but with no repercussions regarding exercise capacity evaluated using the 6MWT. Further studies are needed to confirm these findings and to evaluate the clinical implications of these abnormalities.
Acknowledgement
This work was supported by the Fundação Lucas Machado (FELUMA), Faculdade Ciências Médicas-Minas Gerais, Pós-Graduação em Ciências da Saúde and Clínica Conrad. Camilla R de Paula, undergraduate student received support from Fundação de Amparo à Pesquisa do Estado de Minas Gerais (FAPEMIG.), Brazil. We are thankful to Isabel Cristina Gomes for additional statistical assistance.
Author contributions
1. Berair R, Hollins F, Brightling C. Airway smooth muscle hypercontractility in asthma. J Allergy (Cairo). 2013;2013:185971. doi: 10.1155/2013/185971.
2. Hirota N, Martin JG. Mechanisms of airway remodeling . Chest. 2013;144(3):1026-32. doi: 10.1378/chest.12-3073.
3. Rodrigues-Machado MG, Magalhaes GS, Cardoso JA, Kangussu LM, Murari A, Caliari MV, et al. AVE 0991, a non-peptide mimic of angiotensin-(1-7) effects, attenuates pulmonary remodelling in a model of chronic asthma. Br J Pharmacol. 2013;170(4):835-46. doi: 10.1111/bph.12318.
4. Harkness LM, Kanabar V, Sharma HS, Westergren-Thorsson G, Larsson-Callerfelt AK. Pulmonary vascular changes in asthma and COPD. Pulm Pharmacol Ther. 2014;29(2):144-55. doi: 10.1016/j. pupt.2014.09.003.
5. Forfia PR, Vaidya A, Wiegers SE. Pulmonary heart disease: the heart-lung interaction and its impact on patient phenotypes. Pulm Circ. 2013;3(1):5-19. doi: 10.4103/2045-8932.109910.
6. Davenport PW, Cruz M, Stecenko AA, Kifle Y. Respiratory-related evoked potentials in children with life-threatening asthma. Am J Respir Crit Care Med. 2000;161(6):1830-5. doi: 10.1164/ajrccm.161.6.9903077.
7. Yu CM, Sanderson JE, Chan S, Yeung L, Hung YT, Woo KS. Right ventricular diastolic dysfunction in heart failure. Circulation. 1996;93(8):1509-14. doi: https://doi.org/10.1161/01.CIR.93.8.1509.
8. Nikitin NP, Witte KK. Application of tissue Doppler imaging in cardiology. Cardiology. 2004;101(4):170-84. doi: https://doi.org/10.1159/000076694.
9. Zeybek C, Yalcin Y, Erdem A, Polat TB, Aktuglu-Zeybek AC, Bayoglu V, et al. Tissue Doppler echocardiographic assessment of cardiac function in children with bronchial asthma. Pediatr Int. 2007 Dec;49(6):911-7. doi: 10.1111/j.1442-200X.2007.02486.x.
10. Ozdemir O, Ceylan Y, Razi CH, Ceylan O, Andiran N. Assessment of ventricular functions by tissue Doppler echocardiography in children with asthma. Pediatr Cardiol. 2013;34(3):553-9. doi: 10.1007/s00246-012-0493-3.
11. Shedeed SA. Right ventricular function in children with bronchial asthma: a tissue Doppler echocardiographic study. Pediatr Cardiol. 2010;31(7):1008-15. doi: 10.1007/s00246-010-9753-2.
12. Zedan M, Alsawah GA, El-Assmy MM, Hasaneen B, Zedan MM, Nasef NA. Clinical asthma phenotypes: is there an impact on myocardial performance? Echocardiography. 2012;29(5):528-34. doi: 10.1111/j.1540-8175.2011.01635.x.
13. Bateman ED, Hurd SS, Barnes PJ, Bousquet J, Drazen JM, FitzGerald M, et al. Global strategy for asthma management and prevention: GINA executive summary. Eur Respir J. 2008;31(1):143-78. doi: 10.1183/09031936.00138707.
14. Polgar G, Promadhat V. (editors). Pulmonary function testing in children: techniques and standards. Philadelphia: Saunders; 1971.
15. Drumond SC, Fontes MJ, Assis I, Duarte MA, Lamounier JA, Lopes Orlandi LC, et al. Comparison of three sets of reference equations for spirometry in children and adolescents with distinct body mass indices. J Bras Pneumol. 2009;35(5):415-22. doi: http://dx.doi.org/10.1590/S1806-37132009000500005.
16. Sette L, Ganassini A, Boner AL, Rossi A. Maximal inspiratory pressure and inspiratory muscle endurance time in asthmatic children: reproducibility and relationship with pulmonary function tests. Pediatr Pulmonol. 1997;24(6):385-90. PMID: 9448229.
17. Borg GA. Psychophysical bases of perceived exertion. Med Sci Sports Exerc. 1982;14(5):377-81. PMID: 7154893.
18. Varni JW, Burwinkle TM, Seid M, Skarr D. The PedsQL 4.0 as a pediatric population health measure: feasibility, reliability, and validity. Ambul Pediatr. 2003;3(6):329-41. doi: http://dx.doi.org/10.1367/1539-4409(2003)003<0329:TPAAPP>2.0.CO;2
19. Klatchoian DA, Len CA, Terreri MT, Silva M, Itamoto C, Ciconelli RM, et al. Quality of life of children and adolescents from Sao Paulo: reliability and validity of the Brazilian version of the Pediatric Quality of Life Inventory version 4.0 Generic Core Scales. J Pediatr (Rio J). 2008;84(4):308-15. doi:10.2223/JPED.1788.
20. Juniper EF, Guyatt GH, Feeny DH, Ferrie PJ, Griffith LE, Townsend M. Measuring quality of life in children with asthma. Qual Life Res. 1996;5(1):35-46. PMID: 8901365.
21. La Scala CS, Naspitz CK, Sole D. [Adaptation and validation of the Pediatric Asthma Quality of Life Questionnaire (PAQLQ) in Brazilian asthmatic children and adolescents]. J Pediatr (Rio J). 2005;81(1):54-60. doi: http:// dx.doi.org/10.1590/S0021-75572005000100011.
22. Crocker PR, Bailey DA, Faulkner RA, Kowalski KC, McGrath R. Measuring general levels of physical activity: preliminary evidence for the Physical Activity Questionnaire for Older Children. Med Sci Sports Exerc. 1997;29(10):1344-9. PMID: 9346166.
References
Jentzsch NS, Botelho CF, Murça TM, Ramalho LFC, Bragança Capuruço CA; Analysis and interpretation of the data: De-Paula CR, Magalhães GS, Jentzsch NS, Botelho CF, Mota CCC, Murça TM, Ramalho LFC, Tan TC, Bragança Capuruço CA, Rodrigues-Machado MG; Statistical analysis: De-Paula CR, Magalhães GS, Jentzsch NS, Murça TM, Ramalho LFC, Bragança Capuruço CA, Rodrigues-Machado MG; Writing of the manuscript: De-Paula CR, Magalhães GS, Botelho CF, Mota CCC, Tan TC, Bragança Capuruço CA, Rodrigues-Machado MG; Critical revision of the manuscript for intellectual content: Mota CCC, Tan TC, Bragança Capuruço CA, Rodrigues-Machado MG.
Potential Conflict of Interest
No potential conflict of interest relevant to this article was reported.
Sources of Funding
There were no external funding sources for this study.
Study Association
This study is not associated with any thesis or dissertation work.
Ethical approval and informed consent
This is an open-access article distributed under the terms of the Creative Commons Attribution License 23. Chow S, Shao J, Wang H. Sample size calculations in clinical research. 2nd
ed. New York: Chapman & Hall/CRC; 2008. ISBN: 9781584889823.
24. Levy PT, Patel MD, Groh G, Choudhry S, Murphy J, Holland MR, et al. Pulmonary artery acceleration time provides a reliable estimate of invasive pulmonary hemodynamics in children. J Am Soc Echocardiogr. 2016;29(11):1056-65. doi: 10.1016/j.echo.2016.08.013.
25. Marcelino AM, da Cunha DA, da Cunha RA, da Silva HJ. Respiratory muscle strength in asthmatic children. Int Arch Otorhinolaryngol. 2012;16(4):492-6. doi: 10.7162/S1809-97772012000400010.
26. Heinzmann-Filho JP, Vendrusculo FM, Woszezenki CT, Piva TC, Santos AN, Barcellos AB, et al. Inspiratory muscle function in asthmatic and healthy subjects: influence of age, nutrition and physical activity. J Asthma. 2016;53(9):893-9. doi: 10.3109/02770903.2016.1165698.
27. Soares AA, Barros CM, Santos CG, Dos Santos MR, Silva JR, Silva Junior WM, et al. Respiratory muscle strength and pulmonary function in children with rhinitis and asthma after a six-minute walk test. J Asthma. 2017 May 10:1-7. doi: 10.1080/02770903.2017.1326133.
28. Rochester DF. Tests of respiratory muscle function. Clin Chest Med. 1988;9(2):249-61. PMID: 3292126.
29. Geiger R, Strasak A, Treml B, Gasser K, Kleinsasser A, Fischer V, et al. Six-minute walk test in children and adolescents. J Pediatr. 2007;150(4):395-9, 399.e1-2. doi: http://dx.doi.org/10.1016/j. jpeds.2006.12.052.
30. Andrade LB, Silva DA, Salgado TL, Figueroa JN, Lucena-Silva N, Britto MC. Comparison of six-minute walk test in children with moderate/severe asthma with reference values for healthy children. J Pediatr (Rio J). 2014;90(3):250-7. doi: 10.1016/j.jped.2013.08.006.
31. Basso RP, Jamami M, Pessoa BV, Labadessa IG, Regueiro EM, Di Lorenzo VA. Assessment of exercise capacity among asthmatic and healthy adolescents. Revista brasileira de fisioterapia. 2010;14(3):252-8. doi: http://dx.doi. org/10.1590/S1413-35552010000300005.
32. Mattiello R, Sarria EE, Stein R, Fischer GB, Mocelin HT, Barreto SS, et al. Functional capacity assessment in children and adolescents with post-infectious bronchiolitis obliterans. J Pediatr (Rio J). 2008;84(4):337-43. doi:10.2223/JPED.1807.
33. Augusto LS, Silva GC, Pinho JF, Aires RD, Lemos VS, Ramalho LF, et al. Vascular function in asthmatic children and adolescents. Respir Res. 2017;18(1):17. doi: 10.1186/s12931-016-0488-3.
34. Moore LE, Bhutani M, Petersen SR, McMurtry MS, Byers BW, Tedjasaputra V, et al. Physical activity, fitness, and vascular health in patients with asthma. J Allergy Clin Immunol. 2015;136(3):809-11.e3. doi: 10.1016/j. jaci.2015.02.033.