Vol.50, n. 5 : pp. 743-752 September 2007
ISSN 1516-8913 Printed in Brazil BRAZILIAN ARCHIVES OF
BIOLOGY AND TECHNOLOGY
A N I N T E R N A T I O N A L J O U R N A L
Nitrogen Forms, pH and Total Carbon in a Soil Incubated
with Treated Sewage Effluent
Adriel Ferreira da Fonseca1*, Uwe Herpin2, Carlos Tadeu dos Santos Dias3 and Adolpho José Melfi2,4
1
Departamento de Ciência do Solo e Engenharia Agrícola; Universidade Estadual de Ponta Grossa; 84.030-900;
[email protected]; Ponta Grossa - PR - Brasil. 2Núcleo de Pesquisa em Geoquímica e Geofísica da Litosfera;
Universidade de São Paulo; Piracicaba - SP - Brasil. 3Departamento de Ciências Exatas; Escola Superior de
Agricultura Luiz de Queiroz - ESALQ; Universidade de São Paulo; Piracicaba - SP - Brasil. 4Departamento de
Ciência do Solo; ESALQ; USP; Piracicaba - SP - Brasil
ABSTRACT
In this study, an experiment under controlled conditions was carried out to determine the effects of secondary-treated sewage effluent (STSE) application on soil nitrogen concentrations (mineral and total), total carbon and soil pH. The soil and STSE used were collected at Lins, São Paulo State, Brazil. A completely randomized design was used, in completed factorial 4x11 (weekly application rates of 0, 100, 150 and 200 mL STSE per kg soil; and, eleven soil incubation periods from 0 to 10 weeks) with four replicates. The STSE was applied simulating common surface irrigation. Seven days after each incubation period, ammonium and nitrate contents were determined. Additionally, pH and total carbon and nitrogen contents were measured in the soil after 10 weeks. STSE application increased the nitrogen content (total and mineral – mainly as nitrate) and soil pH. For the total carbon content no differences were observed.
Key words: Treated sewage effluent, nitrogen, carbon, tropical soil
*
Author for correspondence
INTRODUCTION
Treated sewage effluent (TSE) generated in stabilization pond systems and, still representing a kind of wastewater, can be defined as the “used water of a community or industry that presents inorganic solids and organic matter in suspension or dissolved” (Pescod, 1992). In the Northwestern Region of São Paulo State, there are 195 stabilization pond systems operating by the ‘Companhia de Saneamento Básico do Estado de São Paulo’ (Sabesp), which are producing annually about 46.9 million m3 of TSE (Fonseca, 2001). The common practice to cope with this high
However, in Brazil the utilization of treated sewage effluent for agricultural irrigation is still a recent practice (Fonseca et al., 2005a).
Nitrogen represents the nutrient found in larger concentrations in TSE, occurring predominantly as NH4+-N, with variable proportions of organic nitrogen (ON). According to Feigin et al. (1991), the normal C/N ratio in TSE averages about 5 but can be lower than 1 (Bouwer and Chaney, 1974). The organic carbon and nitrogen in the TSE probably originate mainly from dead algae material, whose decompostion products are added as carbohydrates to the fresh organic matter fraction of the soil (Snow et al., 1999). The understanding of effluent-N transformation processes in soil in the NO3--N dynamics represents key factors for the sustainable management of TSE (Bond, 1998). In agro-ecosystems irrigated with TSE, excessive NO3--N concentrations in soils may lead to the risk of groundwater contamination, affecting the water quality for human consumption (Bouwer, 2000). The excess NO3--N in potable water (and in foods)
may lead to infant mortality
(methaemoglobinaemia, known as blue baby syndrome) resulting from a reduction of NO3- to NO2- by microorganisms in child’s stomach and in the rumen of animals. In the blood, NO2- binds to hemoglobin that prevents binding of oxygen for the transport to the cells (Stevenson, 1986).
However, the loss of NO3--N by denitrification can lead to undesirable N-outputs from soils e.g. in the form of gases (NOx, N2O), which are known to increase the greenhouse effect. NOx is characterized as a chemical reactive gas that regulates the production of ozone in the troposphere and represents a basic condition for acid rain and N2O contributes to the degradation of the stratosphere (Hall and Matson, 1999). Therefore, the effects of TSE application on N dynamics, especially in tropical Brazilian soils requires detailed information.
The objective of the present study was to determine the effects on mineral-N (NH4+-N + NO3--N), total nitrogen (TN), total carbon (TC) concentrations and soil pH after secondary-treated sewage effluent (STSE) application during different incubation periods under controlled conditions.
MATERIAL AND METHODS
Soil and effluent characterization
Soil samples were collected from the 0-20 cm layer of a dystrophic red latosol (Typic Haplustox), sandy clay loam, in a fallow area at the city of Lins (22º21’S, 49º50’W), São Paulo State (SP), Brazil. The soil samples were air dried, sieved at 2 mm and submitted to chemical and physical analyses, according to methods described by Raij et al. (2001) and EMBRAPA (1997), respectively. The initial soil results showed the following values: pH (CaCl2) = 5.2; TC = 13.6 and TN = 1.2 g kg-1; P = 4.1 mg kg-1; H+Al, Ca, Mg and K = 30.1, 15.1, 5.5 and 2.3 mmolc kg-1, respectively; water retention capacity = 250 mL kg-1 of soil; sand, silt and clay = 780, 60 and 160 g kg-1, respectively.
The STSE used in the experiment was collected after sewage treatment in a stabilization pond system (three anaerobic ponds + three facultative ponds) operated by the Sabesp, municipal district of Lins, SP. Information about the treatment process is given in Fonseca et al. (2005a). The chemical analysis of the STSE showed the following results: pH = 7.8; EC (electrical conductivity) = 0.84 dS m-1; alkalinity (as CaCO3), TC, TN, ON, NH4+-N, NO3--N and total-P = 362, 57.2, 49.0, 4.8, 42.7, 1.5 and 6.4 mg L-1, respectively; the C/N ratio was 1.2. Alkalinity was determined by titration with 0.025 mol L-1 sulphuric acid solution. Total-P content was measured by the molecular absorption spectroscopy (MAS) after nitric-perchloric digestion. The determinations of pH, EC, TC, TN, ON, NH4+-N and NO3--N were performed according to the methods suggested by Kiehl (1985). The STSE used in the experiment was frozen at -20ºC immediately after sampling and defrosted before soil incubation.
Experimental design and chemical analysis of the soil
divided in three application portions during each incubation period. The effluent was uniformly distributed to the soil surface by means of a dispenser simulating common surface irrigation. Following the effluent application scheme over time the soil samples of the control, E100, E150 and E200 incubated during 70 days received 0, 1000, 1500 and 2000 mL STSE per kg of soil, respectively. These STSE rates were equivalent to an irrigation amount of 0, 274, 411 and 548 mm that corresponded to application rates of (i) 0, 134, 201 and 268 kg ha-1 of TN, respectively, considering a bulk density of 1.37 Mg m-3 in the 0-20 cm layer; or (ii) 0, 49, 73.5 and 98 mg TN per kg of soil, respectively.
Each experimental unit consisted of an unperforated 250 mL plastic pot, filled with 100 g of sieved air-dried soil. This soil amount was based on a biosolid incubation method suggested by CETESB (1999) for evaluating the potential availability of the biosolid-N fraction in soil, which has modified slightly. For example, in order to avoid anaerobic conditions in the experimental units after the different STSE application volumes, the evaporation process was accelerated in a forced air oven using a temperature of 31ºC (± 2ºC). Twice a day the pots were weighed and the calculated evaporated water was replaced with the deionized water (control) or STSE (E100, E150 and E200). During the experimental period, soil humidity was maintained at 70% of the soil water retention capacity.
At the end of each incubation period (seven days after the last STSE application), the soil samples were collected and homogenized manually for the chemical analyses. Subsequently, the mineral-N of the humid soil samples was extracted by a 1.0 mol L-1 KCl solution in a 1:10 (m:v) soil:solution ratio, according to a modified method of Mulvaney (1996). NH4+-N and NO3--N were determined using conductivity and colorimetric methods, respectively, by means of MAS in a continuous flow injection analysis system, according to Ruzicka and Hansen (1975). In the soil samples incubated during 70 days, pH was measured in 0.01 mol L-1 calcium chloride solution, as proposed by Raij et al. (2001). TN and TC contents were determined, according to Nelson and Sommers (1996).
Statistical analysis
The NH4+-N, NO3--N and mineral-N (NH4+-N + NO3--N) were submitted to analyses of variance.
The variables which showed significant F test (P<0.05) were submitted to mean comparisons by Tukey test (P<0.05). Subsequently, principal component analyses (PCA) (maximum likelihood) were carried out using the parameters NH4+-N + NO3--N.
The pH values, TN and TC concentrations (after 70 days of incubation) were also submitted to analyses of variance. Significant data (F test, P<0.05) were fit to linear or quadratic models for the evaluation of the accumulation rates following STSE incubation. All the statistical analyses were carried out using the SAS program, version 8.02 (SAS System, 1999).
RESULTS AND DISCUSSION
Mineral nitrogen
(Table 1), showing the importance of STSE as a source of NH4+-N in agro-systems (Hook, 1981). In the other incubation periods (except 63 days), NH4+-N concentrations normally decreased after the use of higher levels of STSE (Table 1), which was attributed to a temporary immobilization of NH4+-N in the soil favored by STSE as well as to nitrification process (Fig. 1). After the application of STSE, the NO3--N concentrations in the soil increased continuously along the experimental
period and showed a distinct rise in the incubation periods of 63 and 70 days (Table 1 and Fig. 1). The accumulation of NO3--N in all the treatments indicated the adequate soil humidity and aeration conditions for the mineralization and nitrification. The soil mineral-N concentrations increased in all incubation periods due to increasing STSE application rates (Table 1). Higher mineral-N concentrations were found in the later incubation periods (63 and 70 days) (Table 1 and Fig. 1).
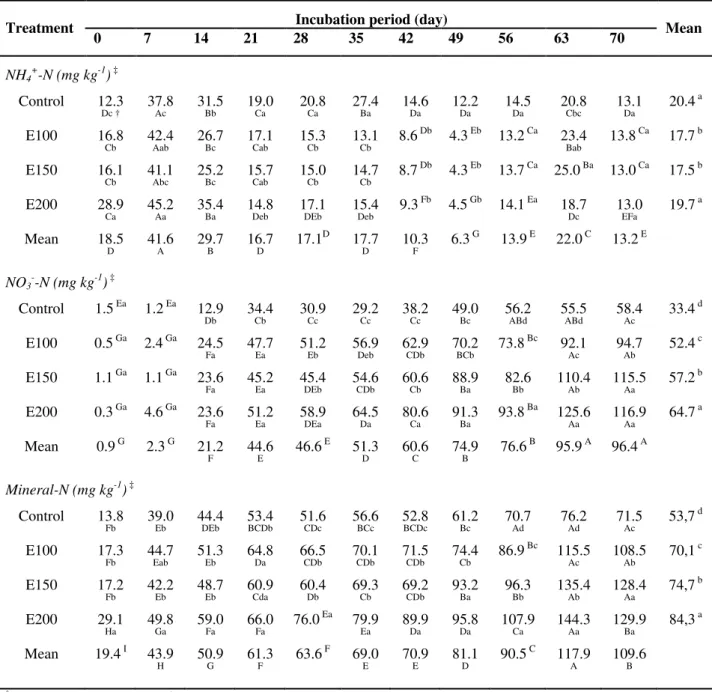
Table 1 - Concentrations of NH4+-N, NO3--N and mineral-N (NH4+-N + NO3--N) after weekly application of
secondary-treated sewage effluent (STSE) with application rates of 0 (control), 100 (E100), 150 (E150) e 200 mL kg-1 soil (E200) during an incubation period of 70 days.
Incubation period (day) Treatment
0 7 14 21 28 35 42 49 56 63 70 Mean
NH4+-N (mg kg-1) ‡
Control 12.3
Dc † 37.8Ac 31.5Bb 19.0Ca 20.8Ca 27.4Ba 14.6Da 12.2Da 14.5Da 20.8Cbc 13.1Da 20.4
a
E100 16.8
Cb 42.4Aab 26.7Bc 17.1Cab 15.3Cb 13.1 Cb 8.6 Db
4.3 Eb 13.2 Ca 23.4
Bab 13.8
Ca
17.7 b E150 16.1
Cb 41.1Abc 25.2Bc 15.7Cab 15.0Cb 14.7Cb 8.7
Db
4.3 Eb 13.7 Ca 25.0 Ba 13.0 Ca 17.5 b E200 28.9
Ca 45.2Aa 35.4Ba 14.8Deb 17.1DEb 15.4Deb 9.3
Fb
4.5 Gb 14.1 Ea 18.7
Dc 13.0EFa 19.7
a
Mean 18.5
D 41.6A 29.7B 16.7D 17.1
D
17.7
D 10.3F 6.3
G
13.9 E 22.0 C 13.2 E
NO3--N (mg kg-1) ‡
Control 1.5 Ea 1.2 Ea 12.9
Db 34.4 Cb 30.9 Cc 29.2 Cc 38.2 Cc 49.0 Bc 56.2 ABd 55.5 ABd 58.4 Ac
33.4 d E100 0.5 Ga 2.4 Ga 24.5
Fa 47.7Ea 51.2Eb 56.9Deb 62.9CDb 70.2BCb 73.8
Bc
92.1
Ac 94.7Ab 52.4
c
E150 1.1 Ga 1.1 Ga 23.6
Fa 45.2 Ea 45.4 DEb 54.6 CDb 60.6 Cb 88.9 Ba 82.6 Bb 110.4 Ab 115.5 Aa
57.2 b E200 0.3 Ga 4.6 Ga 23.6
Fa 51.2Ea 58.9DEa 64.5Da 80.6Ca 91.3Ba 93.8
Ba
125.6
Aa 116.9Aa 64.7 a
Mean 0.9 G 2.3 G 21.2
F 44.6E 46.6
E
51.3
D 60.6C 74.9B 76.6
B
95.9 A 96.4 A
Mineral-N (mg kg-1) ‡
Control 13.8
Fb 39.0Eb 44.4DEb 53.4BCDb 51.6CDc 56.6BCc 52.8BCDc 61.2Bc 70.7Ad 76.2Ad 71.5Ac 53,7
d
E100 17.3
Fb 44.7Eab 51.3Eb 64.8Da 66.5CDb 70.1CDb 71.5CDb 74.4Cb 86.9
Bc
115.5
Ac 108.5Ab 70,1 c
E150 17.2
Fb 42.2Eb 48.7Eb 60.9Cda 60.4Db 69.3Cb 69.2CDb 93.2Ba 96.3Bb 135.4Ab 128.4Aa 74,7 b
E200 29.1
Ha 49.8Ga 59.0Fa 66.0Fa 76.0
Ea
79.9
Ea 89.9Da 95.8Da 107.9Ca 144.3Aa 129.9Ba 84,3 a
Mean 19.4 I 43.9
H 50.9G 61.3F 63.6
F
69.0
E 70.9E 81.1D 90.5
C
117.9
A 109.6B
‡ Coefficients of variation for NH
4+-N, NO3--N and mineral-N were 9.8, 7.8 and 5.5%, respectively.
† Mean values in the lines (incubation periods) with same capital letters and mean values in the columns (treatments) with same small letters were
-20 0 20 40 60 80 100
0 10 20 30 40 50 60 70
-20 0 20 40 60 80 100
0 10 20 30 40 50 60 70
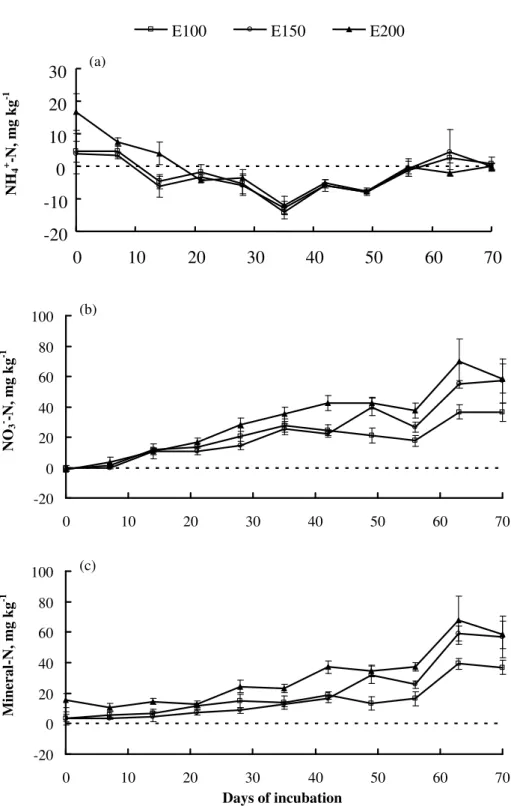
Figure 1 - Soil concentrations (n = 4 ± standard deviation) of NH4+-N (a), NO3--N (b) and
mineral-N (NH4+-N + NO3--N) (c) after weekly application of secondary-treated
sewage effluent (STSE) with application rates of 100 (E100), 150 (E150) e 200 mL kg-1 soil (E200) during 11 incubation periods. In order to obtain only the effect of STSE application rates to soil, the values at the control were subtracted from the values observed at E100, E150 and E200
-20 -10 0 10 20 30
0 10 20 30 40 50 60 70
E100 E150 E200
Days of incubation
(a)
(b)
N
H4
+ -N
,
m
g
k
g
-1
N
O3
- -N
,
m
g
k
g
-1
M
in
er
a
l-N
,
m
g
k
g
-1
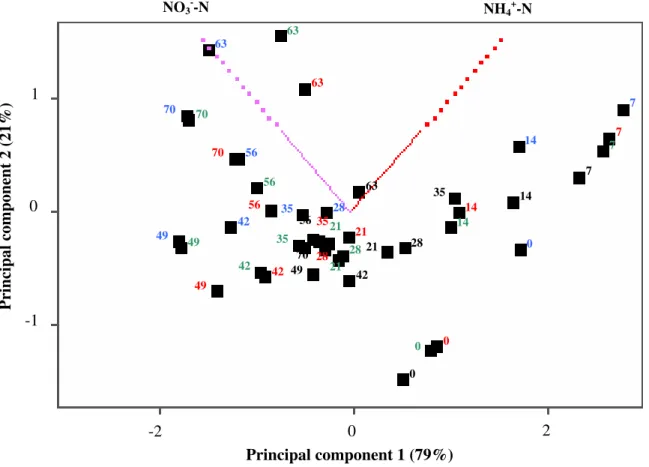
The increase of mineral-N is expected to be influenced by the following factors: (i) predominance of the effluent-N in mineral form; (ii) mineralization of the effluent organic N fraction, consisting predominantly of dead algae with fast decomposition rates (Snow et al., 1999); (iii) maintenance of ideal conditions for mineralization of organic matter, as humidity (Myers et al., 1982), temperature (Artiola and Pepper, 1992), resupply of O2 (Stanford and Smith, 1972); (iv) low C/N ratio of the STSE. The transformation of NH4+-N to NO3--N was fast (Fig. 1) and showed a partial positive correlation (r = 0.89**) between mineral-N and NO3--N. The PCA indicated that the treatments with high amounts of STSE were primarily positively correlated with the high concentrations of NO3--N (Fig. 2). On the other hand, NO3--N were inversely related to concentrations of NH4+-N (Fig. 2). The potential of STSE to increase soil NO3--N concentrations has been reported in various studies on different agro-systems (Hook, 1981; Feigin et al., 1991; Bond, 1998).
In the present study, the quantification of the losses of effluent-N due to volatilization and denitrification was not carried out. Nevertheless, the differences in NO3--N and mineral-N soil concentrations between E150 and E200 were lower in the later incubation periods (63 and 70 days) (Table 1 and Fig. 1). It could be suggested that N losses by volatilization and denitrification were higher in the later periods, mainly at E200. The volatilization of NH3-N in acid soils irrigated with the alkaline effluent was a well-known fact (Smith et al., 1996) and might have also occurred in this study. Denitrification processes have been found to be dependent on the effluent organic C concentration (Bouwer and Chaney, 1974; Schipper et al., 1996), the available C in soil (Feigin et al., 1991) and, the irrigation effect on soil resulting in decrease of O2 (Polglase et al., 1995). In this context, a two fold (Schipper et al., 1996) to fifty fold increases (Friedel et al., 2000) of denitrification rates in TSE irrigated soils have
been reported. Also, the microbial N immobilization should be considered because: (i) most of the effluent-N occurred as NH4+-N that represented the preferred microbial inorganic-N (Stevenson, 1986); (ii) after STSE application to the soil, TN concentrations increased (Fig. 3a), compared to approximately constant TC concentrations (Fig. 3b). All these mechanisms mentioned above might be responsible for the loss of N after STSE application.
Total nitrogen, total carbon and soil acidity
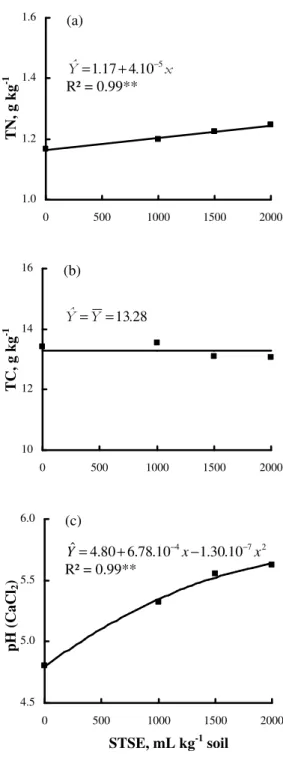
As shown in Fig. 3a, soil TN concentrations increased with the increasing rates of applied STSE. Increases of TN concentrations due to TSE application to the soil were also observed by Quin and Woods (1978) and Friedel et al. (2000) in field experiments on different soils receiving TSE over several years.
Figure 2 - Presentation of principal component analysis considering the effects of weekly application of secondary-treated sewage effluent on soil NH4+-N (representing 21%
of total variance) and soil NO3--N (representing 79% of total variance) using
application rates of 0 (control), 100 (E100), 150 (E150) and 200 mL per kg of soil (E200) during 11 incubation periods (0, 7, 14, 21, 28, 35, 42, 49, 56, 63 and 70 days). Each point represents the mean of four replicates. Incubation periods plotted in black, red, green and blue colors correspond to control, E100, E150 and E200, respectively
In the control, soil pH (Fig. 3c) was slightly lower (pH=4.8) after 70 days of STSE incubation compared to pH in the beginning of the experiment (pH=5.2). This suggested that temperature, humidity and aeration conditions were adequate for soil C mineralization (Stanford and Smith, 1972) and thus, resulting in the production of CO2, H2O, organic acids, inorganic compounds (Stevenson, 1986) accompanied by a release of H+, resulting in a decrease of soil pH (Bolan et al., 1991). On the other hand, STSE
application to the soil caused pH increases (Fig. 3c) and disagreed with Bouwer and Idelovitch (1987), who stated that TSE irrigation did not significantly affect soil pH due to the high soil buffer capacity. Also, several other studies reported slight increases (smaller than one unit) of soil pH in different agro-systems irrigated with TSE (Quin and Woods, 1978; Stewart et al., 1990; Schipper et al., 1996; Falkiner and Smith, 1997; Fonseca et al., 2005b).
-2 0 2
-1 0 1
Principal component 1 (79%)
P
ri
n
ci
p
al
c
om
p
on
en
t 2 (
21%)
63
63
63
63
70 70
70
70
56
56
56
56
49
49
49
49
42 42
42
42
21 21
21
21
28
28 28
28
35
35
35
35
14 14
14
14
7
7 7
7
0
0 0
1.0 1.2 1.4 1.6
0 500 1000 1500 2000
10 12 14 16
0 500 1000 1500 2000
4.5 5.0 5.5 6.0
0 500 1000 1500 2000
Figure 3 - Total nitrogen (TN) (a), total carbon (TC) (b), and pH (c) after application of secondary-treated sewage effluent (STSE) considering the total amount (1000, 1500 and 2000 mL STSE kg-1 soil) of the applied STSE over ten weeks. Each point represents the mean of four replicates. ** Significant at 1% of probability
In the present study, the increases of soil pH after STSE application could be attributed to: (i) high effluent pH (Stewart et al., 1990); (ii) addition of exchangeable cations and alkalinity by effluent
(Falkiner and Smith, 1997); (iii) increase of denitrification (Friedel et al., 2000), consuming one mol of H+ for each mol denitrified NO3 -(Bolan et al., 1991); (iv) addition of organic
T
C
,
g
k
g
-1
28 13. Y
Yˆ = =
(b)
p
H
(
C
a
C
l2
)
STSE, mL kg-1 soil
2 7 4 1.30.10 10
. 78 . 6 80 . 4
ˆ x x
Y= + − − −
R² = 0.99** (c)
T
N
,
g
k
g
-1
x . .
Yˆ =117+410−5 R² = 0.99**
residues to the soil followed by decarboxilation and desamination (organic anions and aminoacids) processes consuming protons (Yan et al., 1996); (vi) interaction of these factors associated with low CEC of the soil (Stevenson, 1986).
ACKNOWLEDGMENTS
Our sincere gratitude is extended to Fundação de Amparo à Pesquisa do Estado de São Paulo (FAPESP) for supporting this work.
RESUMO
A colocação dos efluentes de esgotos no solo, apesar de ser uma prática comum em diversos países, como meio de proteger os cursos d’água e fornecer nutrientes aos agrossistemas, tem sido pouco estudada no Brasil. Objetivou-se neste trabalho avaliar, em condições controladas, os efeitos da aplicação de efluente do tratamento secundário de esgoto nas concentrações de nitrogênio (mineral e total), carbono total e no pH do solo. O efluente e o solo foram oriundos de Lins (SP). Foi empregado delineamento experimental inteiramente casualizado, em fatorial completo 4x11 (aplicação semanal de 0, 100, 150 e 200 mL de efluente por kg de solo; e onze períodos de incubação do solo – 0 a 10 semanas), com quatro repetições. O efluente foi aplicado no solo simulando-se a irrigação por superfície. Sete dias após a última irrigação foram determinadas as concentrações de nitrogênio mineral e, para o solo incubado por 10 semanas, também foi determinado o pH e os teores totais de carbono e nitrogênio. O incremento da dose de efluente aumentou as concentrações de nitrogênio (total e mineral – principalmente nitrato) e o pH do solo, mas o teor de carbono total não foi influenciado pelos tratamentos.
REFERENCES
Artiola, J. F. and Pepper, I. L. (1992), Longterm influence of liquid sewage sludge on the organic carbon and nitrogen content of a furrow-irrigated desert soil. Biol. Fert. Soils, 14, 30-36.
Bolan, N. S.; Hedley, M. J. and White, R. E. (1991), Processes of soil acidification during nitrogen cycling with emphasis on legume based pastures. Plant Soil,
134, 53-63.
Bond, W. J. (1998), Effluent irrigation – an environmental challenge for soil science. Aust. J. Soil Res., 36, 543-555.
Bouwer, H. (2000), Groundwater problems caused by irrigation with sewage effluent. J. Environ. Health,
63, 17-20.s
Bouwer, H. and Chaney, R. L. (1974), Land treatment of wastewater. Adv. Agron., 26, 133-176.
Bouwer, H. and Idelovitch, E. (1987), Quality requirements for irrigation with sewage water. J.
Irrig. Drain. Eng., 113, 516-535.
Cameron, K. C.; Di, H. J. and McLaren, R. G. (1997), Is soil an appropriate dumping ground for our wastes?
Aust. J. Soil Res., 35, 995-1035.
Companhia Estadual de Tecnologia de Saneamento Ambiental (1999), Aplicação de lodos de sistemas de tratamento biológico em áreas agrícolas – critérios
para projeto e operação: manual técnico. CETESB,
São Paulo.
Empresa Brasileira de Pesquisa Agropecuária (1997),
Manual de métodos de análise de solo, 2nd ed.
EMBRAPA-Solos, Rio de Janeiro.
Falkiner, R. A. and Smith, C. J. (1997), Changes in soil chemistry in effluent-irrigated Pinus radiata and
Eucalyptus grandis. Aust. J. Soil Res., 35, 131-147.
Feigin, A.; Ravina, I. and Shalhevet, J. (1991), Irrigation with treated sewage effluent: management
for environmental protection. Springer-Verlag,
Berlin.
Feigin, A.; Vaisman, I. and Bielorai, H. (1984), Drip irrigation of cotton with treated municipal effluents: II. Nutrient availability in soil. J. Environ. Qual., 13, 234-238.
Fonseca, A. F. (2001), Disponibilidade de nitrogênio, alterações nas características químicas do solo e do milho pela aplicação de efluente de esgoto tratado. Dissertação de Mestrado, Escola Superior de Agricultura Luiz de Queiroz, Universidade de São Paulo, Piracicaba.
Fonseca, A. F.;Melfi, A. J. and Montes, C. R. (2005a), Maize growth and changes in soil fertility after irrigation with treated sewage effluent. I. Plant dry matter yield and soil nitrogen and phosphorus availability. Commun. Soil Sci. Plant Anal.36, 1965-1981.
Fonseca, A. F.; Melfi, A. J. and Montes, C. R. (2005b), Maize growth and changes in soil fertility after irrigation with treated sewage effluent. II. Soil acidity, exchangeable cations, and sulfur, boron and heavy metals availability. Commun. Soil Sci. Plant
Friedel, J. K.; Langer, T.; Siebe, C. and Stahr, K. (2000), Effects of long-term waste water irrigation on soil organic matter, soil microbial biomass and its activities in central Mexico. Biol. Fert. Soils, 31, 414-421.
Hall, S. J. and Matson, P. A. (1999), Nitrogen oxide emissions after nitrogen additions in tropical forests.
Nature, 400, 152-155.
Hook, J. E. (1981), Movement of phosphorus and nitrogen in soil following application of municipal wastewater. In-Chemical mobility and reactivity in
soil systems, ed. D. W. Nelson; D. E. Elrick and K. K.
Tanji. Soil Science Society of America, Madison, pp. 241-255.
Kiehl, E. J. (1985), Fertilizantes orgânicos. Agronômica Ceres, São Paulo.
Mulvaney, R. L. (1996), Nitrogen – Inorganic forms.
In-Method of soil analysis: chemical methods. Part 3.
D. L. Sparks. Soil Science Society of America, Madison, pp. 1123-1184.
Myers, R. J. K.; Campbell, C. A. and Weier, K. L. (1982), Quantitative relationship between net nitrogen mineralization and moisture content of soils.
Can. J. Soil Sci., 62, 111-124.
Nelson, D. W. and Sommers, L. E. (1996), Total carbon, organic carbon and organic matter. In-Method
of soil analysis: chemical methods. Part 3. D. L.
Sparks. Soil Science Society of America, Madison, pp. 961-1010.
Pescod, M. B. (1992), Wastewater treatment and use in
agriculture. Food and Agriculture Organization,
Rome. (Irrigation and Drainage Paper, 47)
Polglase, P. J.; Tompkins, D.; Stewart, L. G. and Falkiner, R. A. (1995), Mineralization and leaching of nitrogen in an effluent-irrigated pine plantation.J.
Environ. Qual., 24, 911-920.
Quin, B. F. and Woods, P. H. (1978), Surface irrigation of pasture with treated sewage effluent. I. Nutrient status of soil and pastures. New Zeal. J. Agr. Res., 21, 419-426.
Raij, B. van; Andrade, J. C.; Cantarella, H. and Quaggio, J. A. (2001), Análise química para
avaliação da fertilidade de solos tropicais. Instituto
Agronômico, Campinas.
Ruzicka, J. and Hansen, E. H. (1975), Flow injection analyses: I. New concept of fast continuous-flow analysis. Anal. Chim. Acta, 78, 145-157.
SAS System, 1999. SAS Institute Inc. Release 8.02. The SAS Institute, Cary, NC.
Schipper, L. A.; Williamson, J. C.; Kettles, H. A. and Speir, T. W. (1996), Impact of land-applied tertiary-treated effluent on soil biochemical properties. J.
Environ. Qual., 25, 1073-1077.
Smith, C. J.; Freney, J. R. and Bond, W. J. (1996), Ammonia volatilization from soil irrigated with urban sewage effluent. Aust. J. Soil Res., 34, 789-802. Snow, V. O.; Smith, C. J.; Polglase, P. J. and Probert,
M. E. (1999), Nitrogen dynamics in a eucalypt plantation irrigated with sewage effluent or bore water. Aust. J. Soil Res., 37, 527-544.
Stanford, G. and Smith, S. J. (1972), Nitrogen mineralization potentials of soils. Soil Sci. Soc. Am.
Proc., 36, 465-472.
Stevenson, F. J. (1986), Cycles of soil: carbon,
nitrogen, phosphorus, sulfur, micronutrients. John
Wiley and Sons, New York.
Stewart, H. T. L.; Hopmans, P. and Flinn, D. W. (1990), Nutrient accumulation in trees and soil following irrigation with municipal effluent in Australia. Environ. Pollut., 63, 155-177.
Toze, S. (2006), Reuse of effluent water – benefits and risks. Agric. Water Manage.80, 147-159.
Yan, F.; Schubert, S. and Mengel, K. (1996), Soil pH increase due to biological descarboxilation of organic anions. Soil Biol. Biochem., 28, 617-624.