Printed version ISSN 0001-3765 / Online version ISSN 1678-2690 http://dx.doi.org/10.1590/0001-3765201720160630
www.scielo.br/aabc | www.fb.com/aabcjournal
Activity of Brazilian propolis against Aeromonas hydrophila
and its effect on Nile tilapia
growth, hematological and non-specific immune response under bacterial infection
RICARDO O. ORSI1
, VIVIAN G.DOS SANTOS2
, LUIZ E. PEZZATO2
, PEDRO L.P.F. DE CARVALHO2
, CAROLINE P.TEIXEIRA2
, JAKELINE M.A.FREITAS2
, CARLOS R. PADOVANI3, MARIA M.P.SARTORI4 and MARGARIDA M. BARROS2
1
Departamento de Produção Animal, Faculdade de Medicina Veterinária e Zootecnia/FMVZ, Grupo NECTAR, Rua Prof. Doutor Walter Mauricio Correa, s/n, Caixa Postal 560, Universidade
Estadual Paulista/UNESP, Campus de Botucatu, 18618-681 Botucatu, SP, Brazil 2
Departamento de Melhoramento e Nutrição Animal, Faculdade de Medicina Veterinária e Zootecnia/ FMVZ, Grupo AQUANUTRI, Rua Prof. Doutor Walter Mauricio Correa, s/n, Caixa Postal 560,
Universidade Estadual Paulista/UNESP, Campus de Botucatu, 18618-681 Botucatu, SP, Brazil 3
Departamento de Bioestatística, Instituto de Biociências de Botucatu, R. Prof. Dr. Antônio Celso Wagner Zanin, 250, Distrito de Rubião Junior, Universidade Estadual Paulista/UNESP, Campus de Botucatu, 18618-689 Botucatu, SP, Brazil 4
Departamento de Agricultura, Faculdade de Ciências Agronômicas/FCA, Rua Prof. Doutor Walter Mauricio Correa, s/n, Caixa Postal 560, Universidade Estadual Paulista/UNESP, Campus de Botucatu, 18618-681 Botucatu, SP, Brazil
Manuscript received on January 27, 2017; accepted for publication on March 21, 2017
ABSTRACT
The effect of the ethanolic extract of propolis (EEP) on Aeromonas hydrophila was analyzed by determination of minimum inhibitory concentration (MIC). Then, the effects of crude propolis powder (CPP) on growth, hemato-immune parameters of the Nile tilapia, as well as its effects on resistance to A. hydrophila challenge were investigated. The CPP (0.5, 1.0, 1.5, 2.0, 2.5 and 3.0%) was added to the diet of 280 Nile tilapia (50.0 ± 5.7 g fish-1
). Hemato-immune parameters were analyzed before and after the bacterial challenge. Red blood cell, hematocrit, hemoglobin, mean corpuscular volume (MCV), mean corpuscular hemoglobin concentration (MCHC), and hydrogen peroxide (H2O2) and nitric oxide (NO) were evaluated. The MIC of the EEP was 13% (v/v) with a bactericidal effect after 24 hours. Growth performance was significantly lower for those fish fed diets containing 2.5 and 3% of CPP compared to the control diet. Differences in CPP levels affected fish hemoglobin, neutrophils number and NO following the bacterial challenge. For others parameters no significant differences were observed. Our results show that although propolis has bactericidal properties in vitro, the addition of crude propolis powder to Nile tilapia extruded diets does not necessarily lead to an improvement of fish health.
Key words: health, hematology, immunology, Oreochromis niloticus, propolis, stress.
Correspondence to: Margarida Maria Barros E-mail: mbarros@fmvz.unesp.br
INTRODUCTION
The last decades have witnessed a steep growth
in the fish farming industry, particularly of those
systems involving intensive production. Because in these systems animals are frequently exposed to several stressors (e.g. transport, handling, high
densities and fluctuations of several environmental
Strengthening the fish immune system through strategic food supplementation has been considered the most promising method for disease control in intensive culture systems (Dügenci et al. 2003). Therefore, the effects of several
immunostimulant substances, such as β-glucan,
a polysaccharides found in the cell walls of filamentous fungi and mushrooms (Dalmo and Bogwald 2008, Barros et al. 2014); levamisole, a synthetic phenylimidazolthiazole antihelmintic agent (Hang et al. 2014) and components of the diet itself (minerals and vitamins) have been studied for many species (Sakai 1999). Among these, a natural
product showing positive effects on immunological
and hematological parameters is propolis (Abd-El-Rhman 2009, Segvic-Bubic et al. 2013), a resinous sticky substance produced by Apis mellifera L. bees, which has many different biological and pharmacological properties, such as antibacterial, a n t i v i r a l , a n t i o x i d a n t , a n t i - i n f l a m a t o r y, immunstimulant, among others (Mohammadzadeh et al. 2007, Sforcin 2007, Figueiredo et al. 2014, Kai et al. 2014, Souza et al. 2014, Conti et al. 2015, Bueno-Silva et al. 2016).
For instance, exposure of rainbow trout to different concentrations of propolis has been
associated with a favorable dose-dependent effect
on total leukocytes and granulocytes (Talas and Gulhan 2009). Previous research has also suggested that propolis is a potential growth promoter of Nile tilapia (Oreochromis niloticus), a species highly represented in fish farming industry (Meurer et al. 2009). Furthermore, the addition of ethanolic extract of propolis to tilapia diets has shown to promote growth, immunity, as well as resistance to Aeromonas hydrophila (Abd-El-Rhman 2009),
a gram negative opportunist bacterium that affects
a wide variety of freshwater fish species and causes tail and fin rot, hemorrhagic septicemia and epizootic ulcerative syndrome (Lu 1992). A recent study has shown that this bacteria is the most
common and important tilapia pathogen in Brazil (Sebastião et al. 2015).
However, propolis added to animal feed is often made through its ethanolic extract, which may lead to a reduction of some chemical compounds at
the filtration stage. Moreover, it is not possible to generalize the effects of propolis on performance
and immunity because its chemical composition may vary widely depending on the botanical origin. Although in general propolis includes 50% of resins and balsam, 30% wax, 10% essential and aromatic oils, 5% pollen and 5% of other substances, it contains a variety of chemical compounds
(polyphenols – e.g. flavonoid aglycones, phenolic
acids and their esters, phenolic aldehydes, alcohols and ketones, sesquiterpene quinones, coumarins, steroids, amino acids, and inorganic compounds according to Huang et al. (2014) that are associated
with different pharmacological properties.
In this study we evaluated in vitro the antibacterial activity from ethanolic extract of propolis (EEP) against Aeromonas hydrophila, a gram negative bacterium, since its activity has been more described for gram positive ones. Therefore, we also investigated crude propolis powder
antioxidant and immunostimulant potential effect
at different dietary concentrations on hemato-immunological parameters and resistance to bacterial challenge with A. hydrophila.
MATERIALS AND METHODS
This research comprises two studies. In study I the antibacterial activity of ethanolic extract of propolis (EEP) against A.hydrophila was analyzed in vitro.
In study II, fish received diets supplemented with
graded levels of crude propolis powder (CPP) for 30 days and growth performance was analyzed.
Propolis was elaborated by africanized Apis mellifera allocated in standardized hives Langsthrot model provides by Naturall Company (São Paulo, SP, Brazil). This crude propolis was ground and sieved to 60 mash to become powder. The ethanolic extract was obtained by the mixture of 30 g of crude propolis powder with 70% ethyl alcohol until complete 100 mL. This solution was protected from light, under constant agitation for
seven days, and then it was filtered to obtain the
ethanolic extract of propolis (Orsi et al. 2000). The Aeromonas hydrophila strain was obtained from a virulent outbreak of hemorrhagic septicemia in Nile tilapia. The bacteria was isolated and submitted to biochemical characterization according to Garcia et al. (2007) at the Fish Pathology Laboratory, CAUNESP, Unesp (Jaboticabal, SP, Brazil).
STUDY I
Sensitivity test and growth curve in vitro
Determination of the minimal inhibitory concentrations (MIC) by Brain Heart Infusion Broth (BHI, Sigma Chemicals, St. Louis, MO, USA) dilution method was performed according to the National Committee of Clinical Laboratory Standards Guidelines (NCCLS 1997). Serial concentrations of EEP were achieved (% v/v) in tubes with BHI, ranging from 1.0 % to 25.0 %. Each antimicrobial test also included tubes containing the culture medium plus ethanol, in order to obtain
a control of the solvent antimicrobial effect.
The bacterial strain was cultured in Brain Heart Infusion Agar (BHI, Sigma Chemicals, St. Louis, MO, USA) at 28 ºC for 24 h. The suspension was adjusted to 1.5 x 10⁸ CFU mL-1 in phosphate buffer saline using McFarland scale. Then, the bacteria was resuspended in 5 mL of sterile saline and
diluted to yield a final inoculum of approximately
1.0 x 10⁶ CFU mL-1.
Since EPP could modify the medium color, the tube contents were incubated in the Mueller Hinton
Agar plaques at 28 ºC for 24 h in order to confirm
the MIC whose endpoints were read as the lowest concentration of propolis that resulted in no visible growth.
The survival curve of A. hydrophila allowed the observation of the incubation period responsible for propolis antibacterial activity. Thus, 1.0 x 10⁶ CFU mL-1 were inoculated in BHI plus propolis in the corresponding MIC.
After 1.5, 3, 6, 9 and 24 h of incubation of 28 ºC, aliquots of culture were recovered and plated on Mueller Hinton Agar according to the Pour Plate method. Plate counts (CFU mL-1) were carried out after 24 h incubation and the survival percentage was calculated (Focht et al. 1993).
STUDY II
Growth performance
Experimental diets
A preliminary trial was conducted to determine the maximum level of dietary crude propolis powder (CPP) inclusion that would not impair feed acceptability. Then, seven practical diets were prepared with graded levels of CPP at 0 (control – 0 CPP), 0.5; 1.0; 1.5; 2.0, 2.5 and 3.0 mg kg-1 diet. These diets were formulated to contain 28.0% digestible protein and 12.98 MJ digestible energy kg-1 (Furuya 2010, NRC 2011). The CPP was supplemented at the expense of wheat meal. Diet formulation and proximate analysis were given in Table I.
The diets were extruded (4.0 mm pellet) approximately at 99°C in a single-screw laboratory extruder (20 kg h-1 of the feed, Extrutec®, Ribeirão Preto, SP, Brazil) then mechanically mixed with water (22% of dry weight) in a Kitchen Aid
multi-function mixer (Ação Científica®
TABLE I
Formulation and proximate chemical composition of the experimental diets. Ingredients (g kg-1
) CPP0 CPP0.5 CPP1 CPP1.5 CPP2 CPP2.5 CPP3
Soybean meal 528.0 528.0 528.0 528.0 528.0 528.0 528.0
Corn 334.0 334.0 334.0 334.0 334.0 334.0 334.0
Wheat meal 50.0 45.0 40.0 35.0 30.0 25.0 20.0
Poultry by product 50.0 50.0 50.0 50.0 50.0 50.0 50.0
Propolis1 0.0 5.0 10.0 15.0 20.0 25.0 30.0
Methionine 1.4 1.4 1.4 1.4 1.4 1.4 1.4
Treonine 0.4 0.4 0.4 0.4 0.4 0.4 0.4
Dicalcium phosphate 15.0 15.0 15.0 15.0 15.0 15.0 15.0
Vitamin C2 1.0 1.0 1.0 1.0 1.0 1.0 1.0
Salt 5.0 5.0 5.0 5.0 5.0 5.0 5.0
Premix3 15.0 15.0 15.0 15.0 15.0 15.0 15.0
BHT4 0.2 0.2 0.2 0.2 0.2 0.2 0.2
Proximate analyses (g kg-1)
Crude protein 306.3 307.6 306.8 306.1 305.3 304.6 303.9
Crude fiber 40.8 40.4 41.5 39.7 39.3 39.8 38.5
Ether extract 27.8 30.5 33.3 37.1 41.8 46.6 51.4
Calcium 7.5 7.2 7.1 7.1 7.2 7.0 7.2
Total phosphorus 7.9 7.6 7.8 7.8 8.0 8.1 7.9
Crude energy (kcal kg-1
) 3711 3692 3728 3745 3772 3799 3826
1flavonoids in quercetin at 0.4%; 6.5% phenolic compounds; antioxidant activity of 8.0 seconds; wax contents of 7.3%; moisture
content of 6.1% and the absence of tetracycline, chlortetracycline and oxytetracycline (lab); 2
Vitamin C Rovimix®
Stay-35®, DSM Nutritional Products, Switzerland; 3
Vitamin and Mineral Premix (kg of product): Vit. A = 1,200,000 UI; Vit. D3 = 200,000 UI; Vit. E = 12,000mg; Vit. K3 = 2,400 mg; Vit.B1= 4,800 mg; Vit. B2 = 4,800 mg; Vit. B6 = 4,000 mg; Vit. B12 = 4,800 mg; Folic acid = 1,200mg; calcium pantothenate = 12,000 mg; Vit. C = 48,000 mg; Biotine= 48 mg; Coline = 65,000 mg; Nicotinic acid = 24,000 mg; Mn= 4,000 mg; Zn= 6,000 mg; I = 20 mg; Co = 2 mg e Se = 20 mg;
4
Butylated hydroxytoluene – Antioxidant;
Fish and Feeding
A group of healthy Nile tilapia, with no prior history
of disease, were obtained from a commercial fish
farm (Piscicultura Fernandes, Palmital, SP, Brazil) and transferred to the AquaNutri Laboratory facilities (FMVZ, Unesp, Botucatu, SP, Brazil). The fish were stocked in 4 500-L aquaria and acclimatized for two weeks.
Then, two hundred and eighty Nile tilapia (50.0 ± 5.7 g) were randomly distributed in 35
250-L aquaria (eight fish/aquarium) supplied with 6 250-L
min-1 of dechlorinated tap water passed through a biological filter and a heater in a recirculated system. Water temperature (25.0 ± 2.0ºC), dissolved oxygen concentration (5.6 ± 0.15 mg L-1), pH level (6.8 ± 0.2) were monitored once a week with an YSI 556® multi-probe system (YSI Environmental, Yellow Spring, OH, USA), and ammonia concentration (0.12 ± 0.08 mg L-1) were determined using a commercial test kit (Alcon®, Camburiú, SC, Brazil). A 12:12-h light:dark photoperiod schedule was maintained. The aquaria were cleaned as required.
The seven experimental diets were fed to the
fish in quintuplicate aquaria four times daily until
apparent satiation for 30 days. Then, the weight
gain (WG) = final body weight (g) – initial body
weight (g); feeding intake (FI) = dry feed intake in the period (g) and feed conversion ratio = dry feed intake (g) / wet body weight (g) were evaluated.
Bacterial Challenge
In order to analyze the antibacterial property of
propolis, fish were experimentally infected with A. hydrophila after the feeding period. Such bacterial challenge was performed in another independent system. A. hydrophila from a virulent outbreak of hemorrhagic septicemia in Nile tilapia was grown in BHI at 28 °C for 18 h. The bacteria suspension was adjusted to 1.5 x 10⁸ CFU mL-1
in phosphate buffer saline using McFarland scale.
This concentration was obtained in a previous LD50
trial. In sum, three groups of 25 fish were infected
with A. hydrophila (104; 106 and 107 CFU mL-1), and mortality was recorded for 15 days. The LD50 was calculated according to Plumb and Bowser
(1983). Fifty-six fish were randomly stocked into
28 40-L aquaria and challenged by intraperitoneal
(IP) injection with 100 μL of A.hydrophila culture containing 1.0 × 10⁷ CFU mL-1 (LD
50).
Twenty-four hours after injection, fish were fed the same
experimental diet as in Study I during the challenge period. The mortality was recorded twice a day for 15 days. Before the challenge period, blood
samples were collected from six anaesthetized fish per treatment, each one from different aquaria, for
hemato-immunological parameters. At the end of
the challenge period other six fish were bled for the
analyses.
Hematological assay
Fish were anaesthetized with benzocaine (67 mg L-1), and blood was collected from the caudal vein using a tuberculin syringe, rinsed with anticoagulant (3% EDTA, Vetec, Quimica Fina Ltda, Duque Caxias, RJ, Brazil). Red blood cell (RBC) counts,
leukocyte (Leuk) counts, leukocyte differentiation,
hemoglobin (Hb), hematocrit (Ht), total plasma protein (TPP), mean corpuscular volume [MCV=(Ht x 10)/ erythrocytes], mean corpuscular hemoglobin concentration [MCHC=(Hb x 100/Ht], albumin concentration (ALB) and albumin:globulin ratio (A/G) [Globulin=TPP – ALB; A/G=ALB/ Globulin] were determined according to Barros et al. (2014).
Immunological assay
L-1) were bled from the caudal vein with a 1 mL
syringe. Leukocyte suspensions were layered over
34% and 51% Percoll density gradients. The cells were centrifuged at 220 g for 20 min at 10°C. After
centrifugation, the bands of leucocytes above the
34–51% interfaces were collected, washed twice
with L-15 medium (Leibovitz, Cultilab, PR, Brazil)
containing 2.0% fetal bovine serum (FBS, Cultilab,
PR, Brazil), resuspended, counted and adjusted to
2.0 × 10⁶ cells mL-1. One hundred microliters of the
cell suspension were added to 96-well microtiter
plates and incubated for 1 hour at 18°C in L-15
medium containing 0.1% fetal bovine serum (FBS).
Nonadherent cells were washed, and L-15 medium
with 2.0% FBS was added. After incubation for 18
h at 18°C, the supernatant was collected for nitric
oxide (NO) measurement. Hydrogen peroxide
(H2O2) was measured in the cell monolayer, with
the majority of the cells being monocytes. Phorbol
myristate acetate (PMA, Sigma Chemical) was
added as a positive control for the H2O2 assay in
some wells to determine monocyte monolayer
responsiveness.
The nitric oxide concentration in the supernatant
was measured by the Griess reaction (Green et al.
1981). Different concentrations of NaNO2 solution were used to prepare a standard curve. Readings
were measured by a multiscan spectrophotometer
(MTX Lab Systems, Virginia, USA) at 540 nm,
and values were expressed as µmol 10 -5 cells.
The hydrogen peroxide concentration in cells was
measured by the phenol red oxidation method
(Pick and Mizel 1981). Different concentrations of
H2O2 solution were used to prepare the standard
curve. Readings were measured with a multiscan
spectrophotometer (MTX Lab Systems, Virginia,
USA) at 620 nm, and values were expressed as
nmol 10 -5 cells.
STASTISTICAL ANALYSIS
Growth performance data were analyzed by one-way
analysis of variance complemented by polynomial
regression analysis. When the hematological
and immunological variables showed normal
probability distribution, analysis of variance for
repeated measure models in independent groups
and complemented with Bonferroni test for
qualitative groups were used (Johnson and Wichern
2002). Nonparametric analysis complemented
with Dunn multiple comparisons was used for no
normality (Zar 2009). All data were performed
using SIGMASTAT statistical software program at
the 0.05 probability level.
ETHICS STATEMENT
All experimental procedures were approved by
the Animal Ethics Committee of the Veterinary
and Animal Science College, São Paulo State
University (protocol 18/2010-CEUA).
RESULTS
SENSITIVITY TEST AND GROWTH CURVE IN VITRO
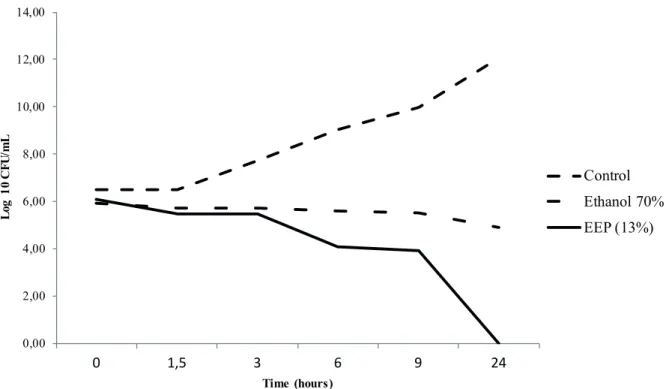
The sensitivity analysis showed that the minimum
inhibitory concentration for the ethanolic extract
of propolis (EEP) was 13% (v/v), corresponding to
17.3 mg ml-1 of propolis compounds in the medium,
while the minimum inhibitory concentration
determined for alcohol (70 %) was 21% (v/v). There
was a marked reduction in colony forming units
(CFU mL-1) count of A. hydrophila in those bacteria
incubated with EEP as compared to the control and
ethanol (70%) media, with a bactericidal effect of
EEP after 24 hours of incubation. In the case of
ethanol, there was only a reduction in CFU mL-1
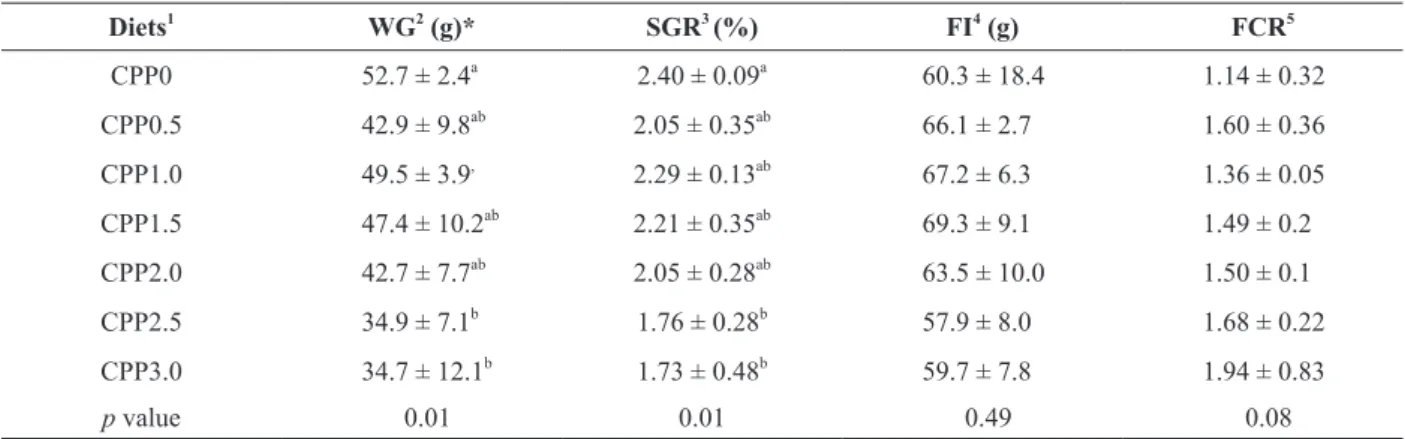
EFFECT OF CRUDE PROPOLIS POWDER ON GROWTH PERFORMANCE
After 30 days of feeding, fish weight gain was influenced by the addition of CPP. Specifically,
growth performance was significantly lower (p <
0.05) for those fish fed diets containing 2.5 and 3%
of propolis than for control (Table II). There were,
however, no significant differences in either feed
intake or feeding conversion among treatments.
EFFECT OF CRUDE PROPOLIS POWDER ON HEMATO-IMMUNE PARAMETERS AND RESISTANCE TO A. HYDROPHILA CHALLENGE
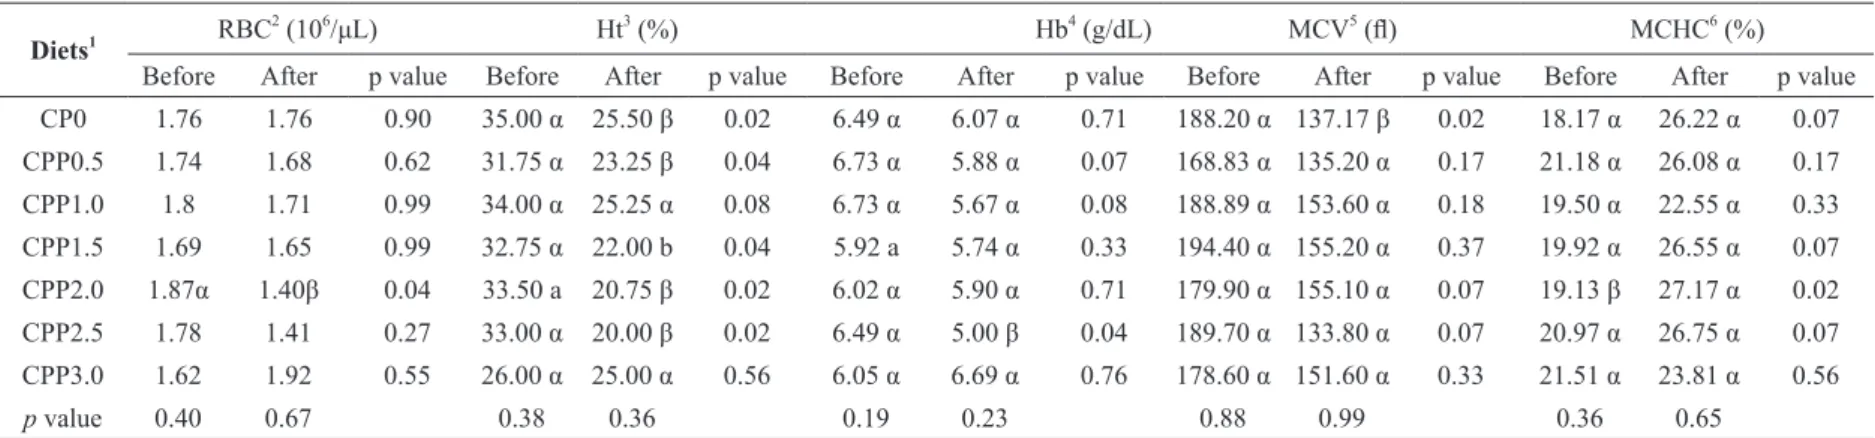
Comparing hematological profile before and after
the challenge with A. hydrophila we observed a decrease on RBC for the group of fish fed 2% of CPP, a decrease on hematocrit, except for the group fed diets containing 1 and 3% of CPP, and no change on hemoglobin, but for those fed diets
including 2.5%. VCM did not change for fish fed
diets containing 0.5 to 3% propolis, but decreased for those fed CPP0. Corpuscular hemoglobin concentration increased for those fed diets containing 2% of CPP (Table III).
Fish fed diets containing 1.5; 2 and 2.5% of
CPP showed a significant reduction in neutrophils
number following the bacterial challenge. There
were no differences in total leukocytes numbers
and in lymphocytes, monocytes and thrombocytes numbers either before or after the challenge (Table IV). The supplementation of 1.5% of CPP determined a decrease on A:G, but an increase for
those group of fish fed 2 and 3% of CPP. There were no effects on total plasma protein, albumin
and globulin (Table V).
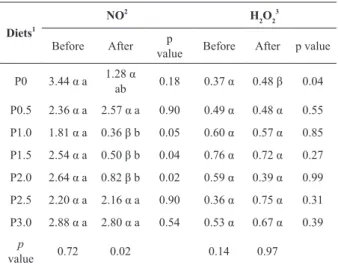
Nitrogen reactive intermediates (NO) were
influenced by the level of dietary CPP following the challenge, with a significant decrease in NO for fish fed diets containing 1; 1.5 and 2% of CPP
comparing with those fed 0.5; 2.5 and 3%. Levels Figure 1 - Susceptibility profile (Log10 UFC/mL) of A. hydrophila as to incubation period in media culture, ethanolic extract of propolis (MIC = 13%) and ethanol 70% (MIC = 21%).
0,00 2,00 4,00 6,00 8,00 10,00 12,00 14,00
0 1,5 3 6 9 24
L
o
g
1
0
C
F
U
/m
L
Time (hours)
Control
Ethanol 70%
of CPP did not influence H2O2 neither before nor
after infection. The bacterial challenge significantly decreased NO for fish fed diets containing 1; 1.5
and 2% of CPP, and increased H2O2 for those
groups of fish fed control diet (Table VI).
There was no effect (p > 0.05) of dietary CPP on survival rate after the bacterial challenge.
DISCUSSION
In this study we investigated the effect of crude
propolis powder at different concentrations on several performance, hemato-immunological parameters of Nile tilapia, as well as its putative
bactericidal effect. Our results show that although
propolis has bactericidal properties in vitro, the addition of CPP to Nile tilapia extruded diets does not necessarily translate into an improvement of
fish health.
The ethanolic extract of propolis had a
bactericidal effect in vitro against A. hydrophila, which was not observed with the use of ethanol
70% only. It confirms the recognized antibacterial
property of propolis, which may vary according to
the plant source available for bees which in turn
will affect propolis, hence with differences in the
chemical composition (Bosio et al. 2000, Simões et al. 2008, Tukmechi et al. 2010). Inhibition of proteic synthesis, enzymatic activity or even bacterial motility, preventing locomotion to places with higher nutrient availability, have all been proposed as potential mechanisms underlying the
observed bactericidal effect of propolis (Koo et al.
2002, Simões et al. 2008, Orsi et al. 2012).
The addition of crude propolis powder to the fish diet, however, was not associated with
beneficial effects on performance. On the contrary,
fish growth was inversely related to propolis concentration. Studies have shown that the uptake of phenolic compounds presents in the propolis
can have negative effects on fish performance, on
immunological and, hematological system thus,
jeopardizing fish health (El-Serafy et al. 2009, Zaki
et al. 2011).
Indeed, Meurer et al. (2009) also observed weight gain reduction and feed conversion ratio worsening in tilapias fed higher levels of propolis TABLE II
Growth performance of Nile tilapia fed graded levels of dietary crude propolis powder.
Diets1 WG2
(g)* SGR3
(%) FI4
(g) FCR5
CPP0 52.7 ± 2.4a
2.40 ± 0.09a
60.3 ± 18.4 1.14 ± 0.32
CPP0.5 42.9 ± 9.8ab 2.05 ± 0.35ab 66.1 ± 2.7 1.60 ± 0.36
CPP1.0 49.5 ± 3.9,
2.29 ± 0.13ab
67.2 ± 6.3 1.36 ± 0.05 CPP1.5 47.4 ± 10.2ab
2.21 ± 0.35ab
69.3 ± 9.1 1.49 ± 0.2
CPP2.0 42.7 ± 7.7ab
2.05 ± 0.28ab
63.5 ± 10.0 1.50 ± 0.1
CPP2.5 34.9 ± 7.1b
1.76 ± 0.28b
57.9 ± 8.0 1.68 ± 0.22
CPP3.0 34.7 ± 12.1b
1.73 ± 0.48b
59.7 ± 7.8 1.94 ± 0.83
p value 0.01 0.01 0.49 0.08
Values are means ± SD from five repetition groups, where the means in each column with different superscripts are significantly different (p < 0.05) (Tukey test).
*Regression equation: WG = 414.34 – 43.87 (CPP); 1
Seven experimental diets were formulated to contain graded levels of propolis: 0 (CPP0), 0.5 (CPP0.5), 1.0 (CPP1.0), 1.5 (CPP1.5), 2.0 (CPP2.0), 2.5 (CPP2.5) and 3.0 (CPP3.0) % propolis;
An
Acad Bras Cienc
(2017)
89
BACTERICIDAL
EFFECTS
OF
PROPOLIS
ON
NILE
TILAPIA
1793
Hematological parameters of Nile tilapia fed graded levels of dietary crude propolis powder and challenged with A. hydrophila.
Diets1 RBC
2
(106/μL) Ht3 (%) Hb4 (g/dL) MCV5 (fl) MCHC6 (%)
Before After p value Before After p value Before After p value Before After p value Before After p value
CP0 1.76 1.76 0.90 35.00 α 25.50 β 0.02 6.49 α 6.07 α 0.71 188.20 α 137.17 β 0.02 18.17 α 26.22 α 0.07
CPP0.5 1.74 1.68 0.62 31.75 α 23.25 β 0.04 6.73 α 5.88 α 0.07 168.83 α 135.20 α 0.17 21.18 α 26.08 α 0.17
CPP1.0 1.8 1.71 0.99 34.00 α 25.25 α 0.08 6.73 α 5.67 α 0.08 188.89 α 153.60 α 0.18 19.50 α 22.55 α 0.33
CPP1.5 1.69 1.65 0.99 32.75 α 22.00 b 0.04 5.92 a 5.74 α 0.33 194.40 α 155.20 α 0.37 19.92 α 26.55 α 0.07
CPP2.0 1.87α 1.40β 0.04 33.50 a 20.75 β 0.02 6.02 α 5.90 α 0.71 179.90 α 155.10 α 0.07 19.13 β 27.17 α 0.02
CPP2.5 1.78 1.41 0.27 33.00 α 20.00 β 0.02 6.49 α 5.00 β 0.04 189.70 α 133.80 α 0.07 20.97 α 26.75 α 0.07
CPP3.0 1.62 1.92 0.55 26.00 α 25.00 α 0.56 6.05 α 6.69 α 0.76 178.60 α 151.60 α 0.33 21.51 α 23.81 α 0.56
p value 0.40 0.67 0.38 0.36 0.19 0.23 0.88 0.99 0.36 0.65
Medians in each column with different superscripts are significantly different (p < 0.05) (Dunn’s test); different greek letters in a row indicate significant differences (p < 0.05) (Mann Whitney test).
1
Seven experimental diets were formulated to contain graded levels of propolis: 0 (CPP0), 0.5 (CPP0.5), 1.0 (CPP1.0), 1.5 (CPP1.5), 2.0 (CPP2.0), 2.5 (CPP2.5) and 3.0 (CPP3.0) % propolis;
2
RBC: red blood cell; 3 Ht: hematocrit; 4 Hb: hemoglobin; 5 MCV: mean corpuscular volume; 6 MCH: mean corpuscular hemoglobin concentration.
TABLE IV
Leukocyte differential count of Nile tilapia fed graded levels of dietary crude propolis powder, before and after challenge with A. hydrophila
Diets¹ Leucocytes (10 3
µL-1) Lymphocytes (103µL-1) Neutrophil (103µL-1) Monocyte (103µL-1) Trombocyte (103µL-1)
Before After p value Before After p value Before After p value Before After p value Before After p value
CP0 30.5 22.4 0.08 25.9 20.3 0.25 2.7a 1.4a 0.07 0.8 1.6 0.21 13.8 6.7 0.06
CPP0.5 34.0 24.6 0.07 28.9 21.2 0.08 2.4a 1.0a 0.12 2.4 1.3 0.71 15.5 31.4 0.08
CPP1.0 31.3 26.9 0.15 29.4 24.0 0.09 2.2a 1.7a 0.08 1.9 1.2 0.62 14.3 15.7 0.65
CPP1.5 35.9 23.1 0.07 27.9 21.4 0.12 3.7a 0.4b 0.01 2.5 1.0 0.45 14.9 32.7 0.07
CPP2.0 39.3 17.6 0.06 35.3 15.7 0.06 2.8a 0.7b 0.01 1.5 2.0 0.38 13.0 12.2 0.56
CPP2.5 40.8 21.3 0.06 30.1 17.7 0.06 2.2a 0.7b 0.01 1.5 0.8 0.23 15.1 10.3 0.15
CPP3.0 24.7 25.4 0.56 22.3 23.0 0.58 1.3a 0.9a 0.17 1.5 1.5 0.74 15.9 37.6 0.08
p value 0.09 0.13 0.51 0.47 0.62 0.19 0.12 0.09 0.72 0.07
Acad Bras Cienc
(2017)
89
(3)
RICARDO O. ORSI
et al.
TABLE V
Total plasmatic protein, albumin, globulin and albumin:globulin ratio of Nile tilapia fed graded levels of dietary crude propolis powder, before and after challenge
with A. hydrophila.
Diets1
TPP2 (g dL-1
) Albumin (g dL-1
) Globulin (g dL-1
) A:G3
Before After p value Before After p value Before After p value Before After p value
P0 2.75 2.82 0.90 0.36 0.66 0.23 2.30 1.94 0.23 0.16 α 0.34 α 0.13
P0.5 2.75 2.80 0.81 0.61 0.82 0.27 1.98 1.83 0.39 0.28 α 0.44 α 0.71
P1.0 2.78 3.10 0.12 0.52 1.06 0.08 2.22 1.94 0.33 0.25 α 0.55 α 0.33
P1.5 2.55 2.71 0.99 0.67 0.56 0.38 1.88 2.24 0.38 0.35 α 0.23 β 0.05
P2.0 2.55 2.55 0.99 0.53 0.72 0.06 1.97 1.65 0.31 0.26 β 0.43 α 0.03
P2.5 2.55 2.35 0.46 0.63 0.69 0.54 2.01 1.66 0.18 0.31 α 0.38 α 0.27
P3.0 2.50 3.10 0.55 0.55 0.73 0.07 2.03 2.37 0.55 0.26 β 0.31 α 0.04
p value 0.68 0.23 0.58 0.76 0.63 0.48 0.55 0.47
Medians in each column with different superscripts are significantly different (p < 0.05) (Dunn’s test); different greek letters in a row indicate significant differences (p< 0.05) (Mann Whitney test).
1
Seven experimental diets were formulated to contain graded levels of propolis: 0 (CPP0), 0.5 (CPP0.5), 1.0 (CPP1.0), 1.5 (CPP1.5), 2.0 (CPP2.0), 2.5 (CPP2.5) and 3.0 (CPP3.0) % propolis.
2
TPP: Total plasmatic protein; 3
(3.65 g brown propolis extract kg-1 diet). However, the observation of lower weight gain with higher levels of CPP could be related to the presence of wax in its composition, which could hinder the action of digestive enzymes due to its hydrophobic characteristics, as observed in chickens (Santos et al. 2003). Nerveless, for ethanolic propolis extract, earlier studies have shown that the antimicrobial and/or antioxidant activities could result in better intestinal health, thus improving digestion and absorption, consequently growth performance in quail (Denli et al. 2005) and hens (Seven 2008).
Unlike our results, an increase on growth performance for Nile tilapia fed 10 g kg-1 diet of ethanolic propolis extract or crude propolis was determined by Abd-El-Rhman (2009), and also an
increase of growth with better feed efficiency by
TABLE VI
Reactive nitrogen and oxygen intermediates of Nile tilapia fed graded levels of dietary crude propolis powder, before
and after challenge with A. hydrophila.
Diets1
NO2
H2O2 3
Before After p
value Before After p value P0 3.44 α a 1.28 α
ab 0.18 0.37 α 0.48 β 0.04 P0.5 2.36 α a 2.57 α a 0.90 0.49 α 0.48 α 0.55 P1.0 1.81 α a 0.36 β b 0.05 0.60 α 0.57 α 0.85 P1.5 2.54 α a 0.50 β b 0.04 0.76 α 0.72 α 0.27 P2.0 2.64 α a 0.82 β b 0.02 0.59 α 0.39 α 0.99 P2.5 2.20 α a 2.16 α a 0.90 0.36 α 0.75 α 0.31 P3.0 2.88 α a 2.80 α a 0.54 0.53 α 0.67 α 0.39
p
value 0.72 0.02 0.14 0.97
Medians in each column with different superscripts are significantly different (p < 0.05) (Dunn’s test); different greek
letters in a row indicate significant differences (p < 0.05) (Mann Whitney test).
1
Seven experimental diets were formulated to contain graded levels of propolis: 0 (CPP0), 0.5 (CPP0.5), 1.0 (CPP1.0), 1.5 (CPP1.5), 2.0 (CPP2.0), 2.5 (CPP2.5) and 3.0 (CPP3.0) % propolis;
2
NO: Nitric oxide; 3
H2O2: Oxygen peroxide.
Bae et al. (2012) for eel with the supplementation of 0.25-0.5% of crude propolis. These contradictory results suggest that further studies should consider
different propolis processing and composition.
Throughout the feeding trial there was no mortality. However, during the bacterial challenge, a mortality rate of 12.5% was observed on treatments CPP1.0, CPP1.5 and CPP3.0. Since there was no trend related to the dietary propolis supplementation, mortality could be related to the aggression-associated interactions.
Although propolis had a bactericidal effect in
vitro against A. hydrophila, our results showed that
fish resistance to this bacterium was not affected by
the addition of CPP to the diets. In those treatments involving CPP supplementation at levels from 0.5 to 2.5%, there was reduction on hematocrit, hemoglobin and mean corpuscular volume after the bacterial challenge, an effect that could be attributed to bleeding disorders caused by this pathogen (Hrubec and Smith 2010). Although
non-statistically significant, fish fed diets supplemented
with 3% CPP showed a trend of maintaining
hematological profile, which could suggest possible beneficial effects of this substance in similar levels.
Fish hematological profile is determined as a
useful index of health condition (Ranzani-Paiva and Silva-Souza 2004). Although, in this study,
there was no influence of nutrition on hematological profile, regardless of CPP supplementation, there
was an influence of bacterial infection, where the parameters were below the normal range for healthy Nile tilapia after bacterial challenge (Weiss and Wardrop 2010; Barros et al. 2013). These results showed that, although propolis has antioxidant and immunomodutalory properties,
which could maintain or even improve fish health
under bacterial infection, it was not observed for
CPP, different from EEP, as presented above. This
some characteristics, especially because of high temperature. Most of the studies that have shown some positive results of EEP or even CPP have used pelletized diets. Therefore, further studies should address these concerns.
To our knowledge, very few studies have analyzed the fish health condition, especially comparing it, before and after stress. A positive
effect of EEP on rainbow trout hematological and
biochemical parameters was described by Talas and Gulhan (2009) for the concentration of 0.01 g L-1 diet, whereas the concentration of 0.02 and 0.03 g L-1 appears to be unfavorable for blood tissue determining a macrocitic anemia. For common carp Talas et al. (2012) also showed a protective effect of 10 mg L-1 propolis extract diet when exposed to arsenic, which improved biochemical and hematological functions. Propolis biological properties that could act on fish erytropoiesis
process are mostly attributed to flavonoids (Mani et al. 2006, Talas et al. 2012), with many effects including antioxidant, which may protect fish cells
under stress. The positive effect of flavonoids constituents was also described by El-Asely et al. (2014) that evaluated bee pollen supplementation
on Nile tilapia diet and showed positive effect on
growth performance, immune-hematological and biochemical parameters resulting in significant protection against A. hydrophyla.
The assessment of Nile tilapia immune responses showed a decrease in neutrophils production after the bacterial challenge for treatments with CPP varying between 1.5 and 2.5%. Neutrophils are important cells of natural immunity, with antimicrobial activity by phagocytosis mechanism and degranulation of mediators that can attack foreign particles (Branzk et al. 2014). Thus, an increase in serum neutrophils would be
important to maintain fish health, as demonstrated
in rainbow trout after infection with A. hydrophila (Afonso et al. 1998).
The CPP effect observed here may have impaired fish immunity, in spite of propolis immunomodulatory properties (Talas and Gulhan
2009, Dotta et al. 2014). Abd-El-Rhman (2009) showed that the EEP modified leukocyte count, thus reducing neutrophil in Nile tilapia. Similarly,
we observed a significant reduction in nitric oxide
production of fish fed 1; 1.5 and 2% of CPP, which could be critical for the host defense against intracellular pathogens (Neumann et al. 2001,
Barlack et al. 2015) however, these effects could
be related to propolis antioxidant activity (Castaldo
and Capasso, 2002), that affect the reactive nitrogen
intermediates (RNI) production. The same scenario was also observed for neutrophil, but these results seem not to be dietary CPP-related. On the other
hand, CPP supplementation allowed fish to maintain
reactive oxygen intermediates (ROI) production,
differently from fish fed the control diet, which
determine an increase on H2O2 production after bacterial infection. RNI and ROI are produced by immune cells (neutrophils and macrophages) and
are an important mechanism to fight pathogens (Neumann et al. 2001, Barlack et al. 2015).
Future researches could investigate different
propolis concentrations, sources of resins, ways of
inclusion, and also diet processing.In this study we opted to supplement Nile tilapia diets with crude propolis powder, since it is easy to be included,
reduces costs, and preserves complete chemical composition. However, the data presented here indicate that the use of crude propolis powder on
Nile tilapia extruded diet was not effective, probably
because the extrusion process may mitigate some desired characteristics of this compound. Our
results show that although propolis has bactericidal properties in vitro, the addition of crude propolis to Nile tilapia extruded diet does not necessarily lead
ACKNOWLEDGMENTS
The authors are grateful to the Conselho Nacional de
Desenvolvimento Científico e Tecnológico (CNPq)
(472389/2009-2) for the financial support. We also like to thank Dr Fabiana Pilarski, CAUNESP, Jaboticabal, São Paulo, Brazil for her assistance with the bacterial challenge.
REFERENCES
ABD-EL-RHMAN A. 2009. Antagonism of Aeromonas hydrophila by propolis and its effect on the performance of Nile tilapia, Oreochromis niloticus. Fish Shellfish Immunol 27: 454-459.
AFONSO A, LOUSADA S, SILVA J, ELLIS AE AND SILVA MT. 1998. Neutrophil and macrophage responses to inflammation in the peritoneal cavity of rainbow trout
Oncorhynchus mykiss. A light and electron microscopic cytochemical study. Dis Aquat Org 34: 27-37.
BAE JY, PARK GJ, LEE JY, OKORIE OE AND BAI SC. 2012. Effects of dietary propolis supplementation on growth performance, immune responses, disease resistance and body composition of juvenile eel, Anguilla japonica. Aquac Int20: 513-523.
BARLACK Y, DEGER O, UÇAR M AND ÇAKIROGLU TN. 2015. Effects of Turkish propolis extract on secretion of polymorphonuclear elastase following respiratory burst. Turkish J Biol 39: 1-8.
BARROS MM, FALCON DR, ORSI RO, PEZZATO LE, FERNANDES JR A, GUIMARÃES IG, FERNANDES JR A, PADOVANI CR AND SARTORI MMP. 2014. Non-specific immune parameters and physiological response of Nile tilapia fed β-glucan and vitamin C for different periods and submitted to stress and bacterial challenge. Fish Shellfish Immunol 39: 188-195.
BARROS MM, GUIMARÃES IG, PEZZATO LE, ORSI RO, FERNADES JR A TEIXEIRA CP, FLEURI LF AND PADOVANI CR. 2013. The effects of dietary nucleotide mixture on growth performance, haematological and immunological parameters of Nile tilapia. Aquac Res 44: 1-7.
BOSIO K, AVANZINI C, D’AVOLIO A, OZINO O AND SAVOIA D. 2000. In vitro activity of propolis against Streptococcus pyogenes. Lett App Microbiol 31: 174-177. BRANZK N, LUBOJEMSKA A, HARDISON SE,
WANG Q, GUTIERREZ MG, BROWN GD AND PAPAYANNOPOULOS V. 2014. Neutrophils sense microbe size and selectively release neutrophil extracellular traps in response to large pathogens. Nat Immunol 15: 1017-1027.
BUENO-SILVA B, MARSOLA A, IKEGAKI M, ALENCAR SM AND ROSALEN PL. 2016. The effect of seasons on Brazilian red propolis and its botanical source: chemical composition and antibacterial activity. Nat Prod Res 31: 1318-1324.
CASTALDO S AND CAPASSO F. 2002. Propolis, an old remedy used in modern medicine. Fitoterapia 73: 1-6. CONTI BJ, SANTIAGO KB, BÚFALO MC, HERRERA
YF, ALDAY E, VELAZQUEZ C, HERNANDEZ J AND SFORCIN JM. 2015. Modulatory effects of propolis samples from Latin America (Brazil, Cuba and Mexico) on cytokine production by human monocytes. J Pharm Pharmacol 65: 1431-1438.
DALMO RA AND BØGWALD J. 2008. Beta-glucans as conductors of immune symphonies. Fish Shellfish Immunol 25: 384-396.
DENLI M, ÇANKAYA S AND SILICI S. 2005. Effect of dietary addition of Turkish propolis on th growth performance, carcass characteristics and serum variables of quail (Coturnix coturnix japonica). Asian-Australas. J Anim Sci 18: 848-854.
DOTTA G, ANDRADE JIA, GONÇALVES ELT, BRUM A, MATTOS JJ, MARASCHIN M AND MARTINS ML. 2014. Leukocyte phagocytosis and lysozyme activity in Nile tilapia fed supplemented diet with natural extracts of propolis and Aloe barbadensis. Fish Shellfish Immunol 39: 280-284.
DÜGENCI SK, ARDA N AND CANDAN A. 2003. Some medicinal plants as immunostimulant for fish. J Ethnopharmacol 88: 99-106.
EL-ASELY AM, ABBASS AA AND AUSTIN B. 2014. Honey bee pollen improves growth, immunity and protection of Nile tilapia (Oreochromis niloticus) against infection with Aeromonas hydrophila. Fish Shellfish Immunol 40: 500-506.
EI-SERAFY SS, ABDEL-HAMEID NAH AND EI-DALY AA. 2009. Histological and histochemical alterations induced by phenol exposure in Oreochromis aureus
(Steindachner, 1864) juveniles, Egypt. J Aquatic Biol Fisheries 13: 151-172.
FIGUEIREDO SM, NOGUEIRA-MACHADO J, ALMEIDA BM, ABREU SRL, ABREU JAS, FILHO SAV, BINDA NS AND CALIGIORNE RB. 2014. Immunomodulatory Properties of Green Propolis. Recent Pat Endocr Metab Immune Drug Discov 8: 85-94.
FOCHT J, HANSEN SH, NIELSEN JV, BERGSEGERS A AND RIEZLER R. 1993. Bactericidal Effect of Propolis
in vitro against Agents Causing Upper Respiratory Tract Infections. Bioscientia 43: 921-923.
FURUYA WM. 2010. Tabelas brasileiras para a nutrição de tilápias, GFM, Toledo, p. 100.
mesopotamicus fed diets supplemented with vitamins C and E, challenged by Aeromonas hydrophila. Aquac 271: 39-46.
GREEN LC, LUGURIAGA VR, WAGUER DA, RAND W, ISTFAN N, YOUNG VR AND TANNENBAUM SR. 1981. Nitrate biosynthesis in man. Proc Natl Acad Sci USA 78: 7764-7768.
HANG BTB, PHUONG NT AND KESTEMONT P. 2014. Can immunostimulants efficiently replace antibiotic in striped catfish (Pangasianodon hypophthalmus) against bacterial infection by Edwardsiella ictaluri. Fish Shellfish Immunol 40: 556-562.
HUANG S, ZHANG CP, WANG K, LI GQ AND HU FL. 2014. Recent advances in chemical composition of propolis. Molecules 19: 19610-19632.
HRUBEC TC AND SMITH SA. 2010. Hematology of fishes. In: Weiss DJ and Wardrop KJ (Eds), Schalm’s Veterinary Hematology, p. 994-1003.
JOHNSON RA AND WICHERN DW. 2002. Applied multivariate statistical analyses. Prentice-Hall, New Jersey, p. 797.
KAI H, OBUCHI M, YOSHIDA H, WATANABE W, TSUTSUMI S, PARK YK, MATSUNO K, YASUKAWA K AND KUROKAWA M. 2014. In vitro and in vivo
anti-influenza virus activities of flavonoids and related compounds as components of Brazilian propolis (AF-08). J Funct Foods 8: 214-223.
KOO H, ROSALEN PL, CURY JA, PARK YK AND BOWEN WH. 2002. Effects of compounds found in propolis on
Streptococcus mutans growth and on glucosyltransferase activity. Antimicrob. Agents Chemother 46: 1302-1309. LU CP. 1992. Pathogenic Aeromonas hydrophila and the fish
diseases caused by it. J Fish China 16: 282-288.
MANI F, DAMASCENO HCR, NOVELLI ELB, MARTINS EA AND SFORCIN JM. 2006. Propolis: Effect of different concentrations, extracts and intake period on seric biochemical variables. J Ethnopharmacol105: 95-98. MEURER F, COSTA MM, BARROS DAD, OLIVEIRA STL
AND PAIXÃO PS. 2009. Brown propolis extract in feed as a growth promoter of Nile tilapia (Oreochromis niloticus, Linnaeus 1758) fingerlings. Aquac Res 40: 603-608. MOHAMMADZADEH S, SHARRIATPANAHI M, HAMEDI
M, AMANZADEH Y, EBRAHIMI SES AND OSTAD SN. 2007. Antioxidant power of Iranian propolis extract. Food Chem 103: 729-733.
NCCLS - NATIONAL COMMITTEE FOR CLINICAL LABORATORY STANDARDS. 1997. Performance standards for antimicrobial disk susceptibility tests. Approved standard M2-A6. Wayne, PA: National Committee for Clinical Laboratory Standards.
NEUMANN NF, STAFFORD JL, BARREDA D,
AINSWORTH AJ AND BELOSEVIC M. 2001.
Antimicrobial mechanisms of fish phagocytes and their role in host defense. Dev Comp Immunol 25: 807-825. NRC - NATIONAL RESEARCH COUNCIL. 2011. Nutrient
Requirements of Fish and Shrimp. National Academic Press, Washington, DC.
ORSI RO, FERNANDES A, BANKOVA V AND SFORCIN JM. 2012. The effects of Brazilian and Bulgarian propolis in vitro against Salmonella Typhi and their synergism with antibiotics acting on the ribosome. Nat ProdRes 26: 430-437.
ORSI RO, FUNARI SRC, SOARES AMVC, CALVI SA, OLIVEIRA SL, SFORCIN JM AND BANKOVA V. 2000. Immunomodulatory action of propolis on macrophge activation. J Venom Anim Toxins incl Trop Dis6: 205-219. PICK E AND MIZEL D. 1981. Rapid microassays for the
measurement of superoxide and hydrogen peroxide production by macrophage in culture using an automatic enzyme immunoassay reader. J Immunol Methods 46: 211-216. PLUMB JA AND BOWSER PR. 1983. Microbial fish
disease laboratory manual, Alabama: Auburn University, Alabama Agriculture Experiment Station, p. 95.
RANZANI-PAIVA MJ AND SILVA-SOUZA AT. 2004. Hematologia de Peixes Brasileiros. In: Ranzani-Paiva MJ, Takemoto RM and Lizama MAP (Eds), Sanidade de Organismos Aquáticos, Varela Publishing, São Paulo, p. 89-120.
SAKAI M. 1999. Current research status of fish immunostimulants. Aquac172: 63-92.
SANTOS AV, TEIXEIRA AS, RODRIGUES PB, FREITAS RTF, GUIMARÃES AM AND GIACOMETTI RA. 2003. Valor nutritivo do resíduo de própolis para frangos de corte. Cienc Agrotec 27: 1152-1159.
SEBASTIÃO FA, FURLAN LR, HASHIMOTO DT AND PILARSKI F. 2015. Identification of bacterial fish pathogens in Brazil by direct colony PCR and 16S rRNA gene sequencing. Adv Microbiol 5: 409-424.
SECOMBES CJ. 1990. Isolation of salmonid macrophages and analysis of their killing activity. In: Stolen J, Fletcher TC, Anderson DP, Roberson BS and Van Muiswinkel WB (Eds), Techniques in Fish Immunology, SOS Publications, Fair Haven Connecticut, p. 137-154.
SEGVIC-BUBIC T, BOBAN J, GRUBISIC L, TRUMBIC Z, RADMAN M, PERCIC M AND COZ-RAKOVAC R. 2013. Effects of propolis enriched diet on growth performance and plasma biochemical parameters of juvenile European sea bass (Dicentrarchus labrax L.) under acute low-temperature stress. Aquac Nutr 19: 877-885.
SEVEN PT. 2008. The effect of dietary Turkish propolis and vitamin C on performance, digestibility, egg production and egg quality in laying hens under different environmental temperatures. Asian-Australas. J Anim Sci 8: 1164-1170. SFORCIN M. 2007. Propolis and the immune system: a
SIMÕES CC, ARAÚJO DB AND ARAÚJO RPC. 2008. Estudo
in vitro e ex vivo da ação de diferentes concentrações de extratos de própolis frente aos microrganismos presentes na saliva de humanos. Rev Bras Farmacogn 18: 84-89. SOUZA EA, INOU HT, FERNANDES-JÚNIOR A, VEIGA N
AND ORSI RO. 2014. Influência da sazonalidade e método de produção na atividade antibacteriana da própolis. Acta Sci Anim Sci 36: 49-53.
TALAS ZS AND GULHAN MF. 2009. Effects of various propolis concentrations on biochemical and hematological parameters of rainbow trout (Oncorhynchus mykiss). Ecotoxicol Environ Saf 72: 1994-1998.
TALAS SZ, DUNDAR PS, GULHAN FM, ORUN I AND KAKOOLAKI S. 2012. Effect of propolis on some blood
parameters and enzymes in carp exposed to arsenic. Iranian J Fish Sci 11: 405-414.
TUKMECHI A, OWNAGH A AND MOHEBBAT A. 2010.
In vitro antibacterial activities of ethanol extract of iranian propolis (EEIP) against fish pathogenic bacteria (Aeromonas hydrophila, Yersinia ruckeri & Streptococcus iniae). Braz J Microbiol 41: 1086-1092.
WEISS DJ AND WARDROP KJ 2010. Schalm’s Veterinary Hematology, Blackwell Publishing, Ames, p. 1232. ZAKI MS, FAWZI OM AND SHALABY SI 2011. Phenol
toxicity affecting hematological changes in catfish (Clarius lazera). Life Sci J 8: 244-248.