*Correspondence: M. Ikegaki. Faculdade de Ciências Farmacêuticas, Uni-versidade Federal de Alfenas. Rua Gabriel Monteiro da Silva, 700. Centro - 37130-000 - Alfenas – MG, Brasil. E-mail: [email protected]
A
vol. 48, n. 3, jul./sep., 2012
The correlation between the phenolic composition and biological
activities of two varieties of Brazilian propolis (G6 and G12)
Ingridy Simone Ribeiro Cabral
1, Tatiane Luiza Cadorin Oldoni
2, Severino Matias de Alencar
3,
Pedro Luiz Rosalen
4, Masaharu Ikegaki
5,*1Center of Nuclear Energy in Agriculture, University of São Paulo, 2Department of Chemistry, Federal Technological
University of Paraná, 3Department of Agri-Food Industry, Food and Nutrition, “Luiz de Queiroz” College of Agriculture,
University of São Paulo, 4Department of Physiological Sciences, Piracicaba Dental School, University of Campinas, 5Faculty
of Pharmaceutical Sciences, Federal University of Alfenas
Biological assays that have been performed on different types of Brazilian propolis have shown that type 6 propolis (G6) has a strong antimicrobial activity and a low lavonoid content. This study aimed to evaluate the correlation between the phenolic composition and the biological activities displayed by propolis G6 from the state of Bahia and green propolis, also known as type 12 (G12). The values of the lavonoids and the total phenolics in propolis G6 were different than those in propolis G12. Although the G12 variety presented greater antioxidant activity, propolis G6 proved to have greater antimicrobial and cytotoxic activities. The results showed that the phenolic compounds may not be the only compounds responsible for the biological activity. More detailed studies of the chemical composition and an assessment of the biological activity are required to establish the quality of propolis.
Uniterms: Brazilian própolis/evaluation. Flavonoids/determination in propolis. Phenolic compounds/ determination in propolis. Propolis/quality control.
Ensaios biológicos realizados com diferentes tipos de própolis brasileira têm mostrado que a própolis do tipo 6 (G6) tem forte atividade antimicrobiana e menor teor de lavonóides. Este trabalho teve como objetivo avaliar a correlação entre a composição fenólica e atividades biológicas apresentadas pela própolis G6, do Estado da Bahia, e a própolis verde, do tipo 12 (G12). Os teores de lavonóides e fenólicos totais na própolis G6 foram diferentes dos teores da própolis G12. Apesar da G12 apresentar maior atividade antioxidante, a própolis G6 apresenta maior atividade antimicrobiana e citotóxica. Os resultados mostraram que os compostos fenólicos não são os únicos compostos responsáveis pela atividade biológica da própolis. Estudos mais especíicos da composição química, em adição à avaliação das atividades biológicas, são requeridos para determinar a qualidade da própolis.
Unitermos: Própolis brasileira/avaliação. Flanovóides/determinação no própolis. Compostos fenólicos/ determinação no própolis. Própolis/controle de qualidade.
INTRODUCTION
Propolis is a resinous substance with a complex chemical composition that is collected from various spe-cies of plants by Apis mellifera bees, which results in a material of different colors and consistencies (Guisalberti,
1979; Burdock, 1998; Castaldo, Capasso, 2002; Alencar
etal., 2007).
Propolis has been used in folk medicine for centuries. Pharmacological properties such as antimicrobial, antioxi-dant (Oldoni et al., 2011; Cabral et al., 2009;Alencar et al.,
2007), anticarcinogenic (Duarte et al., 2006; Castro et al.,
2007; Castro et al., 2009) and anti-inlammatory (Park et al., 1998) activities have been described for propolis.
Because propolis is widely used, it has become
among the criteria used to evaluate the quality of propolis extracts intended for national and international trade.
These criteria are described in the Regulation of Identity
and Quality of Propolis that was proposed by the Agricul-ture Ministry (Instruction Number 3; January 19, 2001). In crude propolis, the minimum required content of phenolic
compounds is 5% (w/w), and the minimum for lavonoids is 0.5% (w/w) (Brazil, 2001). The absorption spectrum in
the ultraviolet and visible region is also evaluated and must have the “characteristic peaks” between 200 and 400 nm
of the major classes of lavonoids.
Different varieties of Brazilian propolis were
classi-ied into 12 types according to the chemical proile and the evaluation of antimicrobial and antioxidant activities. The
propolis types that showed increased biological activities were types 3 (from Rio Grande do Sul), 6 (from Bahia) and 12 (from Minas Gerais) (Park et al., 2000). Propolis type 12, known as green propolis, is the most popular type sold in the Japanese market, and the composition of
type 12 includes lavonoids and cinnamic acid derivatives
(Park et al., 2002). However, other authors found that
Ba-hia propolis, classiied as type 6, has a distinct chemical composition with a low content of lavonoids and a greater
amount of apolar compounds such as fatty acids and pre-nylated benzophenone (Duarte et al., 2006; Castro et al., 2007; Castro et al., 2009). Additionally, type 6 propolis shows a high level of antimicrobial activity (Castro et al.,
2007). Therefore, this study aimed to verify whether there
is positive correlation between the identity and quality criteria for propolis and the biological activities exhibited by the extracts of propolis.
MATERIAL AND METHODS
Propolis samples
Crude samples of bee (Apis mellifera) propolis were
obtained in Jan – Feb, 2008. Type 6 was obtained from
the Atlantic forest in the state of Bahia, which is located in the northeastern region of Brazil (SL11º56’31” and WL38º05’04”, city of “Entre Rios”) (Park et al., 2000).
Type 12 was obtained in the state of Minas Gerais, which is
located in the southeast region of Brazil (SL21°25’40.56” and WL45°56’46.84”, city of “Alfenas”) (Park et al.,
2000). The propolis samples were maintained at 4 °C in
black polyethylene bags.
Preparation of ethanolic extracts
The preparation of the ethanolic extracts of propo -lis (EEPs) was based on the methodology described by
Ikegaki (2001). Briely, 2 g of propolis were weighed,
and 15 mL of 80% ethanol (v/v) was added to each
sample. The samples were placed in a water bath at 70 °C for 30 min. The mixture was then centrifuged, and the
procedure was repeated, using a second extraction of 10
mL 80% ethanol (v/v). The supernatants from the two
extractions were mixed and transferred to a glass tube.
The EEP was analyzed for chemical composition and
biological activity.
Spectrophotometric analysis
The determination of the absorption spectrum was
carried out according to the methodology described by Ikegaki (2001). An aliquot of 25 mL of each EEP was diluted with 30 mL of 95% ethanol (v/v) to determine the absorption spectrum in the region in the UV-Vis region from 200 to 400 nm.
Total phenolic compounds
The analysis of the total phenolic compounds was
carried out according to the spectrophotometric method described by Folin-Ciocalteau (Woisky; Salatino, 1998). Gallic acid was used as a standard. Extract solutions (0.5 mL) at a concentration of 0.8% (w/v) were mixed with 2.5 mL of Folin-Ciocalteau reagent (1:10) and 2.0 mL of 4% Na2CO3 (w/v). The absorbance was measured at 740 nm after 2 hours of incubation in the dark at room temperature. A control study was conducted under the same conditions.
The content of the total phenolic compounds in the samples
was determined based on the standard curve of gallic acid.
The Folin-Ciocalteau method was validated, and the limits of detection (LOD) and limits of quantiication (LOQ) were 2.14 µg/mL and 6.49 µg/mL, respectively. The results of
the content of total phenols are expressed as gallic acid equivalents (mg GA/g of propolis).
Total flavonoid content
The total lavonoid content of the EEPs was deter
-mined according to the method described by Park et al. (1995) and Alencar et al. (2007). An aliquot of each EEP (0.5 mL) at a concentration of 8% (w/v) was mixed with 4.3 mL of 80% ethanol (v/v), 0.1 mL of 10% Al(NO3)3 (w/v) and 0.1 mL of 1 M potassium acetate. A control series was prepared in parallel, and ethanol was added instead of aluminum nitrate. After 40 minutes at room
temperature, the absorbance was measured at 415 nm. The total lavonoid content was calculated as quercetin (mg/g)
Reversed-phase high performance liquid chromatography (RP-HPLC)
The analysis of the ethanolic extracts of propolis by
reversed-phase high performance liquid chromatography (HPLC-RP) was performed according to the methodol-ogy described by Ikegaki (2001). A 20 mL aliquot of each extract was injected into a reverse phase column REGIS ODS (250 x 4.6 mm), and the column was then installed into a liquid chromatography system (Shimadzu Co.) composed of two LC-6AD pumps, a degasser DGU-2A, a SIL-10AF autosampler, a photodiode array detector SPD-M10Avp, a fraction collector FRC-10A and a column
oven CTO-10ASvp maintained at 35 °C. The mobile phase
consisted of water/acetic acid (19:1, v/v) (solvent A) and
methanol (solvent B) with a solvent low rate of 1 mL/min. The initial solvent concentration was 30% solvent B, and
the gradient was increased up to 40% B in 15 minutes, 50% B in 30 minutes, 60% B in 45 minutes, 75% B in 65 minutes, 85% B in 85 minutes, and 90% B in 95 minutes
and inally decreased to 30% B in 105 minutes. In this
study, we investigated the following authentic standards of phenolic acids and flavonoids (Extrasynthese Co.): quercetin, kaempferol, apigenin, pinocembrine, chrysin, acacetin, galangin, canferide, isosacuranetin, sacuranetin, ramnetin, isoramnetin, rutin, gallic acid, p-coumaric acid, cinnamic acid and ferulic acid.
Susceptibility test
The antimicrobial activity of the EEPs was deter
-mined as the minimum inhibitory concentration (MIC) and minimum bactericidal concentration (MBC) against
Staphylococcus aureus ATCC 6538. Isolated colonies
were suspended in 4.5 mL of sterile 0.9% NaCl until a turbidity with an absorbance of approximately 0.102 to 660 nm was reached, which is equivalent to a bacterial growth on the agar surface of 2 x 10⁷ CFU/mL. The MIC was determined according to a technique described by Duarte et al. (2003). A volume of 1.4 mL of the bacte-rial suspension was inoculated into 140 mL of nutrient broth to obtain a bacterial concentration of 2 x 10⁵ CFU mL. After homogenization, a volume of 4,950 mL of inoculated culture medium was placed in each tube. A
volume of 50 µL of ethanolic extract of propolis (inal
concentrations ranging from 320 µg/mL to 5 µg/mL) was
added to each tube, resulting in a inal volume of 5 mL.
A tube with the inoculated culture medium and 50 µL of
80% ethanol (v/v) served as a control. Then, the tubes
were agitated and incubated at 37 °C for 24 h. After in-cubation, the tubes were agitated and the absorbance was
measured in a spectrophotometer at 660 nm. The MIC was deined as the lowest concentration range of EEP in
which no visible bacterial growth occurred.
Based on the results obtained in the MIC test, the tubes that showed inhibitory activity were used as
inocu-lum suspensions. The nutrient agar plates were inoculated
using 50 mL of inoculum and subsequently incubated at
37°C for 24 h. The MBC was deined as the lowest con
-centration of EEP in which no cell growth occurred on the surface of the inoculated medium.
Free radical-scavenging activity on DPPH
The effect of DPPH radical scavenging was carried out according to Brand-Williams et al. (1995). The reac -tion mixture contained 0.5 mL of the ethanolic extract of propolis at a concentration of 90 µg/mL, 3 mL of ethanol P.A. and 0.3 mL of 0.5 mM DPPH radical
(1,1-diphenyl-2-picrilidrazil) ethanolic solution. The mixture was incu -bated for 45 minutes at room temperature and in the dark.
The absorbance was recorded at 517 nm in a spectropho
-tometer. The radical–scavenging activity was determined
as the antioxidant activity (AA), which was calculated using the rate of decline in absorbance of the DPPH solu-tion, samples and standards after 45 minutes of reaction (steady state) relative to the reference solution (DPPH in ethanol), according to the formula:
% Antioxidant activity = 100 - [(Asample- Ablank)*100)/Acontrol]
where:
Asample = absorbance of DPPH solution (samples)
Ablank = absorbance of the solution of the samples without the addition of DPPH
Acontrol = absorbance of the reference solution of DPPH (ethanol)
Cytotoxic activity determination in vitro
The HeLa tumor cell line was cultivated in DMEM
(Dulbecco’s Modified Eagle’s Medium - Gibco/Life
Technologies) culture medium, supplemented with 10%
(v/v) fetal bovine serum (Cultilab, Campinas, SP) and incubated at 37 °C with an atmosphere of 5% CO2 and 95% O2. Penicillin and streptomycin (Amresco) were used as antibiotics. After trypsinization, the cells were suspended in DMEM containing 10% (v/v) fetal bovine serum, distributed into 24-well plates at a density of 2.5 x 10⁴ cells/well and incubated at 37°C under the same conditions described above. After reaching 60-70%
various concentrations for a period of 24 h or 48 h. After the exposure time, 100 µL of methyl thiazolyl tetrazolium
chloride solution (MTT) (5 mg /mL in PBS) was added to
the each well, and the cells were incubated for another 3 h.
The culture medium was removed, the plate was washed
two times with PBS, and 200 µL of isopropanol solution
acidiied in 0.04 M HCl was added. Cellular viability was
determined by the absorbance at 560 nm with reference
to 655 nm (Mosmann, 1983). The data obtained in the
cell proliferation and cytotoxicity assays were analyzed using the GraphPad Prism program (GraphPad Software, San Diego, CA).
Statistical analysis
Statistical analysis of the results was performed us-ing the SAS 9.2 software. Analysis of variance (ANOVA)
and Tukey’s test were applied to detect signiicant differ -ences between mean values (p <0.05).
RESULTS AND DISCUSSION
For many years, Brazilian green propolis prevailed
in the Brazilian propolis market. The botanical origin of
Brazilian green propolis is rosemary, Baccharis dracun-culifolia (Park et al., 2002). Because of the popularity of green propolis, the quality parameters established both by
the market and by oficial organizations referred to this type of propolis. The establishment of quality parameters
made the Brazilian propolis trade increase. Because the primary market is in Japan, propolis trade has brought in
foreign currency and has contributed signiicantly to the
development of apiculture in Brazil.
Brazil has a large diversity of vegetation from which bees can collect resins, which causes great chemical diver-sity among the propolis collected in different regions and
in different seasons. The biological properties of propolis
are related to its chemical composition, and it became necessary to classify the different types of propolis found in Brazil. Park et al. (2000) ranked most prevalent types of
propolis in Brazil in 12 groups or types. The green propolis has been classiied as group 12 (G12), and the propolis of Bahia has been classiied as group 6 (G6).
The organoleptic characteristics, which are intrinsic
to the botanical origin of propolis, may represent obstacles
to the acceptance and consumption of propolis. The G6
and G12 propolis types have been sensorially analyzed.
The G6 propolis was brown with a hard consistency and a woody odor that is similar to certain types of wine. The
G12 propolis was green in color with a hard consistency
and had the characteristic odor of propolis. The ethanol
extracts showed the same differences in their color and odor characteristics when compared.
In addition to the organoleptic characteristics, other parameters are considered important for determining
propolis quality. According to the Technical Regulation of
Identity and Quality of the Propolis set forth by the Agri-culture Ministry (Brazil, 2001), the ultraviolet and visible
spectrum absorption, the content of total lavonoids and
phenolic compounds are considered important in deter-mining propolis quality.
Phenolic compounds generally exhibit an absorp-tion peak in the ultraviolet light range of 250 and 350 nm during spectrophotometric analysis (Mabry et al., 1970).
In our study, we examined the spectroscopic proiles of different propolis samples. The G6 propolis showed the
highest peak absorbance at a wavelength of 280 nm, while the G12 propolis presented the highest peak absorbance at
306 nm. The absorption maximum of G6 was signiicantly
lower than the absorption of G12 propolis, indicating a lower phenolic compound concentration (Figure 1).
The total phenolic and lavonoid contents also varied between the samples. The G6 propolis had a phenolic con
-tent of 14.8 mg GA/g of propolis (1.48%) and a lavonoid content of 0.32%. The G12 propolis showed a phenolic
content of 169.6 mg GA/g of propolis (16.96%) and a
lavonoid content of 6.15%. The minimum requirements
according to the Regulation of Identify and Quality of Propolis are 5% (w/w) for phenolic compounds and 0.5% (w/w) for flavonoids (Brazil, 2001). The contents for
total phenolics and lavonoids for propolis G6 are lower
than those required by Brazilian regulations and are also lower than those reported in the literature for propolis from temperate climates (Ahn et al., 2004; Kumazawa et al., 2004). Despite the low concentrations of these
cal compounds, propolis G6 showed biological activity, which suggests that chemicals other than phenolics and
lavonoids in the propolis possess similar biological ac
-tivities. Therefore, propolis G6 cannot be discriminated
against by any legislation because of its low phenolic and
lavonoid contents.
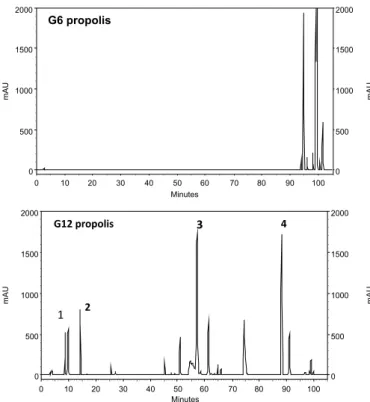
These results were confirmed by the analysis of
HPLC chromatograms. It was observed that propolis G6 has a chemical profile with a few apolar peaks. Based
on the phenolic and lavonoid standards, it was not pos
-sible to identify any particular substance. However, the
G12 propolis showed a proile with a greater variety of
substances of different polarities. We were able to iden-tify certain compounds, including cinnamic acid, ferulic acid, kanferide, and Artepilin C. Peaks 3 (kanferide) and 4 (artepilin-C) made up the majority of the composition of G12 (Figure 2).
Artepilin C has demonstrated several biological
activities, including anti-inlammatory properties (Pau
-lino et al., 2008), the inhibition of cell proliferation and angiogenesis (Keshavarz et al., 2009), antibacterial and antitumor properties (Salatino et al., 2005) and antioxidant properties (Shimizu, 2004). Castro et al. (2009) isolated
and identiied a prenylated benzophenone, Hyperibone A, from propolis G6. This compound has demonstrated
high antimicrobial activity and cytotoxicity against HeLa tumor cells.
Our results confirmed that G6 propolis does not reach the minimum criteria required by the Regulation
in any of the parameters. This propolis did not show an
absorption spectrum with characteristic peaks because
of the low lavonoid and phenolic compound contents.
G12 propolis showed a higher lavonoid and total phe
-nolic compound content, and a characteristic absorption
spectrum. These results show that the green propolis has excellent quality according to the Technical Regulation
(Instruction Nº 3 of January 19, 2001).
With regard to the biological activities of the propo-lis samples, we observed that the G6 propopropo-lis had more
effective antimicrobial and cytotoxic activities. The MIC
results showed that both types of propolis were able to inhibit the growth of S. aureus ATCC 6538; however,
G6 propolis showed much higher antimicrobial activity
compared to G12 propolis. The minimum inhibitory con
-centration of propolis G6 was between 5 and 10 µg/mL, while G12 propolis showed values between 40 and 80 µg/mL. Only G6 showed bactericidal activity, with a minimum bactericidal concentration between 160 and 320 µg/mL. In the antioxidant activity studies (Figure 3), G12 propolis showed higher DPPH radical-scavenging
activity (53.0%) than G6 propolis (21.7%). This result
was expected because phenolic compounds are known to have antioxidant properties (Park et al., 2002), and G12 propolis presented higher levels of these compounds, as described above.
According to Figure 4, G6 propolis showed higher cytotoxicity to HeLa tumor cells than G12 propolis at a concentration of 200 µg/mL. At this concentration, cell viability was less than 25% for the G6 propolis and
FIGURE 2 - Chromatograms obtained by RF-HPLC of the Ethanolic Extract of Propolis. G12 propolis: 1- Coumaric acid, 2- Ferulic acid, 3- Kanferide, 4- Artepilin C.
FIGURE 3 - Free radical-scavenging activity on DPPH of
the α-tocopherol, BHT and ethanolic extracts of G6 and
greater than 75% for G12 propolis. With these results, it was possible to trace the cell viability curve for different
concentrations of G6 propolis. The IC50 value obtained
was 60 µg/mL, which is the propolis concentration neces-sary to reduce the number of tumor cells by 50% in this experiment.
The correlations between phenolic compounds and
antioxidant activity and between the antioxidant activity
and the lavonoid content were positive, indicating that phenolic compounds and lavonoids have an important role in the antioxidant activity of propolis extracts. This
result corroborates previously published data (Park et al.,
2002). However, different substances may be involved in the biological activities that we analyzed (antimicrobial and cytotoxic), including Hyperibone A (Castro et al.,
2009), because we observed that G6 propolis, which has
the lowest phenolic compound and lavonoid contents,
showed the best antibacterial and cytotoxic effects. Silva et al. (2006) established the correlation between the levels of phenolics and flavonoids with antioxidant and antimicrobial activities of 49 samples of
Brazilian propolis. They demonstrated that the level of these compounds does not directly relect the biological activity of the propolis extracts. They also suggested that
tests of the biological activities should be included in the quality control of the propolis extracts.
The colorimetric method of determining total lavo -noids is not an accurate method because the bathochromic effect of the absorption caused by complexation with
aluminum is not uniform for all lavonoids. The chela
-tion between aluminum and lavonoids occurs differently
between lavonoids, and an increased degree of hydroxyl
-ation of the nucleus leads to an increase in the bathochro-mic effect, which causes the spectra to shift toward longer
wavelengths (Jurdi, Geissman, 1995; Oldoni, 2007). Thus, depending on the composition of the lavonoids, the results
can be under- or overestimated.
Ito et al. (2001) observed that the propolis classiied
as group 1 (G1) from Bage - RS showed anti-HIV activity in in vitro assays. However, Ikegaki (2001) analyzed six samples from the same city and found that there are no
lavonoids present in the composition of this propolis and
that the characteristic peaks are absent in the spectropho-tometric analysis.
Because propolis is a product of animal origin and must be registered as food in the Agriculture Ministry, it is appropriate that quality control does not include the examination of biological activities. However, propolis is used by people for therapeutic purposes and not as a food. According to Castaldo and Capasso (2002), propolis has been used for centuries to relieve symptoms of many dis-eases, and several studies are published every year in which the biological activity of propolis is evaluated. However,
the levels of phenolic compounds and lavonoids are not
always measured or, when they are evaluated, the correla-tion between these compounds and biological activity is negative (Cabral, 2008; Li et al., 2008; Awale et al., 2008).
It would be interesting to establish chemical
mark-ers for propolis through the isolation and identiication of biologically active compounds. These studies would
allow people to accurately assess the quality of Brazilian propolis and to determine the types of propolis that are
appropriate for medical use. This research might cause
other varieties of propolis to be considered of good quality, which could stimulate beekeepers in different regions of the country to produce propolis and increase their income and the Brazilian market share of propolis.
CONCLUSION
It was established that propolis G12 has a high
con-tent of total lavonoid and phenolic compounds, which
gives it an excellent quality according to the Technical
Regulation of Identity and Quality of Propolis from the Agriculture Ministry. However, propolis G6, which did
not reach the minimum levels of phenolics and lavonoids required, shows bacteriostatic and bactericidal eficiency and is cytotoxic to HeLa tumor cells. The results of this
study demonstrate that the concentration of phenolics and
lavonoids does not directly relect all of the biological
activities of propolis extracts.
REFERENCES
AHN, M.R.; KUMAZAWA, S.; HAMASAKA, T.; BANG, K.S.; NAKAYAMA, T. Antioxidant activity and constituents of propolis collected in various areas of Korea. J. Agric. Food Chem., v.52, n.1, p.7286-7292, 2004.
ALENCAR, S.M.; OLDONI, T.L.C.; CASTRO, M.L.; CABRAL, I.S.R.; COSTA-NETO, C.M.; CURY, J.A.; ROSALEN, P.L.; IKEGAKI, M. Chemical composition and biological activity of a new type of Brazilian propolis: red propolis. J. Ethnopharmacol., v.113, n.1, p.278-283, 2007.
AWALE, S.; LI, F.; ONOZUKA, H.; ESUMI, H.; TEKUZA, Y, KADOTA, S. Constituents of Brazilian red propolis and their preferential cytotoxic activity against human pancreatic PANC-1 cancer cell line in nutrient-deprived condition. Bioorg. Med. Chem., v.16, n.1, p.181-189, 2008.
BANKOVA, V.; POPOV, S.; MAREKOV, N.L. Isopentenyl cinnamates from poplar buds and propolis. Phytochem., v.28, n.3, p.871-873, 1989.
BRAND, W.; CUVELIER, M.E.; BERSET, C. Use of a free radical method to evaluate antioxidant activity. LWT - Food Sci. Technol., v.28, n.1, p.25-30, 1995.
B R A S I L . M i n i s t é r i o d a A g r i c u l t u r a , P e c u á r i a e d o Abastecimento. Instrução Normativa n.3, de 19 de janeiro de 2001. Regulamentos técnicos de identidade e qualidade de apitoxina, cera de abelha, geléia real, geléia real lioilizada, pólen apícola, própolis e extrato de própolis.
Diário Oicial da União, Brasília, 23 Jan. 2001a. Seção I, p.18-23.
BURDOCK, G.A. Review of the biological properties and toxicity of bee propolis. Food Chem.Toxicol., v.36, n.4, p.347-363, 1998.
CABRAL, I.S.R. Isolamento e identiicação de compostos com
atividade antibacteriana da própolis vermelha brasileira.
Piracicaba, 2008. 94 p. [Dissertation of Master degree.
“Luiz de Queiroz” College of Agriculture, University of São Paulo].
CABRAL, I.S.R.; OLDONI, T.L.C.; PRADO, A.; BEZERRA, R.M.N.; ALENCAR, S.M.; IKEGAKI, M.; ROSALEN, P.L. Composição fenólica, atividade antibacteriana e antioxidante da própolis vermelha brasileira. Quím. Nova, v.32, n.1, p.1523-1527, 2009.
CASTALDO, S.; CAPASSO, S. Propolis, an old remedy used in modern medicine. Fitoterapia, v.73, n.1, p.S1-S6, 2002.
CASTRO, M.L.; CURY, J.A.; ROSALEN, S.M.; IKEGAKI, M.; DUARTE, S.; KOO, H. Própolis do sudeste e nordeste do Brasil: inluência da sazonalidade na atividade antibacteriana e composição fenólica. Quím. Nova, v.30, n.7, p.1512-1516, 2007.
CASTRO, M.L.; NASCIMENTO, A.M.; IKEGAKI, M.; COSTA-NETO, C.M.; ALENCAR, S.M.; ROSALEN, P. Identification of a bioactive compound isolated from Brazilian própolis type 6. Bioorg. Med. Chem., v.17, n.14, p.5332-5335, 2009.
CHEN, C.N.; WU, C.L.; SHY, H.S.; LIN, J.K. Cytotoxic Prenyllavanones from Taiwanese propolis. J. Nat. Prod., v.66, n.4, p.503-506, 2003.
DUARTE, S.; KOO, H.; BOWEN, W.H.; HAYACIBARA, M.F.; CURY, J.A; IKEGAKI, M.; PARK, Y.K.; ROSALEN, P.L. Effect of a novel type of propolis and its chemical fractions on glucosyltransferases and on growth and adherence of mutans streptococci. Biol. Pharm. Bull., v.26, n.4, p.527-531, 2003.
DUARTE, S.; ROSALEN, P.L.; HAYACIBARA, M.F.; CURY, J.A.; BOWEN, W.H.; MARQUIS, R.E.; REHDER, V.L.; SARTORATTO, A.; IKEGAKI, M.; KOO, H. The inluence of a novel propolis on mutans streptococci bioilms and caries development in rats. Arch. Oral Biol., v.51, n.1, p.15-22, 2006.
IKEGAKI, M. Determinação de qualidade de propolis de Apis
mellifera africanizada da região sul do Brasil: avaliação de algumas propriedades físico-químicas e biológicas da própolis. Campinas, 2001. 74 p. [Thesis of PhD degree. Faculty of Pharmaceutical Sciences. University of São Paulo].
ITO, J.; CHANG, F.R.; WANG, H.K.; PARK, Y.K.; IKEGAKI, M.; KILGORE, N.; LEE, K.H. Anti-AIDS agents. 48. Anti-HIV activity of moronic acid derivatives and the new melliferone-related triterpenoid isolated from brazilian propolis. J. Nat. Prod., v.64, n.1, p.1278-1281, 2001.
JURD, L.; GEISSMAN, T.A. Absorption spectra of metal
complexes of lavonoid compounds. J. Org. Chem., v.21,
n.12, p.1395-1401, 1956.
KESHAVARZ, M.; MOSTAFAIE, A.; MANSOURI, K.; SHAKIBA, Y.; MOTLANGH, H.R. Inhibition of corneal neovascularization with propolis extract. Arch. Med. Res.,
v.40, n.1, p.59-61, 2009.
KUMAZAWA, S.; HAMASAKA, T.; NAKAYAMA, T. Antioxidant activity of propolis of various geographic origins. Food Chem. v.84, n.1, p.329-339, 2004.
LI, F.; AWALE, S.; TEKUZA, Y.; KADOTA, S. Cytotoxic constituents from Brazilian red propolis and their structure-activity relationship. Bioorg. Med. Chem., v.16, n.10, p.181-189, 2008.
MABRY, T.J.; MARKHAM, K.R.; THOMAS, M.B. The
systematic identiication of lavonoids. Berlin: Springer-Verlag, 1970. 354 p.
MOSMANN, T. Rapid colorimetric assay for cellular growth and survival: application to proliferation and cytotoxicity assays. J. Immunol. Methods, v.65, n.1, p.55-63, 1983.
OLDONI, T.L.C. Isolamento e identiicação de compostos com
atividade antioxidante de uma nova variedade de própolis brasileira produzida por abelhas da espécie Apis mellifera. Piracicaba, 2007. 104 p. [Dissertation of Master degree. “Luiz de Queiroz” College of Agriculture, University of São Paulo].
OLDONI, T.L.C.; CABRAL, I.S.R; REGITANO-d’ARCE, M.A.B.R.; ROSALEN, P.L.; IKEGAKI, M.; NASCIMENTO, A.M.; ALENCAR, S.M. Isolation and analysis of bioactive isolavonoids and chalcone from a new type of brazilian propolis. Sep. Pur. Technol., v.77, n.2, p.208-213, 2011.
PAULINO, N.; ABREU, S.R.L.; UTO, Y.; KOYAMA, D.; NAGASAWA, H.; HORI, H.; DIRSCH, V.M.; VOLLMAR, A.M.; SREMIN, A.; BRETZ, W.A. Anti-inlammatory effects of a bioavailable compound, Artepillin C, in Brazilian propolis. Eur. J. Pharmacol., v.587,n.1, p.296-301, 2008.
PARK, Y.K.; ALENCAR, S.M.; AGUIAR, C.L. Botanical origin and chemical composition of brazilian propolis. J. Agric. Food Chem., v.50, n.9, p.2502-2506, 2002.
PARK, Y.K.; IKEGAKI, M.; ALENCAR, S.M.; MOURA, F.F. Evaluation of brazilian propolis by both physicochemical methods and biological activity. Honey Bee Sci., v.21, n.2, p.85-90, 2000.
PARK, Y.K.; KOO, M.H.; SATO, H.H. Estudo de alguns componentes da própolis coletada por Apis mellifera no Brasil. Arq. Biol. Tecnol,v.38, n.1, p.1253-1259, 1995.
SALATINO, A.; TEIXEIRA, E.W.; NEGRI, G.; MESSAGE, D. Origin and chemical variation of brazilian propolis. E-CAM, v.2, n.1, p.33-38, 2005.
SFORCIN, J.L.; FERNANDES JR., A.; LOPES, C.A.M.; BANKOVA, V.; FUNARI, S.R.C. Seasonal effect on brazilian propolis antibacterial activity. J. Ethnopharmacol., v.73, n.1, p.243-249, 2000.
SHIMIZU, K. Antioxidative bioavailability of artepillin C in brazilian propolis. Arch. Biochem. Biophys., v.424, n.1, p.181-188, 2004.
SILVA, J.F.M.; SOUZA, M.C.; MATTA, S.R.; ANDRADE, M.R.; VIDAL, V.N. Correlation analysis between phenolic levels of Brazilian propolis extracts and their antimicrobial and antioxidant activities. Food Chem., v.99, n.1, p.431-435, 2006.
WOISKY, R.G.; SALATINO, A. Analysis of propolis: some parameters and procedures for chemical quality control. J. Apicult. Res., v.37, n.2, p.99-105, 1998.