THE DICKSON QUALITY INDEX IN FOREST SEEDLINGS
Alexandre Francisco Binotto 1, Alessandro Dal’ Col Lúcio2, Sidinei José Lopes² (received: August 26, 2009; accepted: July 29, 2010)
ABSTRACT: This study aims to identify correlations between growth variables and the Dickson quality index in seedlings of Eucalyptus grandis and Pinus elliottii var. elliottii. The experiment was conducted in a greenhouse and the following variables were observed: stem base diameter, shoot height, number of leaves, leaf dry matter, stem base dry matter, root dry matter, shoot dry matter, total dry matter, ratio of shoot dry matter to root dry matter and ratio of shoot height to stem base diameter in E. grandis 60, 75, 90, 105 and 120 days after seedling emergence, and in P. elliottii 25, 50, 75, 100, 125, 150 and 175 days after seedling emergence. Using Pearson correlation and also path and regression analyses, correlations were analyzed between observed variables according to day after emergence and the Dickson quality index. Stem base diameter was found to have stronger correlation with days after emergence in comparison to shoot height, in both species. Root dry matter was found to have stronger correlation with the Dickson quality index. Stem base diameter was the most suitable parameter to indicate seedling quality due to its higher correlation level with the Dickson quality index. Shoot height was only effective to indicate seedling quality if analyzed together with stem base diameter. Variables relating to dry matter showed the highest correlations with the Dickson quality index (DQI), followed by stem base diameter. Conversely, number of leaves showed the poorest correlations with DQI, followed by seedling height.
Key words: Eucalyptus grandis, Pinus elliottii, path analysis, regression analysis, linear correlation.
RELAÇÕES ENTRE VARIÁVEIS DE CRESCIMENTO E O ÍNDICE DE QUALIDADE DE DICKSON EM MUDAS FLORESTAIS
RESUMO: Neste estudo, objetivou-se identificar a relação entre variáveis de crescimento e o Índice de Qualidade de Dickson, em mudas de Eucalyptus grandis e Pinus elliottii var. elliottii. O trabalho foi realizado em casa de vegetação, com as observações das variáveis diâmtero de colo, altura da parte aérea, número de folhas, fitomassas secas de folhas, do colo, do sistema radicular, da parte aérea e total, as relações da fitomassa seca da parte aérea/ fitomassa seca do sistema radicular e da altura da parte aérea/ diâmtero de colo em E. grandis aos 60, 75, 90, 105 e 120 dias e em P. elliottii aos 25, 50, 75, 100, 125, 150 e 175 dias após emergência das mudas. Pela correlação de Pearson, análises de trilha e de regressão, avaliaram-se as relações entre as variáveis observadas com os dias após a emergência e o índice de qualidade de Dickson. O diâmtero de colo apresentou maior relação com os dias após emergência, quando comparado com a altura da parte aérea, para ambas as espécies estudadas. A fitomassa seca de raiz esteve mais correlacionada com o índice de qualidade de Dickson. O diâmtero de colo foi mais propício para indicar qualidade de muda, em razão do seu maior grau de relação com índice de qualidade de Dickson. A variável altura da parte aérea só se apresentou eficiente para indicar qualidade de mudas, quando analisada juntamente com o diâmtero de colo. As fitomassas secas são as variáveis com maiores relações com o Índice de Qualidade de Dickson (IQD), seguidas do diâmtero de colo. Já, o número de folhas, seguido da altura da muda, são as com menores relações com o IQD.
Palavras-chave: Eucalyptus grandis, Pinus elliottii, análise de trilha, regressão, correlação linear.
1Forest Engineer, M.Sc. in Forest Engineering – Rua Pinheiro Machado, 2755/41, São Pelegrino – 95020-172 – Caxias do Sul, RS – [email protected]
2Agronomist Engineer, Dr. Professor of Agronomy (Plant Production) – Departamento de Fitotecnia – Centro de Ciências Rurais – Universidade Federal de Santa Maria – Campus Universitário, Camobí – 97105-900 – Santa Maria, RS – [email protected], [email protected]
1 INTRODUCTION
Production of forest seedlings is one of the most important stages in the establishment of forest stands as it strongly affects forest yield. A successful, high yielding stand is closely dependent on the quality of planted seedlings, which should be capable of resisting adverse field conditions and grow into trees with an economically
458 BINOTTO, A. F. et al.
identifying the best production methods and planting seasons to ensure good quality seedlings (REIS et al. 2008b).
Several variables are used to evaluate seedling quality, including shoot height, root configuration, stem base diameter, ratio of shoot to root, ratio of stem base diameter to shoot height, dry and fresh matter weight of shoot and root, shoot stiffness and nutritional aspects (PAIVA & GOMES 1993).
The correlation between seedling height and shoot dry matter weight is an element to consider, due to their good relative contribution toward the seedling quality pattern (GOMES et al. 2002). These authors report that the lower the ratio of height to shoot dry matter weight, the more lignified the seedling and the greater its field survival capability. Wendling et al. (2005) demonstrated that rating seedlings according to height class has been widely used in commercial nurseries, facilitating fertilization and irrigation management, particularly to stimulate the growth of smaller seedlings. However, Fonseca et al. (2002) argue that variables used for evaluating seedling quality should not be studied separately, that way avoiding the risk of selecting higher and yet weaker seedlings while discarding smaller, sturdier ones.
The Dickson quality index - DQI (DICKSON et al. 1960) is a tool to evaluate seedling quality as a function of total dry matter (TDM), shoot height (SH), stem base diameter (SBD), shoot dry matter (SDM) – sum of stem base dry matter and leaf dry matter – and root dry matter (RDM), and is given by the expression:
DQI is considered a promising integrated measure of morphological traits (JOHNSON & CLINE 1991) and thought to be a good indicator of seedling quality as its calculation computes robustness and biomass distribution while considering several important parameters (FONSECA et al. 2002).
Given the above, this work aims to identify the relationship between morphological growth variables and the Dickson quality index so as to predict seedling quality
in Eucalyptus grandis and Pinus elliottii.
2 MATERIAL AND METHODS
This work was conducted in a
temperature-controlled greenhouse 6 X 30 m in size and located in the
Rural Sciences Center of the Federal University of Santa Maria (CCR-UFSM) at latitude 29°43’14.51’’ south and longitude 53°43’18.47’’ west, at an altitude of 93m. Seedlings
of Eucalyptus grandis W. Hill ex Maid. and Pinus elliottii
var. elliottii – Engelm were used, produced in T53/4
polypropylene tubes 125 mm in height, 12 mm in upper-end diameter, with a capacity of 53 cm³. Seeds of E.grandis were provided by Santa Maria Forest Nursery, as obtained from lot EGR24 of the Seed Production Area (SPA) of Horto
Florestal da Estância,a property owned by Riocell-Guaíba/
RS – known today as Aracruz Celulose. Seeds of P. elliottii
were also provided by Santa Maria Forest Nursery, as obtained from plot T31/lot CB14 of a Seed Production Area (SPA) of the Forest Research and Studies Institute (Seeds Division: Production, Technology and Commercialization of Forest Seeds), in Capão Bonito (SP). The substrate used
for E. grandis was Plantmax® and the substrate used for P.
elliottii was peat, with nutrient adjustments, applying 2.30
g of urea after each seedling measurement.
The experiment consisted of two trays containing 224 seedlings of eucalyptus and two trays containing 233 seedlings of pine. Evaluations of E. grandis were made 60, 75, 90, 105 and 120 days after the emergence of plant embryos (DAE), while evaluations of P. elliottii were made 25, 50, 75, 100, 125, 150 and 175 days after embryo emergence. In each evaluation, 32 seedlings of E. grandis
and 24 seedlings of P. elliottii were sampled in tray 1– the tray with varied competition, that is, rearranging the remaining seedlings in order to verify their behavior under conditions of improved light and aeration.
Assessed variables included stem base diameter (mm), shoot height (cm), number of leaves (NL), leaf dry matter (LDM), stem base dry matter (SBDM), root dry matter (RDM), shoot dry matter (SDM), total dry matter (TDM), ratio of shoot to root (RSR), ratio of shoot height to stem base diameter (RHD) and Dickson quality index (DQI). To obtain dry matters, each component (leaves, stem base, roots) were placed separately in paper bags and oven dried at 75° to 80°C for 72 h, with values expressed as g plant-1. After each data collection, remaining seedlings in tray 1 were rearranged so as to verify the influence of improved light and aeration conditions on seedlings. In tray 2 – the tray with full competition, that is, with no seedling removal –, also containing 224 and 233 seedlings of E. grandis and P. elliottii respectively, assessed variables included stem base diameter (SBD in mm), shoot height (SH in cm) and number of leaves (NL), selecting the same number of seedlings as in tray 1.
TDM(g) DQI
SH(cm) SDM(g)
The Pearson linear correlation analysis was applied between all observed variables, and correlation coefficients were broken down into direct and indirect effects through path analysis (CRUZ & CARNEIRO 2003), with DQI set as dependent variable.
A multiple linear regression analysis of DQI was conducted as a function of independent variables shoot height, stem base diameter and days after emergence. For
E. grandis, number of leaves was also used as an
independent variable. A simple linear regression analysis was also conducted, always computing days after emergence as independent variable, in full and varied competition. These analyses enable identifying, among non-destructive testing variables, those with stronger correlations with DQI and days after emergence, allowing estimations of seedling quality on the basis of time spent in the nursery.
To select the best regression models, higher adjusted coefficient of determination (R²aj), lower coefficient of variation (CV%) and lower mean standard error (Syx) criteria were used. A 5% probability level was adopted in all statistical analyses.
3 RESULTS AND DISCUSSION
All correlation coefficients were positive and significant (Table 1). In Pinus elliottii, variable height showed a higher correlation with other variables in comparison to Eucalyptus grandis. Variable number of leaves in E. grandis showed lower correlation coefficients, demonstrating a degree of unreliability in using it as an indicator of seedling quality. Root dry matter proved highly correlated with DQI, DAE, SBD, TDM, SBDM and LDM, in both species. According to Hermann (1964), root dry matter is acknowledged to be one of the best and most important variables for determination of survival and establishment of field seedlings, validating the significant relationship obtained in this study.
While studying seedlings of Schinus
terebinthifolius Raddi, José et al. (2005) observed that root
growth potential was significantly correlated with stem base diameter, agreeing with results obtained here, where stem base diameter was the variable most strongly correlated with the others, a result also shared by Johnson & Cline (1991).
Ratio of shoot dry matter to root dry matter can be considered an effective, safe index to evaluate seedling quality, as described by Parviainem (1981), as that correlation was found positive and significant (Table 1)
upon analysis of the Pearson correlation coefficient for SBDM and LDM with RDM.
Stem base diameter was found to be strongly correlated with all parameters, along with root dry matter, both in E. grandis and in P. elliottii. In fact, the architecture of the root system directly influences seedlings in that the greater the root area for nutrient absorption, the more positive the growth behavior. Thus stem base diameter along with root dry matter come as key morphological variables for determination of seedling quality, higher values corresponding to increased root volume, a result also shared by Daniel et al. (1997) with seedlings of Acacia
mangium.
Significant correlations were found between the Dickson quality index (DQI) and variables height, stem base diameter and days after emergence, indicating a satisfactory outcome due to the fact that the assessment of these variables has a non-destructive nature and thus facilitates and enables experimentation in forest nurseries. While studying seedling quality in Trema micrantha (L.) Blume, Fonseca et al. (2002) reported that DQI is highly correlated with all morphological parameters, agreeing with results in this study. Table 1 shows a tendency toward higher correlation coefficients for P. elliottii than for E.
grandis, with special mention of DAE and SBD.
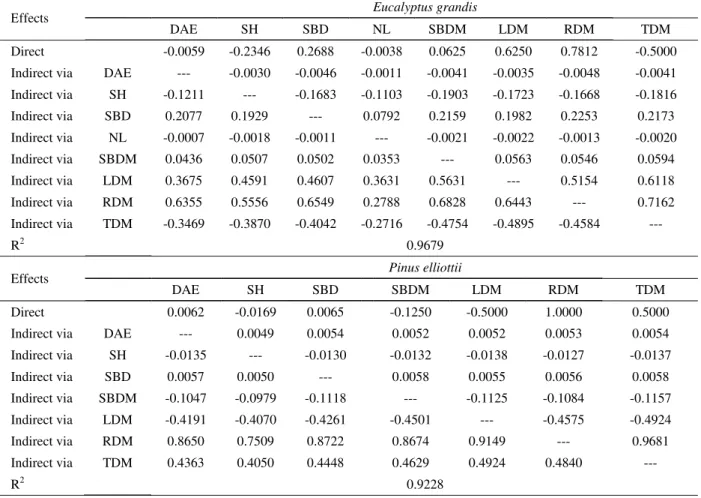
The degree of multicollinearity was considered weak, despite the significant correlations, allowing the use of all variables. Irrespective of the species, RDM followed by LDM showed the strongest direct effects while other variables, the strongest indirect effects, affecting estimations of direct effects with DQI (Table 2). This behavior demonstrates that in reality these variables are the true indicators of seedling quality.
Correlations of RDM and LDM with height and stem base diameter are of extreme importance. With these positive significant correlations it can be said that height and stem base diameter are indicators of RDM and LDM estimations.
460 BINOTTO, A. F. et al.
Table 1 – Pearson correlation coefficients among Dickson quality index (DQI) and other observed variables in seedlings of Eucalyptus grandis and Pinus elliottii. Santa Maria, RS, 2009.
Tabela 1 – Coeficientes de correlação de Pearson entre índice de qualidade de Dickson (DQI) e as demais variáveis observadas em mudas de Eucalyptus grandis e Pinus elliottii. Santa Maria, RS, 2009.
Eucalyptus grandis Pinus elliottii
DQI versus
DAE 0.7958 0.8455
SH 0.6557 0.7072
SBD 0.8780 0.8497
NL 0.3902 ---
SBDM 0.8818 0.8279
LDM 0.8862 0.8674
RDM 0.9677 0.9934
TDM 0.9461 0.9357
DAE vs
SH 0.5162 0.8002
SBD 0.7726 0.8846
NL 0.1824 ---
SBDM 0.6975 0.8378
LDM 0.5880 0.8382
RDM 0.8135 0.8650
TDM 0.6939 0.8727
SH vs
SBD 0.7176 0.7674
NL 0.4703 ---
SBDM 0.8112 0.7830
LDM 0.7346 0.8140
RDM 0.7111 0.7509
TDM 0.7741 0.8100
SBD vs
NL 0.2946 ---
SBDM 0.8033 0.8943
LDM 0.7372 0.8522
RDM 0.8382 0.8722
TDM 0.8084 0.8896
NL vs
SBDM 0.5643 ---
LDM 0.5811 ---
RDM 0.3569 ---
TDM 0.5432 ---
SBDM vs
LDM 0.9010 0.9001
RDM 0.8740 0.8674
TDM 0.9508 0.9259
LDM vs RDM 0.8247 0.9149
TDM 0.9789 0.9848
461 Correlations between growth variables ...
Table 2 – Direct and indirect effects and coefficient of determination (R2), obtained by using path analysis between the Dickson quality index and other observed variables in seedlings of Eucalyptus grandis and Pinus elliottii. Santa Maria, RS, 2009.
Tabela 2 – Efeitos direto e indireto e coeficiente de determinação (R2) obtidos pela análise de trilha entre o Índice de Qualidade de
Dickson e as demais variáveis observadas em mudas de Eucalyptus grandis e Pinus elliottii. Santa Maria, RS, 2009.
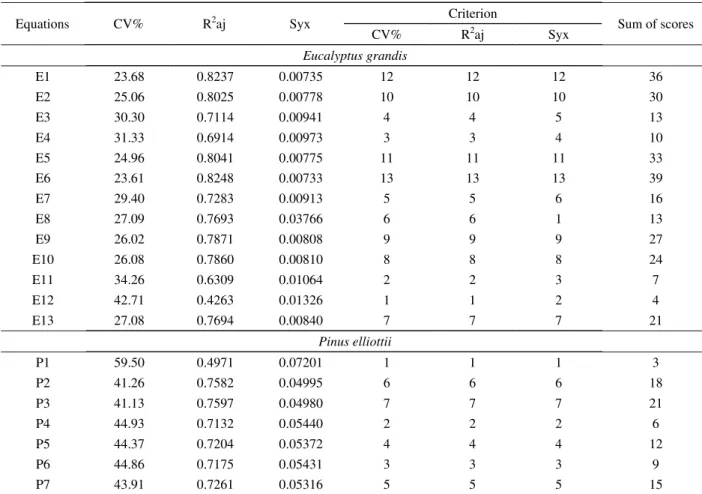
(Table 3), with independent variables DAE and SBD and R²aj = 0.8025, very close to the highest scoring equation E6, with R²aj = 0.8248. However, E6 includes variable NL. Models suggested as second and third best scoring models – E1 and E5 respectively – also include SH. It is thus suggested that model E2 be selected for the reason that, among the four best scoring models, it is the easiest to obtain and because its R²aj, CV% and Syx values are very close to the highest scoring model (E6 = 39).
Model E11, in which DAE individually explains DQI, is not suggested, as it comes last but one in scoring, reinforcing the fact that DAE can be accepted along with SBD as an independent variable to explain DQI. Also, SH as an independent variable to individually explain DQI (model
E12) showed the poorest score out of the 13, it being a great risk to use it individually to explain DQI. To a certain degree, this result relates to assertions made by Gomes & Paiva (2004), who reported that using shoot height as sole criterion to evaluate seedling quality in forest species can prove deficient where a high performance is expected from them.
As regards P. elliottii, the best scoring model, P3, is related to independent variables DAE and SBD and is considered one of the easiest to obtain (Table 3). According to Gomes & Paiva (2004), stem base diameter, being easily measurable, is considered by many researchers a critical parameter for estimating field survival of forest seedlings. According to these authors, in several forest species, the quality standard of seedlings ready for planting has a high correlation with said parameter, and that can be verified by
Effects Eucalyptus grandis
DAE SH SBD NL SBDM LDM RDM TDM
Direct -0.0059 -0.2346 0.2688 -0.0038 0.0625 0.6250 0.7812 -0.5000 Indirect via DAE --- -0.0030 -0.0046 -0.0011 -0.0041 -0.0035 -0.0048 -0.0041 Indirect via SH -0.1211 --- -0.1683 -0.1103 -0.1903 -0.1723 -0.1668 -0.1816 Indirect via SBD 0.2077 0.1929 --- 0.0792 0.2159 0.1982 0.2253 0.2173 Indirect via NL -0.0007 -0.0018 -0.0011 --- -0.0021 -0.0022 -0.0013 -0.0020 Indirect via SBDM 0.0436 0.0507 0.0502 0.0353 --- 0.0563 0.0546 0.0594 Indirect via LDM 0.3675 0.4591 0.4607 0.3631 0.5631 --- 0.5154 0.6118 Indirect via RDM 0.6355 0.5556 0.6549 0.2788 0.6828 0.6443 --- 0.7162 Indirect via TDM -0.3469 -0.3870 -0.4042 -0.2716 -0.4754 -0.4895 -0.4584 ---
R2 0.9679
Effects Pinus elliottii
DAE SH SBD SBDM LDM RDM TDM
Direct 0.0062 -0.0169 0.0065 -0.1250 -0.5000 1.0000 0.5000 Indirect via DAE --- 0.0049 0.0054 0.0052 0.0052 0.0053 0.0054 Indirect via SH -0.0135 --- -0.0130 -0.0132 -0.0138 -0.0127 -0.0137 Indirect via SBD 0.0057 0.0050 --- 0.0058 0.0055 0.0056 0.0058 Indirect via SBDM -0.1047 -0.0979 -0.1118 --- -0.1125 -0.1084 -0.1157 Indirect via LDM -0.4191 -0.4070 -0.4261 -0.4501 --- -0.4575 -0.4924 Indirect via RDM 0.8650 0.7509 0.8722 0.8674 0.9149 --- 0.9681 Indirect via TDM 0.4363 0.4050 0.4448 0.4629 0.4924 0.4840 ---
462 BINOTTO, A. F. et al.
Table 3 – Coefficients of variation (CV%) and adjusted determination (R2aj), standard deviation (Syx) of equations between observed variables in seedlings of Eucalyptus grandis and Pinus elliottii. Santa Maria, RS. 2009.
Tabela 3 – Coeficientes de variação (CV%) e de determinação ajustado (R2aj), desvio padrão (Syx) das equações entre variáveis
observadas em mudas de Eucalyptus grandis e Pinus elliottii. Santa Maria, RS. 2009.
Equations CV% R2aj Syx Criterion Sum of scores
CV% R2aj Syx
Eucalyptus grandis
E1 23.68 0.8237 0.00735 12 12 12 36
E2 25.06 0.8025 0.00778 10 10 10 30
E3 30.30 0.7114 0.00941 4 4 5 13
E4 31.33 0.6914 0.00973 3 3 4 10
E5 24.96 0.8041 0.00775 11 11 11 33
E6 23.61 0.8248 0.00733 13 13 13 39
E7 29.40 0.7283 0.00913 5 5 6 16
E8 27.09 0.7693 0.03766 6 6 1 13
E9 26.02 0.7871 0.00808 9 9 9 27
E10 26.08 0.7860 0.00810 8 8 8 24
E11 34.26 0.6309 0.01064 2 2 3 7
E12 42.71 0.4263 0.01326 1 1 2 4
E13 27.08 0.7694 0.00840 7 7 7 21
Pinus elliottii
P1 59.50 0.4971 0.07201 1 1 1 3
P2 41.26 0.7582 0.04995 6 6 6 18
P3 41.13 0.7597 0.04980 7 7 7 21
P4 44.93 0.7132 0.05440 2 2 2 6
P5 44.37 0.7204 0.05372 4 4 4 12
P6 44.86 0.7175 0.05431 3 3 3 9
P7 43.91 0.7261 0.05316 5 5 5 15
E1) DQI= -0.0410 + 0.00025*dae + 0.00034*sbd - 0.000094*sh + 0.00044*nl E2) DQI = -0.0388 + 0.00024*dae + 0.37435*sbd
E3) DQI = -0.0395 + 0.00051*dae + 0.00341*sh E4) DQI = -0.0333 + 0.000617*dae + 0.000689*nl
E5) DQI = -0.0404 + 0.000246*dae + 0.33969*sbd + 0.000782*sh E6) DQI = -0.0412 + 0.000255*dae + 0.33953*sbd + 0.000433*nl E7) DQI = -0.0400 + 0.000523*dae + 0.00261*sh + 0.00042*nl E8) DQI = -0.0349 + 0.48164*sbd + 0.000542*sh
E9) DQI = -0.0357 + 0.47910*sbd + 0.000392*nl
E10) DQI = -0.0353 + 0.48934*sbd - 0.000288*sh + 0.00041*nl E11) DQI = -0.0279 + 0.00065*dae
E12) DQI = -0.0168 + 0.0067*sh E13) DQI = -0.0339 + 0.5034*sbd P1) DQI = -0.1475 + 0.0282 *sh
P2) DQI = -0.126 + 0.00086519*dae + 0.00108*sbd + 0.000320*sh P3) DQI = -0.125 + 0.000874*dae + 0.00109*sbd
P4) DQI = -0.050 + 0.00171*dae P5) DQI = -0.167 + 0.00198*sbd
463 Correlations between growth variables ...
significant increases in survival and growth rates of plants out in the field.
The second best scoring model had SH added, in agreement with Gomes et al. (2002), suggesting that SBD, whether measured in isolation or in combination with SH, was an important morphological trait to predict seedling quality in forest species. It should be noted that SBD appears as independent variable in all four best scoring models, it being of great importance, as with E. grandis, disregarding plant matter. The reliability of DAE in isolation to explain DQI is poor, as model P4 obtained the second lowest score. In analyzing model P1 (Table 3), SH proved unreliable to explain DQI, as this model obtained the lowest score, similarly to E. grandis.
Table 4 – Coefficient of determination (R2) and standard deviation (Syx) of equations between observed variables in seedlings of Eucalyptus grandis and Pinus elliottii, for each competition type. Santa Maria, RS. 2009.
Tabela 4 – Coeficiente de determinação (R2) e desvio padrão (Syx) das equações entre as variáveis observadas em mudas de
Eucalyptus grandis e Pinus elliottii com diferentes níveis de competição. Santa Maria, RS. 2009.
In comparing the effects of different competition types, best model fits were obtained for varied competition, irrespective of the species (Table 4). This can be explained by the fact that varied competition allows more room between seedlings throughout the development cycle, allowing better light absorption than full competition and favoring more evenly distributed diameters.
As for SH in full competition, seedlings tended to show an irregular growth pattern while striving for light absorption, and this behavior caused them to differ, with sturdier seedlings outstripping weaker ones, characterizing dissimilar behavior in comparison to varied competition, in both species. This result can be confirmed by observing that in both species the analysis of height in full competition derived a smaller R² value and a
Eucalyptus grandis
Full competition Varied competition
--- NL vs DAE ---
NL = 13.30 + 0.01DAE NL = 7.32 + 0.06DAE
R2 0.0046 0.0388
Syx 5.76 6.05
--- SBD vs DAE ---
SBD = 35.23 + 1.05DAE SBD = 22.00 + 1.17DAE
R2 0.4716 0.5879
Syx 23.55 19.97
--- SH vs DAE ---
SH = 2.82 + 0.05DAE SH = 2.65 + 0.05DAE
R2 0.2310 0.3029
Syx 1.90 1.49
Pinus elliottii
Full competition Varied competition
--- SBD vs DAE ---
SBD = 78.02 + 0.69DAE SBD = 70.23 + 0.75DAE
R2 0.7662 0.7736
Syx 19.11 19.35
--- SH vs DAE ---
SH = 5.53 + 0.456DAE SH = 4.78 + 0.049DAE
R2 0.2009 0.6408
464 BINOTTO, A. F. et al.
higher Sxy value than in varied competition, indicating greater variability in growth pattern.
The correlation of SBD with DAE was better evidenced with estimations from linear equations for the relevant species (Table 4), which, in comparison to other equations, having height and number of leaves as dependent variables, in eucalyptus, those correlating SBD with DAE showed best fittings. This indicates that, in order to verify the degree of seedling quality, stem base diameter is the non-destructive testing variable that best expresses this characteristic, in other words, the larger the diameter, the greater the shoot dry matter volume and the higher the DQI value, indicating better quality.
4 CONCLUSIONS
Dry matter variables are the most strongly correlated with the Dickson quality index (DQI), followed by stem base diameter.
Number of leaves is the variable showing the poorest correlation with DQI, followed by seedling height.
5 ACKNOWLEDGMENTS
The authors wish to thank CNPq for granting scholarships for research accomplishment.
6 BIBLIOGRAPHICAL REFERENCES CRUZ, C. D.; CARNEIRO, P. C. S. Modelos biométricos aplicados ao melhoramento genético. Viçosa, MG: UFV, 2003. 585 p.
DANIEL, O. et al. Aplicação de fósforo em mudas de Acacia mangium. Revista Árvore, Viçosa, v. 21, n. 2, p. 163-168, 1997.
DICKSON, A.; LEAF, A. L.; HOSNER, J. F. Quality appraisal of white spruce and white pine seedling stock in nurseries.
Forestry Chronicle, v. 36, p. 10-13, 1960.
FONSECA, E. P. et al. Padrão de qualidade de mudas de Trema micrantha (L.) Blume, produzidas sob diferentes períodos de sombreamento. Revista Árvore, Viçosa, v. 26, n. 4, p. 515-523, 2002.
GOMES, J. M. et al. Parâmetros morfológicos na avaliação da qualidade de mudas de Eucalyptus grandis. Revista Árvore,
Viçosa, v. 26, n. 6, p. 655-664, 2002.
GOMES, J. M.; PAIVA, H. N. Viveiros florestais: propagação sexuada. 3. ed. Viçosa, MG: UFV, 2004. 116 p.
HERMANN, R. K. Importance of top-root ratios for survival of Douglas-fir seedlings. Tree Planters’ Notes, v. 64, p. 7-11, 1964.
JOHNSON, J. D.; CLINE, M. L. Seedling quality of southern pines. In: DURYEA, M. L.; DOUGHERTY, P. M. (Eds.). Forest regeneration manual. Netherlands: Klumer Academic, 1991. p. 143-162.
JOSÉ, A. C.; DAVIDE, A. C.; OLIVEIRA, S. L. Produção de mudas de aroeira (Schinus terebinthifolius raddi) para recuperação de áreas degradadas pela mineração de bauxita. Cerne, Lavras, v. 11, n. 2, p. 187-196, 2005.
PAIVA, H. N.; GOMES, J. M. Viveiros florestais. Viçosa, MG: UFV, 1993. 56 p.
PARVIAINEM, J. V. Qualidade e avaliação de mudas florestais. In: SEMINÁRIO DE SEMENTES E VIVEIROS FLORESTAIS, 1., 1981, Curitiba. Anais... Curitiba: FUPEF, 1981. p. 59-90.
REIS, E. R. et al. Período de permanência de mudas de Eucalyptus grandis em viveiro baseado em parâmetros morfológicos. Revista Árvore, Viçosa, v. 32, n. 5, p. 809-814, 2008a.
REIS, E. R. et al. Variabilidade dos parâmetros morfológicos em mudas de Pinus elliottii Engelm. Cerne, Lavras, v. 14, n. 2, p. 141-146, 2008b.