ANALYSIS IN
Panicum maximum
Identificação de ideótipos por meio de análisecanônica em Panicum maximum
Janaina Azevedo Martuscello1, Thiago Gomes dos Santos Braz2, Liana Jank3 Daniel de Noronha Figueiredo Vieira da Cunha4, Ana Luiza Silva Carvalho4
ABSTRACT
Grouping of genotypes by canonical variable analysis is an important tool in breeding. It allows the grouping of individuals
with similar characteristics that are associated with superior agronomic performance and may indicate the ideal profile of a plant for the region. The objective of the present study was to define, by canonical analysis, the agronomic profile of Panicum maximum
plants adapted to the Agreste region. The experiment was conducted in a completely randomized design with 28 treatments, 22
genotypes of Panicum maximum, and cultivars Mombasa, Tanzania, Massai, Milenio, BRS Zuri, and BRS Tamani in triplicate in
4-m² plots. Plots were harvested five times and the following traits were evaluated: plant height; total, leaf, and stem; dead dry matter yields; leaf:stem ratio; leaf percentage; and volumetric density of forage. The analysis of canonical variables was performed based on the phenotypic means of the evaluated traits and on the residual variance and covariance matrix. Genotype PM34 showed higher mean leaf dry matter yield under the conditions of the Agreste of Alagoas (on average 53% higher than cultivars Mombasa, Tanzania, Milenio and Massai). It was possible to summarize the variation observed in eight agronomic characteristics in only two canonical variables accounting for 81.44 % of the data variation. The ideotype plant adapted to the conditions of the Agreste should be tall and present high leaf yield, leaf percentage, and leaf:stem ratio, and intermediate values of volumetric density of forage.
Index terms: Multivariate analysis; breeding value; agronomic performance; leaf dry matter.
RESUMO
O agrupamento de genótipos, via análise de variáveis canônicas, é importante ferramenta para o melhoramento e permite reunir indivíduos com características afins que, associadas ao melhor desempenho agronômico, podem ser indicativas do perfil ideal de planta para a região. Nesse sentido, objetivou-se definir, por meio do uso de análise canônica, o perfil agronômico de plantas de
Panicum maximum adaptadas à região do agreste. O experimento foi conduzido em delineamento inteiramente casualizado com
28 tratamentos, 22 genótipos de P. maximum e os cultivares Mombasa, Tanzânia, Massai, Milênio, BRS Zuri e BRS Tamani e três repetições, em parcelas de 4 m². Foram realizados cinco cortes por parcela e avaliadas as características: altura de planta, massa
seca total, massa seca de folhas, massa seca de colmos, massa seca de material morto, relação folha/colmo, porcentagem de folhas e densidade volumétrica da forragem. A análise de variáveis canônicas foi realizada com base na média fenotípica dos caracteres avaliados e na matriz de variâncias e covariâncias residuais. O genótipo PM34 apresentou maior média para massa seca de folhas
nas condições do Agreste Alagoano (em média, 53% superior aos cultivares Mombasa, Tanzânia, Milênio e Massai). Foi possível
resumir a variação observada em oito caracteres agronômicos em apenas duas variáveis canônicas, que acumularam 81,44% da variação dos dados. O ideótipo de planta adaptada às condições do Agreste deve apresentar, além de alta produção de folhas, porte alto, alta porcentagem de folhas, alta relação folha/colmo e valores intermediários de densidade volumétrica de forragem.
Termos para indexação: Análise multivariada; valor genotípico; desempenho agronômico; massa seca de folhas.
1Universidade Federal de São João del-Rei/UFSJ – Departamento de Zootecnia/DZOO – Campus Tancredo de Almeida Neves – 36360-000 – São João del-Rei – MG – Brasil – [email protected]
2Universidade Federal dos Vales do Jequitinhonha e Mucuri/UFVJM – Departamento de Zootecnia/DZO – Alto da Jacuba – Diamantina – MG – Brasil 3Empresa Brasileira de Pesquisa Agropecuária/EMBRAPA – Embrapa Gado de Corte – Campo Grande – MS – Brasil
4Universidade Federal de São João del-Rei/UFSJ – Departamento de Zootecnia/DZOO – São João del-Rei – MG – Brasil Received in september 9, 2014 and approved in november 3, 2014
INTRODUCTION
The Brazilian Agreste is a region extending from Bahia to Piauí, characterized as a transition zone between the Atlantic Forest and the Brazilian semi-arid zone. This region has an annual rainfall ranging from 650 to 1000 millimeters, but owing to its irregular distribution, there are few options of forage plants for use in animal production systems. Thus,
Panicum maximum Jacq. is the most productive
seed-propagated forage species available, and is an excellent option for diversifying and intensifying the use of Brazilian pastures (Jank; Resende; Valle, 2008). In view of its high productivity, studies investigating the adaptation of this crop species to the Agreste region could indicate accessions and/or cultivars for use in the region.
The definition of ideotypes has been used in the search for cultivars that present favorable characteristics for increased productivity of a crop. These traits can be morphological, biochemical, physiological, or agronomic, and when combined in one individual, can provide increased yields. Thus, the definition of ideotypes involves the identification of features that must be incorporated into a plant model that takes into account the environmental conditions of the cultivation area (Donald, 1968; Almeida; Mundstock; Sangoi, 1998).
Canonical analysis has several uses in plant breeding, its main applications being clustering and studies of genetic diversity. By the evaluation of graphic dispersion of genotypes based on canonical variables, it is possible to group individuals with similar characteristics. The identification of groups formed by individuals of superior traits of interest in breeding, such as leaf yield (Jank; Resende; Valle, 2011), allows the identification of characteristics associated with superior performance.
The objectives of this research were to evaluate and identify, by canonical analysis, the agronomic profile of P. maximum plants adapted to the Brazilian Agreste region.
MATERIAL AND METHODS
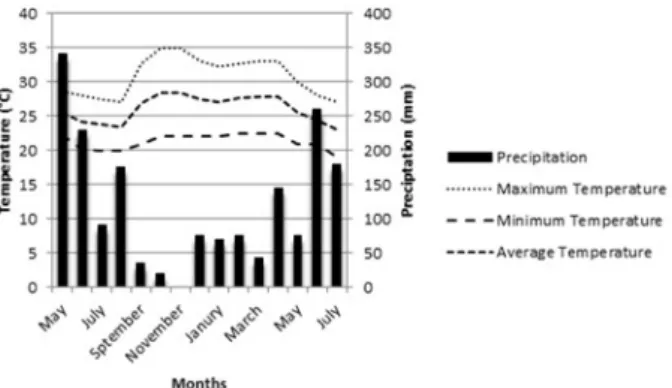
The experiment was conducted at the Federal University of Alagoas, CampusArapiraca from May 2010 to July 2011 in an experimental area located at 9° 45’ 6’’ S and 36° 39′ 37″ W. The city of Arapiraca is located in the subhumid Agreste, where the climate is of the As type, according to the Köppen climate classification, with a dry season in the summer and a rainy fall/winter. Air temperature and rainfall data obtained during the experimental period are shown in figure 1.
The soil of the area, classified as Oxisol (EMBRAPA, 1999), was collected and evaluated for chemical analysis. Soil samples were collected from the 0−20 cm layer of the soil and analyzed in a specialized laboratory, yielding the following results: pH (H2O), 5.4; Ca
+2, 4.7 cmol c/dm
3; Mg+2, 2.2 cmol
c/dm
3; Al+3, 0.0 cmol
c/dm
3; H + Al, 4 cmol
c/
dm3; SB, 7.23 cmolc/dm3; CTC, 11.23 cmolc/dm3;V (%), 64.4; P, 68 cmolc/dm
3 e K+, 142 cmol c/dm
3.
The experiment was conducted as a completely randomized design with 28 treatments, the genotypes of
P. maximum PM04, PM11, PM13, PM14, PM15, PM19,
PM20, PM21, PM22, PM25, PM30, PM33, PM34, PM36, PM37, PM38, PM39, PM40, PM43, PM44, PM46, PM271 (previously selected by Embrapa Beef Cattle), and cultivars Mombasa, Tanzania, Massai, Milenio, BRS Zuri, and BRS Tamani, in triplicate. The experiment was established in plots of 4 m² (2 × 2 m), with a spacing of 1 m between plots. The cultivars were seeded with a spacing of 10 cm between rows and 5 cm between plants. Fertilization consisted of 20 kg ha−1 P
2O5 applied as single
superphosphate (applied at planting), 100 kg ha−1 N (urea), and 80 kg ha−1 K
2O (potassium chloride). Nitrogen and
potassium were applied by broadcasting after plants were completely established. After the harvest cuts, maintenance fertilization with 50 kg ha−1 N (urea) and 30 kg ha−1 K
2O
(KCl) was performed.
Figure 1: Air temperature and rainfall during the experimental period.
During the experimental period five harvests per plot were taken, four in the rainy season (07/19/2010, 09/05/2010, 06/03/2011, 07/30/2011) and one in the dry season (03/28/2011). Plants were cut 20 cm from the soil. Immediately after each cut, the material was weighed to obtain the green matter yield (GMY). Samples were separated into leaf blades, stem + leaf sheath, and dead material and forced-air dried at 55ºC to a constant weight to estimate total dry matter yield, stem dry matter yield, leaf dry matter yield, dry matter yield of dead material, leaf percentage, and leaf:stem ratio.
The height of the plants in the plots was determined with a millimeter-scale ruler and measured prior to the harvest cuts.
m−²), leaf:stem ratio (LSR), leaf percentage (%F), and volumetric density of the forage (DENS, g cm−2 m²).
First, the genotypes were ranked based on the estimated genotypic value of LDM to identify those with highest yield potential under the evaluated conditions. To estimate the genotypic value and confidence intervals (95%) of the mean, a linear mixed model was used, as implemented in the Statistical System and Computerized Selection via Linear Mixed Models (SELEGEN - RELM/ BLUP) according to Resende (2007):
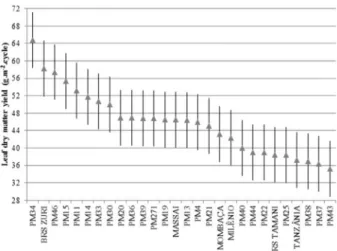
The leaf component is also of utmost importance in the evaluation of forage plants, given that it is a better indicator of quality than the other morphological components of the plant. The genotypes BRS Zuri, PM46, PM15, and PM11, showed overlap of the confidence intervals with the genotype PM34 (Figure 2) and may also be considered as genotypes of good performance of leaf production, and also as better adapted. These genotypes have great potential for use in the Northeast region, and are promising for cultivar release. The genotype with the lowest LDM performance was PM43, which showed an overlapping IC with 70% of the evaluated genotypes, including cultivars Mombasa, Tanzania, Milenio, and Massai (Figure 1). These genotypes showed LDM genotypic means of 43.2, 37.3, 42.4, and 46.5 g m−²/cycle, whereas genotype PM43 showed a genotypic value of 35.1 g m−²/cycle.
The LDM yield of genotype PM34 was on average 53% higher than the commercial genotypes Mombasa, Tanzânia, Milênio, and Massai, with no overlap between these and the confidence interval. These results suggest that the P. maximum cultivars available in the market are
not the most suitable for use in animal production systems in the Agreste, supporting the desirability of studies aimed at identifying forages adapted to the region. The highest LDM yield for PM34 was also observed by Fernandes et al. (2014) evaluating the samegenotypes in the Brazilian savannah. According to these authors, P. maximum is well suited to the soil and climate conditions of savannahs. This may explain the low performance of the commercial genotypes.
y = Xm + Zg + Wp + e
in which y is the data vector, m is a vector of the effects of combinations measurement replication (assumed to be fixed) added to the overall mean, g is a vector of genotypic effects (assumed to be random), p is a vector of permanent environmental or plot effects (random) and e is a vector of errors and residues (random). The capital letters represent incidence matrices for the effects.
The canonical variable analysis was based on the phenotypic means of the evaluated traits and on the residual variance and covariance matrix. These analyzes were performed using the GENES program, in the Multivariate Analysis and Simulation section (Cruz, 2006).
RESULTS AND DISCUSSION
The agronomic traits of forage of interest were used as an indicator of adaptation of P. maximum
plants to Agreste conditions. According to Dias-Filho, Simão Neto, and Serrão (1994) the initial evaluation of genotypes for their adaptability to a particular environment is an ideal condition for the application of multivariate clustering techniques, given that a large number of genotypes are evaluated simultaneously for a large number of traits.
For LDM yield, genotypes were compared by means of confidence intervals (Figure 1). Differences among the evaluated genotypes were found, a result indicative of favorable conditions for the selection of superior genotypes for leaf production. It may be noted that genotype PM34 showed the highest LDM mean (64.8 g m−²) under the conditions of the Agreste. This variable was taken as indicative of the adaptation of genotypes to the region, given that those producing more leaves were less adversely affected by the prevailing weather conditions during the experimental period. According to Zabala et al. (2011), it was possible to differentiate genotypes of Elymus scabrifolius through principal component analysis only when they were subjected to stress conditions.
Figure 2: Confidence interval (95%) for leaf dry matter
yield mean of Panicum maximum genotypes evaluated in
The relative importance of traits in the study of genetic diversity among genotypes was evaluated using the canonical variables. The high efficiency of the canonical variables analyses was observed, given that it permitted summarization in only two canonical variables of 81.44% of the data variation observed in eight agronomic traits (Table 1). According to Cruz, Regazzi and Carneiro (2004), the feasibility of using canonical variables as a technique to identify similar genotypes in two- or three-dimensional plots depends on the ability of two or three canonical variables to account for approximately 80% of the variation observed in the data.
Using this analysis, it was also possible to study the importance of the traits in the genotypes clustering. The variables with most weight in the last eigenvectors were associated with eigenvalues of root traits below 0.7, and those of lower cumulative variance are considered to be of little importance.
The variable TDM showed greater weight in the last six eigenvectors and was identified within this group of variables as the least important for discriminating the genotypes (Table 1). When LDM production is considered as a predictor variable for the adaptation of a given group of forage plants to environmental conditions of the Agreste, TDM production is less important, given that it includes the SDM and DDM components, and alone is not able to provide a basis for assessing animal performance. In fact, the use of leaf dry matter is preferred in studies evaluating forage plants,
as it represents the fraction with the higher digestibility and intake, and is more strongly associated with animal performance (Penning; Parsons; Orr, 1994; Euclides et al, 1999).
Variables with highest weight in the last eigenvectors generally exhibit high correlation coefficients with other variables under study. Thus, variables with Pearson’s correlations around 0.8 are considered to be important associations. According to Resende (2007), variables that have very high genetic correlations may be discarded for not affording better discrimination of the genotypes, advice that also applies to phenotypic correlations. Van de Wouw et al. (2008) and Jorge et al. (2008) based their study of genetic diversity on correlations above 0.7 to discard redundant variables.
Thus, it can be observed that TDM was highly correlated with PLH, LDM, and SDM (Table 2). The high correlation coefficient observed identifies it as a redundant variable for discriminating the genotypes. High correlation coefficients were also observed between PLH and DENS, PLH and SDM, and between SDM and %F. However, in general the variables were weakly correlated, making them ideal for assessing the diversity among genotypes. The high positive correlation between TDM and SDM is noteworthy, indicating that larger plants are more prone to the accumulation of stems and hence require greater control of defoliation. This inference is supported by the high positive correlation between SDM and %F (Table 2).
Table 1: Root characteristic (λj), accumulated variance percentage (% ACUM) and eigenvectors associated with
canonical variables (CV).
CV λj
% ACUM
Associated eigenvectors
PLH LDM SDM DDM TDM LSR %F DENS
1 3.0940 67.88 0.1886 −0.3570 0.8969 0.5029 −2.0342 −0.0053 0.6911 1.5363
2 0.6179 81.44 0.0510 −0.4419 −1.4796 −0.4165 2.1416 0.0128 0.4976 −0.2435
3 0.3488 89.09 0.1455 2.8463 3.5339 0.6781 −5.4802 0.0314 0.1252 0.7514
4 0.2093 93.68 0.3895 0.3443 2.6261 0.3829 −2.7880 0.2703 1.2693 −0.0448
5 0.1255 96.44 0.2347 −3.9714 −2.6752 −1.7090 6.3503 0.0580 0.7836 0.3149
6 0.0887 98.38 0.5023 2.4688 2.7090 1.8528 −4.7383 0.3702 −0.1659 0.3284
7 0.0433 99.33 0.7771 −1.4886 −3.1471 −1.2240 3.4340 0.1736 −0.9311 0.5107
8 0.0303 100.00 −0.4891 −0.2044 −0.9607 −0.3032 1.1103 0.9120 −0.6165 −0.1911
Table 2: Matrix of phenotypic correlations among agronomic variables evaluated in Panicum maximum genotypes.
LDM SDM DDM TDM LSR %F DENS
PLH 0.4009 0.6918 −0.4515 0.6515 0.0754 −0.417 −0.8017
LDM 0.2824 −0.2747 0.7669 0.2858 0.3106 0.0289
SDM −0.4528 0.8021 −0.3613 −0.7962 −0.4746
DDM −0.2812 0.0006 0.2656 0.3927
TDM −0.0849 −0.3237 −0.2419
LSR 0.6267 0.0822
%F 0.4911
*, **: statistically significant by t-test at 5% and 1%.
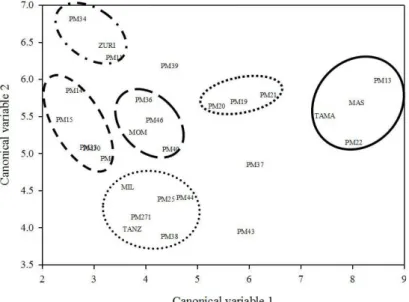
Figure 3: Dispersion of genotypes based on the first two canonical variables. MOM (Mombaça); TANZ (Tanzânia); MAS (Massai); MIL (Milênio); ZURI (BRS ZURI); TAMA (BRS TAMANI).
By means of the scores of the canonical variables, it was possible to evaluate the graphical dispersion (Figure 3) of the genotypes with respect to the two canonical variables with the highest cumulative variance. Thus, it was possible to group the 28 genotypes into six distinct groups, three of which could not be grouped with the others. Silveira et al. (2010) used multivariate analysis to group cultivars of warm-season forage grasses based on their morphogenetic and structural characteristics. According to the authors, cultivars Mombasa, Tanzânia, and Xaraés appeared as a related functional group, because of their similar morphophysiological characteristics, such as higher rates of appearance and tiller mortality as well as higher basal tillewring than the other cultivars.
Groups 1 and 2 encompassed individuals with better LDM performances. Thus, general characteristics of plant performance for leaf production may be indicative of a plant ideotype for environmental conditions in the Brazilian semi-arid and some transition areas, especially the Agreste. As general characteristics of these groups can be stated as greater height; total, leaf and stem yields; and medium percentage of leaves relative to other groups (Table 4). These results are due to the lower forage density, allowing the combination of higher mass and intermediate percentage of leaves in the same individual. However, low-bulk density material is unfavorable for consumption by animals. Thus, the agronomic profile of group 1 becomes more suitable for defining the ideotype, as it is characterized by greater wDENS than group 2. In addition to the features listed above, plants from group 1 were also characterized by high SDM, LSR and %F, and
medium values for DDM. Probably, the high SDM value is due to the larger size of these plants and also their greater growth rate.
Groups with poor performance for LDM were 4, 8, and 9. Group 4 was characterized by medium to tall-sized plants and high stem matter that yielded lower LSR, %F and bulk density. In contrast, groups 8 and 9 were characterized by lower-yielding plants with unfavorable LSR, intermediate bulk density, low stature, and, in group 8, large accumulation of senescent material.
Some studies have shown cultivar Massai to be a forage cultivar suitable for the conditions in northeast Brazil, owing to its greater resistance to drought, but it did not figure among individuals of superior LDM performance. Nevertheless, it is worth highlighting the greater hardiness of cultivar Massai, which can be defined by its lower fertility requirements, intermediate nutritive value, and high tillering capacity.
Genotypes PM13, PM22, and BRS Tamani were grouped together with cultivar Massai in group 6, which may exhibit characteristics of hardy plants, but of lower performance. This group was characterized by low yield of leaves and PLH, but high LSR and %F in the herbage mass (Table 4). These characteristics gave these genotypes the highest forage density in the study. In fact, cultivar Massai stands out for its high proportion of leaves, which is reflected in its LSR.
Despite the small number of genotypes evaluated, a lawrge number of groups were identified, owing mainly to genotypic variation among individuals. Variation is essential for selection and its presence in this study indicates that it is possible to identify superior individuals through a trait of such importance as leaf dry matter yield, and then trace the trait associated with the genotypes of interest.
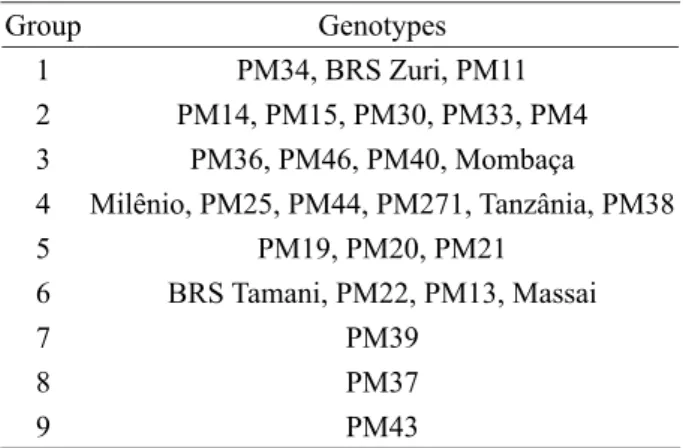
Table 3: Constitution of genetic groups based on graphic dispersion of canonical variables.
Group Genotypes
1 PM34, BRS Zuri, PM11
2 PM14, PM15, PM30, PM33, PM4
3 PM36, PM46, PM40, Mombaça
4 Milênio, PM25, PM44, PM271, Tanzânia, PM38
5 PM19, PM20, PM21
6 BRS Tamani, PM22, PM13, Massai
7 PM39
8 PM37
9 PM43
Table 4: Average value of the agronomic characters evaluated in Panicum maximum genotypes in the Alagoas Agreste according to the groups formed in the canonical analyses.
Group LDM (g) TDM (g) SDM (g) DDM (g) PLH (cm) LSR %F DENS (g/cm) 1 61.0 108.2 30.1 14.5 114.9 9.53 69.10 0.933 2 51.6 104.1 37.2 12.8 123.9 2.34 58.80 0.860
3 47.1 90.0 27.9 13.9 116.8 7.13 63.55 0.875
4 39.2 91.6 36.0 14.5 105.5 2.80 53.43 0.900
5 46.2 83.7 18.7 17.2 80.2 3.83 68.43 1.100 6 42.1 73.1 13.7 16.5 58.4 6.95 73.63 1.325
7 47.0 84.0 18.8 17.2 101.4 4.90 71.70 0.800
8 34.7 78.9 20.3 22.1 83.1 2.50 61.10 1.000
CONCLUSIONS
The genotypes differed in leaf dry matter yield, genotype PM34 being the most productive individual. Cultivars Massai, Mombasa, and Milênio showed intermediate performance in this characteristic, and cultivar Tanzânia showed poor performance.
These results indicate that there is potential for the selection of genotypes of P. maximum that are productive and adapted to the conditions of Agreste/Brazil.
The agronomic ideotype of plants adapted to the conditions of the Agreste should present, in addition to high leaf yield, tall size, high leaf percentage, high leaf:stem ratio, and intermediate values of bulk density of forage.
ACKNOWLEDGMENTS
The Brazilian National Council for Scientific and Technological Development – CNPq (Project 402168/2008-9) supported this project.
REFERENCES
ALMEIDA, M.L.; MUNDSTOCK, C.M.; SANGOI, L. The ideotipe concept and its use to increase cereal’s yield potential. Ciência Rural.28:325-332, 1998.
CRUZ, C.D. Programa Genes, Biometria. Viçosa: Editoria UFV, 2006. 382p.
CRUZ, C.D.; REGAZZI, A.J.; CARNEIRO, P.C.S. Modelos biométricos aplicados ao melhoramento genético: v.1. Viçosa: Editora UFV, 2004, 480p. DIAS-FILHO, M.B.; SIMÃO NETO, M.S.; SERRÃO, E.A.S. Cluster analysis for assessing the agronomic adaptation of Panicum maximum Jacq. accessions.
Pesquisa Agropecuária Brasileira. 29:1509-1516, 1994. DONALD, C.M. The breeding of crop ideotypes. Euphytica. 17:385-403, 1968.
EMBRAPA. Centro Nacional de Pesquisa de Solos. Sistema Brasileiro de classificação de solos (2ª edição). Rio de Janeiro: Embrapa Solos, 2006.
EUCLIDES, V.P.B. et al. Voluntary Intake of Three Cultivars of Panicum maximum under Grazing.
Revista Brasileira de Zootecnia. 28:177-1185, 1999.
FERNANDES, F.D. et al. Forage yield and nutritive value of Panicum maximum genotypes in the Brazilian
savannah. Scientia Agricola. 71:23-29, 2014. JANK, L.; RESENDE, R.M.S.; VALLE, C.B. Melhoramento genético de Panicum maximum. In: RESENDE, R.M.S.; VALLE, C.B.; JANK, L. Melhoramento de Forrageiras Tropicais. 1.ed. Campo Grande: Embrapa, p.55-87, 2008.
JANK, L.; VALLE, C.B.; RESENDE, R.M.S. Breeding tropical forages. Crop Breeding and Applied
Biotechnology.1:27-34, 2011.
JORGE, M.A.B. Characterization of a collection of buffel grass (Cenchrus ciliaris). Tropical Grasslands.
42:27-39, 2008.
PENNING, P.D.; PARSONS, A.J.; ORR, R.J. Intake and behavior responses by sheep to changes in sward characteristics under rotational grazing. Grass and Forage Science. 49:476-486, 1994.
RESENDE, M.D.V. SELEGEN-REML/BLUP.– Sistema estatístico e seleção genética computadorizada via modelos lineares mistos. Colombo: Embrapa Florestas, 360p. 2007
RODRIGUES, C.S. et al. Functional clusters of tropical forage grasses. Revista Brasileira de Zootecnia. 41:1385-1393, 2012.
SILVEIRA, M.C.T. et al. Morphogenetic and structural comparative characterization of tropical forage grass cultivars under free growth. Scientia Agricola. 67:136-142, 2010.
VAN DE WOUW, M. et al. Characterisation of a collection of perennial Panicum species. Tropical
Grasslands. 42:40-53, 2008.
ZABALA, J. M. et al. Variability in salt tolerance of native populations of Elymus scabrifolius (Döll) J. H.