Working
Paper
432
Another argument against negotiated grants: how
the bill for local corruption is distributed
Paulo Arvate
Dalila Figueiredo
CMICRO - Nº34
Working Paper Series
WORKING PAPER 432 – CMICRO Nº 34 • NOVEMBRO DE 2016 • 1
Os artigos dos Textos para Discussão da Escola de Economia de São Paulo da Fundação Getulio Vargas são de inteira responsabilidade dos autores e não refletem necessariamente a opinião da
FGV-EESP. É permitida a reprodução total ou parcial dos artigos, desde que creditada a fonte. Escola de Economia de São Paulo da Fundação Getulio Vargas FGV-EESP
Another argument against negotiated grants: how the bill for
local corruption is distributed
Paulo Arvate
São Paulo School of Business Administration – Getulio Vargas Foundation Center for Applied Microeconometrics (C-Micro/FGV)
and Dalila Figueiredo
Universidade Nova de Lisboa - Portugal
São Paulo School of Economics – Getulio Vargas Foundation Center for Applied Microeconometrics (C-Micro/FGV)
Abstract
The objective of this paper is to indicate another argument against negotiated grants (NGs): the possibility of local leaders seeking NGs in order to transfer the bill for local corruption to the whole country. Our argument is that local leaders cause this movement in their attempt to avoid corruption having a negative impact on their re-election chances when voters observe the corruption that exists. Since revenues and corruption have problems of reverse causality, we use random auditing (i.e., audits conducted by the Controladoria Geral da União [Office of the Federal Controller General]) as an IV of corruption to overcome this problem. Moreover, we reinforce the mechanism described with two placebos showing that both the audit per se and non-observed corruption (i.e., corruption of the next term considered in the current term) does not modify statistically the mix of revenue in the budget. We also observe that governors facing elections that are more competitive allow for an increase in transfers that are negotiated with corrupt local leaders. We performed our investigation on the years between 2005 and 2011 using Brazilian local governments where the local leaders (mayors) are elected in a competitive system, have autonomy to define the budget, and the municipal accounting system offers data about NGs with higher levels of government.
Keywords: Tax Revenue; Negotiated Grants; Corruption; Local Government JEL code: H70; H77; H83
Acknowledgements
We would like to thank Klênio Barbosa, Sandro Cabral, Marcos Nakaguma, Victor Matos, Enlinson Mattos, Susana Peralta, André Portela, Sergio Mittlaender de Souza, and Jose Tavares for their insightful and constructive criticism. This paper is an extension of Dalila Figueiredo’s Master’s thesis “Corruption: Who pays for the bill”, in the Nova School of Business and Economics - UNL and the São Paulo School of Economics – FGV.
1. Introduction
Negotiated grants (NGs) between different levels of government is a reality in many countries (e.g., Germany, France, Canada, Australia, US, and Brazil). Although political economy literature shows how important NGs are in exchange for political support (Cox and McCubbins, 1986; Lindbeck and Weibull, 1987; Dixit and Lodregran 1995, 1996), public finance literature considers that the NG either has to be revised to provide transparency (see the report from Spahn, 2012 for the OECD on Intergovernamental Grants) or has to be reduced or eliminated altogether, given the consequences for the country as whole of a (vertical/horizontal) fiscal imbalance (Kornai, Maskin, and Roland, 2003).
The objective of this paper is to add another argument against NGs: the possibility that a corrupt local leader has for distributing the bill for local corruption to all the voters in the country using the NG mechanism. Political economy literature has no investigations that consider this mechanism.
We assume that the government expenditure bill is paid differently at the local and federal levels. This occurs because governments pay their bills considering the political cost of each source of revenue on the budget (Niskanen 1979; Sobel 1998; Geys and Vermeir, 2007).1 Unlike federal governments, local governments receive revenue from taxes and grants. Taxes are fully paid by local voters and grants are funded by federal taxes, thus collected from more than one municipality. So this “mix” of revenues available to pay any local expenditure ends up distributing local costs to voters from the municipality and beyond that specific locality.
In this paper, the association of “mix” budgets and corruption is inserted into a competitive electoral model (Persson and Tabellini, 2000). We believe that local leaders, by
1 Federal government revenue also has different electoral costs. However, the electoral cost of grants to local
voters is insuperably lower when compared to any cost since the voters outside the locality pay a large part this bill.
trying to avoid the negative impact of corruption on future elections, modify the mix of local revenues using the different political costs of taxes and grants to their own benefit. This means that when their voters observe the existence of local corruption (Finan and Ferraz, 2008), local leaders seek more NGs and decide to raise fewer taxes in the local budget: this mix of revenues is different from that defined at the electoral moment when the politician was elected. The idea of distributing local costs deliberately to other voters via grants, is not new (Kornai, Maskin and Roland, 2003). When considering the expenditure side, the idea that corruption also looks for the best way to develop is not new either (Mauro, 1998).
To check our idea, we need a country with different levels of government (local and federal), in which the local leader has budgetary autonomy (i.e., able to choose the expenditure and type of revenue) and the electoral system is competitive (Persson and Tabellini, 2000). Brazilian local governments allow this for three main reasons: (i) municipal government budgets are composed of different revenues (municipal taxes and state and federal grants) and municipalities have access to grants that are either established by law or negotiated; mayors are also allowed to adjust this composition; (ii) mayors are also allowed to decide which contracts to sign for a given expenditure, following the federal public procurement law, 8666/1993; and (iii) although Brazil has a multi-party system, the actual number of competitors in majoritarian local elections is mainly restricted to two candidates (i.e., it is easier to incorporate this issue in the competitive model developed by Persson and Tabellini, 2000). Additionally, Brazil is a democracy with more than five thousand municipalities and voting is mandatory for everyone between 18 and 70 years old who is literate (Article 4 of the 1988 Constitution), which makes the control of local politicians by voters robust. Moreover, the Controladoria Geral da União (CGU), a Federal Government organism, performs audits in order to track any irregular behavior. These audits allow a direct variable of corruption to be
constructed, in accordance with Brollo, Naccicini, Perotti and Tabellini (2010), Ferraz and Finan (2011) and Arvate and Tavares (2014). Therefore, we overcome the disadvantages of working with a perception of corruption instead of a more direct measure.
This investigation brings with it some technical problems of endogeneity. We are trying to address the issue of whether corruption influences the volume of taxes raised and the NG that is defined by the local politics. However, the volume of taxes and grants may also affect the mayor’s decision about either the level or the existence of corruption. To overcome this issue, we use an IV strategy where the instrumented variable is the number of observed cases of corruption and the instrument variable is the dummy variable of the municipality being audited, or not, by CGU. This choice is totally exogenous since the decision is made randomly by way of a lottery.
Although our target is revenue mix, we carry out our investigation using independent sources of revenue (taxes and grants). Our results show that corruption reduces local tax revenues, but our complementary exercise does not accurately show evidence as to whether this is a movement on the statutory tax rate2 or the tax base. As far as concerns grants, corruption leads to an increase on seeking by NG, (i.e., mainly the ones negotiated with the respective state government). To finalize the development of our mechanism, we tried to understand the reasons that connect state governments (i.e., governors) to corrupt local mayors. In those states where the governor runs to a second round of elections, which means a more competitive election, we observe that the corrupt local leader gets more state-NG; basically, a question of political support.
In our main exercise, we consider the number of corruption cases as the observed corruption. However, the information on corruption is zero in two situations: when the CGU
investigated and found no cases, and when we do not have information on those municipalities since they were not audited; therefore we assumed that if they were not audited, there is no other way of observing corruption cases. Both the zero corruption cases investigated and zero information on corruption must lead to the same effect on our exercise: the local leader does not change the mix of local revenue.3
We do two exercises with a placebo to show that the change in revenue mix depends on information close to the voters. We carry out a first exercise to check if non-disclosed corruption affects the revenue structure defined by the local leader in a competitive equilibrium. We observe that the future (observed) corruption of municipalities randomly selected in the 2009-2011 period does not have an impact on the revenue variables in the 2005-2007 period (i.e., a term before). This means that future corruption that is unknown by voters does not change the present structure of revenue. Second, we carry out a second exercise showing that the channel by which the revenue structure is defined is corruption itself, not auditing. There is no difference in revenue structure between audited and non-audited municipalities.
Our results contribute to the literature since they show that local leaders can modify the mix of revenues from tax to NG (the electoral cost of each is different) when the voters observe corruption in a competitive political system. It occurs because local leaders try to reduce the direct and negative impact of corruption on the probability of their re-election. The literature only shows the direct impact of corruption: politicians are punished electorally by corruption. Moreover, the literature on the effect of decentralization on corruption does not show how the corruption bill is paid if there are different electoral costs linked to different
3 We did two exercises: one controlling for cases of mismanagement and another without. The results are the
sources of financing (see Albornoz and Cabrales, 2013; Fan, Lin and Treisman, 2008; Fisman and Gatti, 2002).
The remainder of the paper is organized as follows. Section 2 presents the logic of a competitive electoral model incorporating the effect of corruption on the structure of local revenue. Section 3 provides the institutional background of Brazil, its tax system and anti-corruption program. We describe the methodology to measure anti-corruption in Section 4. Section 5 presents the data used and the constructed variables. The empirical strategy is presented in Section 6 and the results in Section 7. Section 8 shows the main conclusion of our investigation.
2. Corruption influencing the mix of local revenues in a competitive electoral model
Persson and Tabellini (2000) developed an electoral model of competition with two parties (i.e., based on Downs 1957; Hotteling, 1929) in which the incumbent or challenger, in order to win the election establishes the fiscal policy (i.e., tax or expenditure) preferred by the medium-voter in a majoritarian system. A large part of the model is developed in an environment where fiscal policy is defined in a balanced budget4, following the medium-voter´s preference for a fiscal policy with either expenditure or revenue. Another relevant characteristic of the model is that between the electoral moment and execution of the fiscal program, a share of resources is lost due to agency problems:5 special-interest groups,6 corruption,7 and bureaucracy. 89
4 They investigate also the distributive effect of voter preferences on the tax structure (the
medium-voter is poor) and a model including the possibility of public debt with two periods. See chapters 12 and 13
5 Rents emerge in the electoral competition model because voters have problems with information. Lack of
information is an important dimension of enforcement (i.e. it provokes a reduction in rents) for the good functioning of the electoral system (e.g., Costas-Pérez, Solé-Ollé and Sorribas-Navarro, 2012 and Ferraz and Finan, 2008)
6 See Buchanan and Tullock (1962), Olson (1965), Weingast, Shepsle, and Johnsen (1981) 7 See Bardhan (1997), Shleifer and Vishny (1999)
8 See Niskanen, (1971, 1975)
Although the model was not prepared considering the dimension of local government, it can be adapted to incorporate how local politicians choose the optimal mix of revenue in a situation in which they are elected by local voters and have autonomy to build their budget.
Unlike federal governments, local governments typically have two types of revenue: that paid fully by local voters (taxes) and that paid partially by local voters (i.e. transfers that are shared with different voters around the country).10 Indeed, if this argument is valid, the composition of revenue mix has different electoral costs for local voters, considering that the electoral cost of taxes is higher than the cost of grants.11
If a local government is unable to build its budget fully with NG (i.e., federal resources have to be divided by all municipalities in the country12) according to the model, as before, medium-voter preference will define the fiscal program, including the optimal mix of revenues, and will elect the politician who satisfies their preference.13
The next step is to find the rationale in the literature to understand how corruption (a problem of agency) can modify a revenue structure already established at the electoral moment. The most important result in the literature for sustaining our argument is that corruption observed by voters reduces the electoral chances of the incumbent (Finan and Ferraz, 2008).14
10 Higher governments may establish rules (i.e., legislation considering income per capita, population), or negotiate
politically, or a mixture of both reasons to make transfers.
11 There is a long tradition in literature investigating the electoral cost of taxes for politicians. See, for example,
Niskanen (1979), Sobel (1998), and Geys and Vermeir (2007)
12 There is a long debate in literature showing the political relationship between different levels of government
in the allocation of resources See, for example, Cox and McCubbins, 1986; Lindbeck and Weibull 1987; Dixit and Londregan 1995, 1996.
13 The skill of the politician is an important dimension in the electoral process for different issues, such as the
quality and supply of public goods, the capacity to negotiate more transfers, etc. See, for example, Besley 2006, Besley and Smart 2007, Bardhan and Mookherjee 2006, Aidt and Shvets 2010.
14 We carry out a probit exercise to investigate the correlation between corruption and reelection. The result is
Again, if this result is valid, corruption observed by voters reduces the electoral chance of the incumbent and, in our understanding, more NG and less tax revenue attenuate the negative electoral impact of corruption (i.e., two opposite effects on the probability of re-election). The local leader can try to reinforce the effect of the composition mix in order to be less costly for the voters and avoid the negative impact of the observed corruption.15 However, we believe that the effect of corruption is dominant in the effect of revenue mix on the probability of the reelection of the local leader.
Based on the reasons presented, we are interested in knowing if observed corruption modifies the mix of revenue (i.e., with more NG than taxes). It is this mechanism that we will investigate empirically.
It is important to mention two results from related literature, which can help sustain the argument developed. First, although it is interpreted as a problem of commitment, the history of local governments transferring local costs to higher levels of government is not new (Kornai, Maskin and Roland, 2003). Corruption is a local cost for us. NG are used to share this bill with all the voters in the country. Second, strategic choices made by politicians to ease corruption in the public environment is not new either. Mauro (1998) explored this situation with regard to expenditure.
3. Institutional Background
Brazil has 5,565 municipalities, 26 states and one federal district. It is a federal republic with a federal government, state and municipal governments. These three tiers have both administrative and fiscal autonomy that is governed by the 1988 Federal Constitution (CF/1988).
15 Corruption that is not observed by voters does not reduce the electoral chances of the incumbent (Finan and
As far as concerns the Brazilian electoral system, elections are held every two years. Elections for the president, governor, federal and state deputies and senators occur in the same election period, every four years, and mayors and councilors are elected simultaneously for a four-year term, interspersed with the previously-mentioned elections. According to the current Brazilian electoral law, a two-round election occurs when one of the candidates receives less than 50% +1 of the votes. This is only available for presidential, governor and mayoral elections in municipalities with more than 200,000 voters. Everyone aged between 18 and 70 who is literate is obliged to vote. Personal re-election to the executive branch (president, governor and mayor) is allowed only once (consecutively).
Municipalities are responsible for the provision of a large share of public goods and services, such as education, health, social assistance and infrastructure. Municipalities have three sources of revenue: (i) fines and taxes; (ii) mandatory grants from the federal and/or state governments settled by law; and (iii) voluntary or negotiated transfers, usually conditional upon the delivery of a social program, a good or investment.
Municipal tax revenues come mostly from the Urban Building and Land Tax (IPTU –
Imposto Predial e Territorial Urbano) and Service Tax (ISSQN – Imposto Sobre Serviço de Qualquer Natureza), which are determined at the local level by both executive and legislative government
branches. There are two funds financing mandatory grants. Federal government grants are funded by revenue from two income taxes (IRPF – personal income tax and IRPJ – corporate income tax) and an industrialized products’ tax (IPI – Imposto sobre Produtos Industrializados).16 State government grants are financed by a tax on the circulation of goods and services (ICMS – Imposto sobre Circulação de Mercadorias e Serviços).17
16 Law number 5172/1996; Decree Law number 1881/1981; Complementary Law number 91/1997 and
106/2001
17 Like federal governments, state governments have voluntary (negotiated) and involuntary (settled by state
Voluntary grants (NG) are financial resources resulting from an agreement, application, or proposal with the purpose of providing public services or goods, supporting non-profitable institutions or supporting public investments. Grants may have different time-schedules depending on the project being financed. Thus, depending on this, grants may be released in instalments, or all at once.18 The majority of these funds go to three main sectors: Education, Health and Social Development and the Fight against Hunger. With regard to educational programs, the funds are mostly directed to facilities, school material and food distribution. In the health sector, funds go to disease control platforms, family health monitoring, medication and equipment. Finally, grants aimed at social development and the fight against hunger support water storage systems and expenditure on administrative support for developing the Bolsa Família [family assistance] program.19
Corruption is a serious institutional flaw in Brazil. According to the Global Corruption Barometer 2013, 81% of Brazilian respondents perceive political parties as one of the most corrupt institutions in the country. Brazil ranked 72 out of 177 on the scale of perceived corruption in 2013. Despite, or motivated by the public opinion, in 2003 the Federal Government created the Controladoria-Geral da União – CGU [Office of the Federal Controller General], a federal organism for ensuring fiscal control, audits and fighting corruption. It answers directly to the President and helps ensure transparency and the correct use of public wealth. Besides the CGU, there is a federal accounting court, the Tribunal de Contas da União –
TCU, which supports the National Congress and enforces accounting, finance and budget
oversight of the federal government, states and municipalities.
18 The federal government establishes the criteria for selecting funded programs or policies.
19 Bolsa Familia is one of the most important social programs in Brazil. It aims to reduce poverty by providing a
conditional cash transfer to poor families in exchange for school attendance and health care of their children. The municipalities receive resources to provide administrative support for the program (i.e., registration, etc.). The management of the program is ruled by Law number 10.836/2004 and Decree number 5.209/2004.
Due to a partnership between these two institutions, every year the CGU performs audits in randomly selected municipalities in order to evaluate how federal funds are being used and if they are serving the established purpose. Municipalities to be audited are selected by way of a lottery that is held every month at Caixa Econômica Federal, a federal bank, in Brasilia, in the presence of representatives of different parties, the press and civil society.
CGU audits the previously mentioned voluntary or NG and evaluates the regular
application of the resources, the compatibility between the project and execution, the regularity of the information that is registered and whether the established deadlines are met. Direct complaints are also taken into consideration. After the audit, TCU analyses the report and if irregularities are found, those responsible for the agreement and the intermediary parties are obliged to suspend the grant until further explanation. If this is not accepted, the municipality has to return the amount corresponding to the damage caused. The results of these audits are made public and accessible online.
According to Ferraz and Finan (2011), the most frequent forms of corruption at the municipal-level are frauds in procurement processes, the diversion of funds, over-invoicing goods and services and the appropriation of public funds by politicians.
4. Measuring Corruption and Mismanagement
CGU reports include the total amount of federal funds audited and the irregularities found per
sector (Education, Health, Social Development and Fight against Hunger, Sports, Agriculture, etc.) and action (support for food distribution in schools, the purchase of medical devices, etc.).
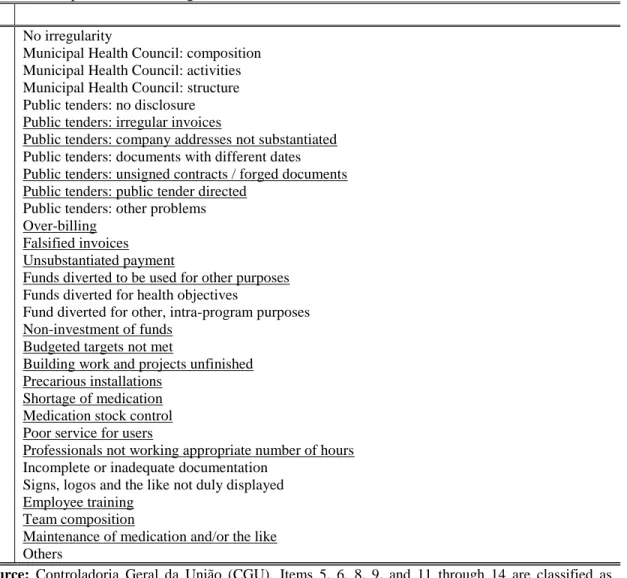
Ferraz and Finan (2011) codified the irregularities into several categories of corruption and Arvate and Tavares (2014) completed the first classification by including cases of mismanagement (see our classification in Table 1). In the end we re-classify each one them as
corruption and mismanagement. We carried out our investigation using all the reports from 2005 to 2011.
Insert Table 1 here
Note that some of the items in the table above are specific to the health sector. In this paper all sectors were evaluated. Consequently, some parallels were drawn in order to cover all the other sectors. For instance, food stock control was classified in the same way as medication stock control; shortage of school material was classified as shortage of medication and so on. 20
Education, Health and Social Development and the Fight against Hunger are the most representative sectors receiving voluntary transfers. The most common irregularities found in education is the misappropriation of food and material. In health programs, irregularities were typically a lack of medication, non-investment in machinery, and undue expenditure on wages and vacations. Finally, in the last sector, the most common irregularities were the misallocation of the Bolsa Família benefit to families not eligible for the program (i.e., the local government receives support and funds to organize the dataset of beneficiaries) and the non-construction of water storage facilities.
Measuring corruption and mismanagement following this methodology allows for the application of a direct measure of corruption. Therefore, using a perception measure is avoided, which is an advantage since perception of corruption can be easily misleading.
5. Data
All the data were collected at the municipal-level. The database comprises data about 5,527 Brazilian municipalities21 between 2005 and 2011. In these years, 1,114 municipalities were
20 There are some cases where the classification might be ambiguous and it can be either a case of corruption or
mismanagement, for example item 25 “Incomplete or inadequate documentation”. However, the results do not change when testing alternative measures in these cases.
audited. The year 2012 could not be included since there was a reduced number of CGU reports, the source of data about corruption and mismanagement.
Data on municipal tax revenues, grants settled by law and total agreed grants is available on the National Treasury (Tesouro Nacional) website.22 The municipal tax revenue variable is the sum of the IPTU (Urban Building and Land Tax) and ISSQN (Services Tax). The released federal grants variable is the sum of the value of all the individual agreements of a municipality available on the CGU website.23
Data on municipal GDP and population is taken from Ipeadata. 24 Municipal GDP is in real values, deflated by the IGP-DI, with 2000 as the base-year. Political and electoral data are available on the Superior Electoral Court (Tribunal Superior Eleitoral – TSE) website25 and include the level of education and gender of mayors. These variables capture political preferences, planning and strategy, and so are important control variables.
Brazil is divided into 5 regions, which are extremely different economically and culturally. Using the definition from Instituto Brasileiro de Geografia e Estatística (IBGE), we placed each municipality into one of the 5 regions: North, Northeast, Center-West, Southeast and South.
From the Instituto Nacional de Estudos e Pesquisas Educacionais Anísio Teixeira (INEP) [Anisio Teixeira National Institute of Educational Studies and Research]26 was took the number of enrolled children from the 1st to 8th grade27 as a proxy for the provision of educational services. Infant mortality per 100,000 inhabitants was the proxy chosen for health
22 htttp://www.tesouro.fazenda.gov.br/ 23 htttp://www.cgu.fazenda.gov.br/ 24 htttp://www.ipeadata.gov.br/ 25 htttp://www.tse.gov.br/ 26 htttp://www.inep.gov.br/
provision and is available in Datasus,28 from the Ministry of Health. Finally, in order to control for the provision of goods and services in the social development and fight against hunger (SDFH) sector, we used the number of beneficiaries of Bolsa Família in each municipality. These latter data are available in Ipeadata.
Insert Table 2A and 2B here
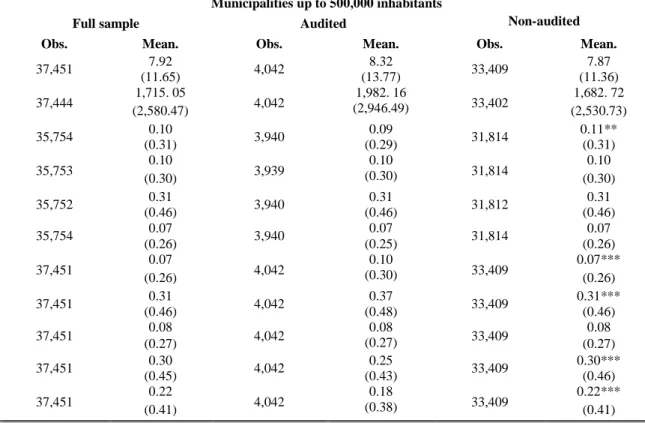
Tables 2A and 2B show the summary statistics of the described variables. There are three divisions for municipalities up to 500,000 inhabitants (98% of the Brazilian municipalities): all municipalities from the sample, and audited and unaudited municipalities.
The full sample contains 37,471 observations, which correspond to information from 5,353 municipalities over a 7-year period. As shown in Tables 2A and 2B, not all the variables have 37,471 observations. Basically, the information on mayors, schooling and gender contain only 35,750 observations. The combination with other missing information only allows us to perform the estimations with 35,095 observations.
It is interesting to show that municipalities depend greatly on grants from state and federal government, as established by law. On average, these represent 19% of the municipal GDP. On the other hand, NG and tax revenues represent much less, at 0.4% and 0.55%, respectively.
When observing the number of corruption and mismanagement cases detected in the
GGU reports, special attention needs to be paid. Since only 9.15% of municipalities were
audited and assuming these audits are the only way to observe corruption, the other municipalities were assumed to have 0 cases of corruption. Of the audited municipalities, only 3.34% do not have any corruption events. When observing only those municipalities that were audited, the average number of cases of corruption is 3.01 events. Considering that the great
majority of the audited municipalities have corruption cases, we observe that the composition of revenues (tax revenue by voluntary transfers) is higher in unaudited municipalities ((17.7+10.24)/4.86=5.7489) than in audited municipalities ((19.96+10.01)/5.63=5.3232).
We check whether there is a statistical difference in the observed variables (public finance variables, and the geographic and mayors’ characteristics) between audited and unaudited municipalities. From all the variables presented in Tables 2A and 2B, and when comparing audited and unaudited municipalities, few of them show differences between the two groups at the 5% level of significance: the municipal GDP, grants by law, and mayors who only have an elementary school education (the number for unaudited municipalities is higher). The other variables are not different at the 5% level. Thus, there is no outstandingly significant difference between audited and unaudited municipalities.
The difference exists, however, when we repeat the exercise comparing Brazilian regions. Except for the center-west region, there is statistically significant difference at the 1% level between the two groups of municipalities.
6. Empirical Strategy
Our goal is to estimate the causal effects of the existence or level of corruption on public finance outcomes (Total Voluntary – NG and Municipal Tax Revenues). In general, this type of exercise is plagued by endogeneity issues because, NG and tax revenue can mainly explain either the level or the existence of corruption in the municipality. Specifically with regard to NG, one can imagine an environment in which the existence and number of federal government agreements between the federal government and municipalities (i.e., NG) can induce either the existence of corruption, or the level is assumes. When there is no corruption, new federal resources in the municipality can stimulate its emergence. On the other hand, when there is corruption in a municipality, new funds may increase the existing corruption.
Reverse causality is one clear problem. Thus, the main challenge of this exercise is to find a credibly exogenous variation for both the level and existence of corruption in the municipality, simultaneously. In order to eliminate this problem, we use the choice of municipality to be audited as the instrument that reveals the level or existence of corruption in the municipality. The selection of the municipalities audited by the CGU is a random procedure.
Formally, we obtain our results following a system of equations. The first stage regression for our investigation is
𝐶𝑖,𝑡= 𝛼0+ 𝛼1𝐴𝑢𝑑𝑖𝑡𝑒𝑑𝑖,𝑡+ 𝜃′𝑋𝑖,𝑡+ 𝛼2𝐸𝑙𝑒𝑐𝑡𝑖𝑜𝑛_𝑌𝑒𝑎𝑟𝑡+ 𝛼4𝑅𝑒𝑔𝑖𝑜𝑛𝑎𝑙 𝐷𝑢𝑚𝑚𝑖𝑒𝑠𝑖+ 𝜇𝑖+ 𝜖𝑖,𝑡 [1] where Ci,t is the number of observed events of corruption per municipality i in time t;29 Auditedi,t
is a dummy variable, which assumes the value 1 for the audited municipalities and zero otherwise; Xt,i is the vector of municipal control variables per municipality i in time t;
Election_Yeart is a dummy variable which assumes the value 1 for the electoral year (2008) and
zero otherwise; Regional Dummiesi are regional dummies (north, northeast, center-west, and
south – southeast is in error) with a value equal to 1 if the municipality is in a specific region, and zero otherwise; μi is the municipal fixed effect; and εi,t is the error term.
The control variables are: (i) the number of mismanagement events;30 (ii) the municipal grants received and defined by law; (iii) population; (iv) municipal GDP; (v) enrollment from the 1st to the 8th grade as a proxy for the provision of public goods in education; (vi) infant mortality as a proxy for health provision; (vii) the number of Bolsa Família beneficiaries as a proxy for SDFH provision; (viii) the mayor’s level of education (elementary school, high school, and tertiary education – dummy with a value equal to 1 if the mayor has a specific level
29 We also investigate having or not having corruption (i.e., 1 with corruption, and zero otherwise). The results
are the same and can be requested from the authors
30 We re-did all main results (see the supplementary material) where mismanagement is excluded from the
controls if anyone considers corruption and mismanagement to be orthogonal. Moreover, we carried out an exercise to modify the classification of corruption and mismanagement also. For all situations, the main results are the same. The results of the exercise with a modified classification can be requested from the authors.
of schooling, and zero otherwise); and (ix) gender of mayors (dummy with a value equal to 1 if the mayor is a woman, and zero otherwise).
A dummy variable for the year 2008 was included since it is the election year in our sample. The rationale for this decision is that in election years the behavior of the incumbent might change, mainly as far as concerns taxes and grants.31
The second stage regression is:
𝑃𝐹𝑖,𝑡= 𝛽0+ 𝛽1𝐶̂𝑖,𝑡+ 𝜃′𝑋𝑖,𝑡+ 𝛼2𝐸𝑙𝑒𝑐𝑡𝑖𝑜𝑛_𝑌𝑒𝑎𝑟𝑡+ 𝛼4𝑅𝑒𝑔𝑖𝑜𝑛𝑎𝑙 𝐷𝑢𝑚𝑚𝑖𝑒𝑠𝑖+ 𝜇𝑖+ 𝜗𝑖,𝑡 [2] where PFi,t are the variables of Public Finance used in the exercise (the Total Tax Revenue and
the Total NG) per municipality i in time t; Ci,t is the predicted value of the number of observed
corruption events from the first stage regression; ϑi,t is the error term.
Our parameter of interest in our main results is 𝛽1.
7. Empirical Results
7.1. How the corruption bill is paid at the local level
Recalling the hypothesis previously stated, local leaders are guided by medium voter preferences. Therefore, the fiscal strategy is developed considering the different electoral costs of each decision. If local voters observe corruption, they will punish the corrupt politician electorally. In order to reduce the negative impact, politicians adjust the revenue structure by seeking more NG and decreasing taxes. As a final result, corruption generates a fiscal approach that relies more on grants and less on taxes, consequently charging the corruption bill to national taxpayers instead of focusing it on local taxpayers. Therefore, this section will show that local leaders do indeed reduce taxes and increase grants when corruption is observed.
31 Considering that Complementary Law 91/1997 and Supplementary Law 106/2001 establish the rules for
unconditional federal grants to municipalities and the amount of the grants is a function of the population size of the municipalities, we carry out a supplementary exercise with the population brackets established in the law: up to 10,188; 10,189-13,584; 13,585-16,980; 16,981-23,772; 23,773-30,564; 30,565-37,356; 37,357-44,148; 44,149-50,940; 50,941-61,128; 61,129-71,316; 71,31781,504; 81,505-91,692; 91,693-101,880; 101.881-115,464; 115,465-129,048; 120,049-142,632; 142,633-156,216; and Above 156,216. We observe no difference in the results. These results can be requested from the authors.
Our first investigation is on tax revenues. As far as concerns the effect of corruption on tax revenue, we tested it contemporaneously (t) and with a one-year lag (t+1). The rationale for this decision is that “new taxes” cannot be created by local governments and applied in the same year. The 1988 Constitution establishes that local governments can change taxes and exempt residents, but cannot create a new tax and apply it in the same year.
We test the impact of corruption on both total tax revenue and the proportion of tax revenue to GDP.
Insert Table 3 here
The first-stage results, at the end of the table, show that randomly audited municipalities have more corruption than unaudited municipalities. The F-statistic (excluding instruments) is also significant.
Both results (contemporaneous and with a lag) show that corruption reduces tax revenues (i.e., 1.867 thousand Reais contemporaneously and 1.259 thousand Reais when lagged).32 We would like to know which effect is dominant for determining revenue: changes in the statutory tax or in the tax base. We do not have information on both. However, in the last two columns of Table 3 we have a proxy of the actual tax rate: total municipal revenue as a share of municipal GDP (i.e., the percentage of income the municipality actually pays in taxes). The results suggest that the impact of corruption on tax revenue can come from the rate of tax that is applied. It is not significant, but the estimate point is negative. Thus, the local leader may be reducing taxes for local voters.
Additionally, in Table A1 in the appendix, we show the effect of corruption on the two main municipal taxes: IPTU and ISSQN. Over and above observing the individual effect on different taxes, this result can reveal a difference in the movement of the choice of the local
leader given the possibility of change in the tax base. IPTU is less sensitive to corruption than
ISSQN because inhabitants and their properties (Urban Building and Land) are less mobile
than firms (offering services) at the municipal level. In an environment with observed local corruption, firms can leave the municipality and affect the statutory rates for voters. In this case, we expect a lower effect of corruption on IPTU than on ISSQN if the IPTU tax base is less mobile than the ISSQN tax base. That is exactly what we observe in the data. The reduction in the most mobile tax base is higher. So tax base changes can have an influence on the choice of statutory rates for voters, as decided by the corrupt local leader. The corrupt local leader may establish lower municipal taxes, by focusing on where the tax base is probably more sensitive (ISSQN).
Our second investigation is into grants. In order to evaluate the impact of observed corruption on NG (i.e., grants resulting from agreements), the analysis was divided according to the source of the transfer.
Insert Table 4 here
The effect of corruption on the total amount of voluntary transfers is positive; however, when separated into federal and state grants, one can see in Table 4 that the estimator is positive for the two of them, with only the increase in state grants being statistically significant.
It is important to remember that audits are performed precisely on federal grants, and when corruption is detected, transfers are suspended or cancelled. The federal government is then more cautious and does not encourage contracts with corrupt municipalities. Although not putting an end to the corruption problem, the CGU audits and TCU are working as impediments to corruption, or at least to some ways of financing it. In addition to the voters, the federal government institutionally acts as an extra door closed to corrupt politicians.
But corruption increases the NGs with the respective state government. The result suggests that the corruption bill is being charged to state voters rather than only to local voters.
Therefore, following our argument, the presence of corruption observed by local voters is determining that the revenue structure changes, with lower taxes and more grants when compared to the situation established at the electoral moment.
We carry out two placebo exercises to investigate the importance of information close to voters.
7.2. Placebo: Local Voters lack information about corruption
We assume the value zero for corruption and mismanagement events in our main investigation for two situations: when the CGU´s auditing finds no evidence of corruption and when the municipality is not audited. In our main investigation, this assumption does not interfere in our analysis since there is no difference between having no cases of corruption and having no information. It is expected that both situations do not lead to a change in the leader’s fiscal planning of the revenue structure. The information and reaction of voters determine the behavior of local leaders. To corroborate this argument, we do an exercise showing that disclosed corruption does not lead to any change in the fiscal variables.
We build a sub-sample (i.e., almost 2,550 observations)33 containing only randomly selected municipalities for the period 2009-2011. In this sub-sample we have corruption and mismanagement information for all municipalities. We exclude the electoral year 2008 from our exercise. Since we have fiscal information for the same municipalities for the 2005-2007 period, we simultaneously join the fiscal information from the 2005-2007 period with the information on corruption and mismanagement not yet disclosed for the 2009-2011 period to
observe if the decision of the local leader is not affected. If the information is relevant, our exercise should show changes in the fiscal variables.
Our results are shown in Table A.2, in the appendix. Except for the lagged tax variable, which is significant only at 10%, all the other variables used in the main results are not significant. Therefore, the existence of corruption per se that is not disclosed to local voters, does not lead to a change in the fiscal policy.
7.3. Placebo: auditing information per se modifies the structure of revenues
The final investigation is relevant to check if the auditing itself (i.e., a random choice) determines the fiscal change led by the mayor. In this case, we eliminate the importance of corruption from the process.
We carry out an exercise to investigate if audited municipalities have different fiscal variables when compared to unaudited municipalities.34 Our results (Table A.3 in the appendix) show that this is not the case. Except for the positive effect on total grants (at a 10% level of significance), all the other results are not significant. The fiscal variables considered in our main results are no different for audited and unaudited municipalities.
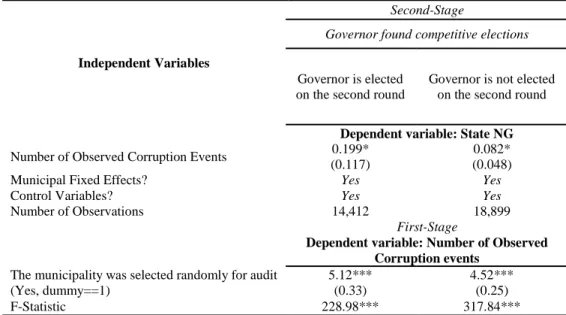
7.4. The importance of governors35
To finalize the argument about our mechanism, the next logical step is to understand under what conditions the state government allows NG to go to corrupt local municipalities. There is a long debate in the literature showing how political parties allocate resources among different levels of government to maximize their electoral prospects (Cox and McCubbins, 1986; Lindbeck and Weibull 1987; Dixit and Londregan 1995, 1996). We investigate some
34 We excluded the number of mismanagement cases as a control variable here.
possibilities regarding the electoral and governmental relationship between mayors and governors. 36
Insert Table 5 here
In those municipalities where the governor runs to a second round (the governor is facing a more competitive election), we observed more state-NGs than when the governor is directly elected in the first round. Although the estimate point is different, there is no statistical difference. The difference between the estimate points (0.199 vs. 0.082) suggests that if the governor needs greater electoral support during competitive elections, he/she may accept an exchange of favors (support) with corrupt mayors by way of NG. Therefore, if there are no legal restrictions, political relationships between different levels of government are a possible door leading to corruption payments.
7.5. The distinctive behavior of lame duck mayors
Although the average degree of corruption of lame duck mayors (i.e., mayors who are in their last term in office considering Brazilian legislation) is not statistically different from mayors who can stand again in the next term,37 we try to re-did the main investigation to check whether this group of (lame duck) mayors behaves differently from the other group. We do not have conclusive evidence. We need a future research about it.
8. Conclusions
This work showed another argument against negotiated grants: the possibility of corrupt local leaders have of distributing the bill for corruption to all voters in the country by seeking NGs for their municipality. Unlike federal governments where all the sources of expenditure
36 We repeated the same analysis comparing municipalities where (i) the Mayor’s party is in the electoral
Governor’s coalition; (ii)the Mayor and the Governor elected are in the same party and (iii) the Mayor, Governor, and President elected are in the same party. We did not obtain any significant results, however these can be provided by the authors on demand.
37 Corruption is 0.31 (s.d., 0.02) for reelected mayors and 0.28 (s.d., 0.01) for elected mayors. The general
financing are fully paid by national voters, local governments may finance their expenditure from different sources which have different “weights” on local voters (i.e. different political costs). Taxes are paid fully by local voters and grants are not. Thus, for each source of financing, there is a different electoral cost. Taxes have an electoral cost that is higher than grants. In a competitive electoral system, local leaders choose the structure of revenue (taxes or grants) considering the medium-voter´s preference.
In an environment where local leaders have budgetary autonomy and may negotiate grants with superior governments, corruption can promote a revenue structure with more grants than taxes when compared to the structure established at the electoral moment.
Our investigation was performed with local governments in Brazil between 2005 and 2011 since they fulfill a set of important criteria (i.e., a competitive electoral system, budgetary autonomy, and sources of revenue with different electoral costs). Our results show that corruption reduces tax revenue and increases (voluntary- NG) grants in the revenue structure. These grants are negotiated with other spheres of government (federal and state). Corruption does not significantly affect federal grants because our measure of corruption is reliant on
CGU audits. Corruption is observed in the contracts between local and federal governments
that are audited; the federal government is unable to continue with the contracts legally if corruption is observed. However, corruption increases state-NGs. This result suggests that the local leader splits the corruption bill with state voters. The distribution of these costs by local governments to other levels of government is found in literature (Kornai, Maskin, and Roland 2003).
Finally, we observe that this result is stronger in municipalities where state governors face more competitive elections (i.e., they have to go to a second round in order to be
re-elected). Our intuition for this result is that an exchange of political support may exist between mayors and governors.
Additionally, we carry out two placebo exercises to show the importance of information of corruption close to voters. In the first one, we show that corruption only affects revenue mix when it is disclosed. Future corruption (not yet disclosed to the voters) detected in CGU audits in randomly selected municipalities between 2009 and 2011 did not affect the revenue structure between 2005 and 2007. In the second exercise, we show that the revenue mix does not depend on auditing. The simple difference between audited and unaudited municipalities does not change the revenue structure. The channel that causes the change in the structure of revenue is, indeed, corruption.
Our results contribute to the literature since we show that local leaders can reduce the impact of electoral punishment because of corruption by changing the source of funds, namely when these come from other levels of government. The literature has shown the effects of decentralization on corruption (Albornoz and Cabrales, 2013; Fan, Lin and Treisman, 2008; Fisman and Gatti, 2002). We complement this by exploring how the corruption bill may be paid given that local leaders can use different sources of financing.
9. References
Arvate, P. R. (2013). Electoral Competition and Local Government Responsiveness in Brazil,
World Development, Elsevier, 43(C): 67-83.
Arvate, P. R. and Tavares, J. (2014). Corruption versus Mismanagement in Government Spending: Evidence from a Random Audit of Brazilian Municipalities, Working Paper in
C-Micro: http://cmicro.fgv.br/sites/cmicro.fgv.br/files/arquivos/WP_5_2012_0.pdf
Bandiera, O., Prat, A. and Valletti, T. (2009). Active and Passive Waste in Government
1278-1308
Bardhan, P. (2006) The Economist’s Approach to the Problem of Corruption. World
Development, Vol. 34, No. 2, pp. 341–348.
Bardhan, P. and Mookherjee, D. (2006). Decentralization and Local Governance in Developing
Countries. MIT Press.
Banerjee, A. and Hanna, R. and Mullainathan, S. (2012). Corruption The Handbook of
Organizational Economics. Ed. Robert Gibbons and John Roberts. Princeton University
Press. 201: 1109-1147
Besley, T. and Smart, M. (2007). Fiscal restraints and voter welfare Journal of Public Economics,
Elsevier, 91(3-4): 755-773
Brollo, F., Nannicini, T., Perotti, R. and Tabellini, G. (2013). The Political Resource Curse
American Economic Review, 103(5): 1759-96
Buchanan, J.M. and Tullock, G. (1962) The calculus of consent. Logical Foundation of Constitutional
Democracy. University Michigan Press.
Caselli, F. and Morelli, M. (2008). Bad Politicians Journal of Public Economics, 88(3-4): 759-782. Cox, G.W. and McCubbins, M.D. (1986) Electoral Politics as a Redistributive Game. The
Journal of Politics, 48(2): 370-389.
Dixit, A. and Londregan, J. (1996). The determinants of success of special interests in redistributive politics. Journal of Politics 58:1132–55.
Dixit, A. and Londregan, J. (1998). Ideology, tactics, and efficiency in redistributive politics.
Quarterly Journal of Economics 113:497–529
Ferraz, C. and Finan, F. (2008). Exposing Corrupt Politicians: The Effects Of Brazil’s Publicly Released Audits On Electoral Outcomes Quarterly Journal of Economics, 123(2): 703-745 Ferraz, C. and Finan, F. (2011). Electoral accountability and corruption: Evidence from the
audits of local governments. American Economic Review, 101(4): 1274-1311
Ferraz, C., Finan, F. and Moreiria, D.B.. (2012). Corrupting Learning: Evidence from Missing Federal Education Funds in Brazil, Journal of Public Economics, Vol 96 (9-10): Pages 712-726
Geys, B., Vermeir, J., (2008). Taxation and presidential approval: Separate effects from tax burden and tax structure turbulence? Public Choice, Vol 135 (3-4): Pages 301-317
Gray, C. W. and Kaufmann, D. (1998). Corruption and development, in IMF/World Bank,
Finance and Development, v. 35(1): 7.
Jain, A.K. (2001) Corruption: A Review. Journal of Economic Surveys, v.15: 71-121
Lindbeck, A. and Weibull, J. (1987). Balanced budget redistribution and the outcome of political competition. Public Choice 52:273–97
Mauro, Paulo. (1998). “Corruption and the composition of government expenditure” Journal
of Public Economics, Vol 69: Pages 263–27
Murphy, K.M., Shleifer, A. and Vishny (1999) The allocation of Talent: Implications for Growth. Quarterly Journal of Economics, 106: 503-530.
Niskanen, W. (1971). Bureaucracy and representative government. New York: Aldine.
Niskanen, W.A., (1979). Economic and fiscal effects on the popular vote for the president. In: Rae, D., Eismeier, T. (Eds.), Public Policy and Public Choice. Beverly Hills, Sage, pp. 93-120 Olson, M. (1965). The Logic of Collective Action. Cambridge, Harvard University Press Edition Persson, T. and Tabellini, G.. (2000). Chapter 8 Electoral Rules and Electoral Competition in
Political Economics: Explaining Economic Policy, Sam Bucovetsky. Pages: 205-224. Southern Economic Journal
Persson, T. and Tabellini, G. (2000). Chapter 12 Capital Taxation” in Political Economics:
Rose-Ackerman, S. (1978) Corruption: a study in Political Economy. New York: Academic Press. Spahn, P.B. (2012) Conditioning Intergovernmental Transfers and Models of Interagency
Cooperation for Greater Effectiveness of Multilevel Government in OECD Countries. OECD Conference Center.
Svensson, J. (2005). Eight Questions About Corruption” Journal of Economic Perspectives, 19( 3): 19–42
Shleifer, A. and Vishny. R.W. (1993). Corruption The Quarterly Journal of Economics, 108 (3): 599-617
Sobel, R.S., (1998). The political costs of tax increases and expenditure reductions: Evidence from state legislative turnover. Public Choice 96, 61-79.
Weingast, B., Shepsle, K. A., and Johnsen, C. (1981). The political ecomomy of benefits and costs: A neoclassical approach to distributive politics. Journal of Political Economy, 89:642– 664
Tables
Table 1: Corruption and Mismanagement Events
0 No irregularity
1 Municipal Health Council: composition 2 Municipal Health Council: activities 3 Municipal Health Council: structure 4 Public tenders: no disclosure 5 Public tenders: irregular invoices
6 Public tenders: company addresses not substantiated 7 Public tenders: documents with different dates 8 Public tenders: unsigned contracts / forged documents 9 Public tenders: public tender directed
10 Public tenders: other problems 11 Over-billing
12 Falsified invoices 13 Unsubstantiated payment
14 Funds diverted to be used for other purposes 15 Funds diverted for health objectives
16 Fund diverted for other, intra-program purposes 17 Non-investment of funds
18 Budgeted targets not met
19 Building work and projects unfinished 20 Precarious installations
21 Shortage of medication 22 Medication stock control 23 Poor service for users
24 Professionals not working appropriate number of hours 25 Incomplete or inadequate documentation
26 Signs, logos and the like not duly displayed 27 Employee training
28 Team composition
29 Maintenance of medication and/or the like 99 Others
Source: Controladoria Geral da União (CGU). Items 5, 6, 8, 9, and 11 through 14 are classified as
corruption events. These are almost perfectly in line with Ferraz and Finan (2011). Our measure of “narrow corruption” is close to that used by Brollo, Naccicini, Perotti, and Tabellini (2010). Items 17 through 24, and 27 to 29 are classified as mismanagement. These are in line with Ferraz and Finan (2011) definition of mismanagement, except for 24 and 27, related to the mismanagement of public employees. Methodology: Arvate and Tavares (2014)
Table 2A: Descriptive Statistics
Variables
Municipalities up to 500,000 inhabitants
Full sample Audited Non-audited
Obs. Mean Obs. Mean Obs. Mean
Number of Corruption Events 37,451 0.31 4,042 2.95 33,409 -
(2.50) (7.11) -
Total Municipal Revenue (100000R$) 37,451 27.67 4,042 29.42 33,409 27.46*
(142.31) (111.34) (145.61)
Tax (Total Municipal Revenue/GDP) 36,797 9.96 3,967 10.12 32,830 9.94
(14.62) (9.65) (15.11)
Services Tax Revenue – ISS (100000R$) 36,802 17.94 3,968 19.96 32,834 17.70*
(100.83) (74.49) (103.56)
Urban Building and Land Tax Revenue – IPTU (100000R$) 36,802 10.22 3,968 10.01 32,834 10.24*
(59.43) (45.01) (60.95)
Voluntary Grants Revenue – NG (100000R$) 36,802 4.95 3,968 5.63 32,834 4.86
(18.97) (17.43) (19.14)
Federal Voluntary Grants Revenue – the federal-NG (100000R$) 36,802 2.43 3,968 2.85 32,834 2.37
(12.20) (12.97) (12.10)
State Voluntary Grants Revenue – the sate-NG (100000R$) 36,802 2.32 3,968 2.47 32,834 2.30
(12.44) (8.73) (12.82)
Number of Observed Mismanagement Events 37,451 0.54 4,042 5.07 33,409 -
(3.75) (10.36) -
Municipal GDP 37,446 3,301.66 4,041 3,387.53 33,405 3,291.27**
(11,913.79) (9,544.89) (12,169.21)
Grants settled by Law (100000R$) 36,802 251.81 3,968 290.68 32,834 247.11**
(497.19) (514.67) (494.83)
Population 37,451 23,983.12 4,042 25,435.62 33,409 23,897.38*
(45,866.87) (47,853.83) (45,618.21)
Enrollment from the kindergarten to 8th grades 37,451 3,818.47 4,042 3,920.85 33,409 3,806.08
(4,190.51) (4,804.10) (4,109.98)
Table 2B: Descriptive Statistics
Variables
Municipalities up to 500,000 inhabitants
Full sample Audited Non-audited
Obs. Mean. Obs. Mean. Obs. Mean.
Infant Mortality per 100 thousand inhabitants 37,451 7.92 4,042 8.32 33,409 7.87
(11.65) (13.77) (11.36)
Number of “Bolsa Família” beneficiaries 37,444 1,715. 05 4,042 1,982. 16 33,402 1,682. 72
(2,580.47) (2,946.49) (2,530.73)
Schooling of mayors (elementary school) 35,754 0.10 3,940 0.09 31,814 0.11**
(0.31) (0.29) (0.31)
Schooling of mayors (high school) 35,753 0.10 3,939 0.10 31,814 0.10
(0.30) (0.30) (0.30)
Schooling of mayors (tertiary) 35,752 0.31 3,940 0.31 31,812 0.31
(0.46) (0.46) (0.46)
Gender of mayors (dummy equal to 1 for women and zero otherwise). 35,754 0.07 3,940 0.07 31,814 0.07
(0.26) (0.25) (0.26) North region 37,451 0.07 4,042 0.10 33,409 0.07*** (0.26) (0.30) (0.26) Northeast region 37,451 0.31 4,042 0.37 33,409 0.31*** (0.46) (0.48) (0.46) Center-West region 37,451 0.08 4,042 0.08 33,409 0.08 (0.27) (0.27) (0.27) Southeast region 37,451 0.30 4,042 0.25 33,409 0.30*** (0.45) (0.43) (0.46) South region 37,451 0.22 4,042 0.18 33,409 0.22*** (0.41) (0.38) (0.41)
Table 3: The effects of corruption on municipal taxes
Independent Variables
Second-Stage
Dependent variable:
Total Municipal Revenue
Effective Tax Rate (Total Municipal
Revenue/GDP) Municipalities up to 500,000 inhabitants All t All t+1 All t All t+1
Number of Observed Corruption Events -1.867*** -1.259*** -0.059 -0.042 (0.455) (0.38) (0.067) (0.064)
Municipal Fixed Effects? Yes Yes Yes Yes
Control Variables? Yes Yes Yes Yes
Number of Observations 35,095 30,431 35,095 29,485
First-Stage
Dependent variable:
Number of Observed Corruption events The municipality was selected randomly for
audit (Yes, dummy==1)
4.18*** 4.68*** 4.18*** 4.57*** (0.074) (0.086) (0.07) (0.08) F-Statistic 545.40 *** 471.48*** 545.40*** 440.99***
Note: *** Significant at the 1% level; ** Significant at the 5% level; *Significant at the 10% level. Robust standard
deviations are presented in parenthesis. Control variables: Number of Observed Mismanagement Events, Municipal GDP, Grants settled by Law (in thousands), Population, Enrollment from the kindergarten to 8th grades, Infant Mortality per 100 thousand inhabitants, Number of “Bolsa Família” beneficiaries, Schooling of mayors (dummies for elementary school, high school, and tertiary), gender of mayors (dummy equal to 1 for women and zero otherwise), the election dummy(dummy equal to 1 for the 2008 election and zero otherwise), and the regional dummies (north, northeast, center-west, north, and south).
Table 4: The effects of corruption on NG
Independent Variables
Second-Stage
Origin of Grants:
Total Federal State
Dependent variable: NG
Number of Observed Corruption Events 0.217** 0.113 0.112** (0.099) (0.083) (0.047)
Municipal Fixed Effects? Yes Yes Yes
Control Variables? Yes Yes Yes
Number of Observations 35,095 35,095 35,095
First-Stage
Dependent variable:
Number of Observed Corruption events The municipality was selected randomly for
audit (Yes, dummy==1)
4.18*** 4.18*** 4.18*** (0.074) (0.074) (0.074)
F-Statistic 545.40*** 545.40*** 545.40***
Note: *** Significant at the 1% level; ** Significant at the 5% level; *Significant at the 10% level. Robust
standard deviations are presented in parenthesis. Control variables: Number of Observed Mismanagement Events, Municipal GDP, Grants settled by Law (in thousands), Population, Enrollment from the kindergarten to 8th grades, Infant Mortality per 100 thousand inhabitants, Number of “Bolsa Família” beneficiaries, Schooling of mayors (dummies for elementary school, high school, and tertiary), gender of mayors (dummy equal to 1 for women and zero otherwise), the election dummy(dummy equal to 1 for the 2008 election and zero otherwise), and the regional dummies (north, northeast, center-west, north, and south).
Table 5: Exploring the relationship with the governors
Independent Variables
Second-Stage
Governor found competitive elections
Governor is elected on the second round
Governor is not elected on the second round Dependent variable: State NG Number of Observed Corruption Events 0.199* 0.082*
(0.117) (0.048)
Municipal Fixed Effects? Yes Yes
Control Variables? Yes Yes
Number of Observations 14,412 18,899
First-Stage
Dependent variable: Number of Observed Corruption events
The municipality was selected randomly for audit (Yes, dummy==1)
5.112*** 4.52***
(0.139) (0.101)
F-Statistic 228.98*** 317.97***
Note: *** Significant at the 1% level; ** Significant at the 5% level; *Significant at the 10% level. Robust standard
deviations are presented in parenthesis. Control variables:Number of Observed Mismanagement Events, Municipal GDP, Grants settled by Law (in thousands), Population, Enrollment from the kindergarten to 8th grades, Infant Mortality per 100 thousand inhabitants, Number of “Bolsa Família” beneficiaries, Schooling of mayors (dummies for elementary school, high school, and tertiary), gender of mayors (dummy equal to 1 for women and zero otherwise), the election dummy(dummy equal to 1 for the 2008 election and zero otherwise), and the regional dummies (north, northeast, center-west, north, and south).
Appendix
Table A2: The effects of corruption on municipal taxes and Grants
Dependent variables:
Total Municipal Revenue
Effective Tax Rate (Total Municipal
Revenue/GDP)
Origin of Grants:
Between 2005 and 2007
Municipalities up to 500,000 inhabitants
All t All t+1 All t All t+1 Total Federal State
Number of Corruption Events observed only between 2009 and 2011
-0.045 0.013 0.030 0.083* -0.048 -0.048 0.004 (0.127) (0.156) (0.029) (0.043) (0.084) (0.078) (0.019)
Municipal Fixed Effects? Yes Yes Yes Yes Yes Yes Yes
Control Variables? Yes Yes Yes Yes Yes Yes Yes
Number of Observations 2,248 1,625 2,248 1,572 2,248 2,248 2,248
Note: *** Significant at the 1% level; ** Significant at the 5% level; *Significant at the 10% level. Robust standard deviations are presented in parenthesis. Control
variables: Number of Observed Mismanagement Events, Municipal GDP, Grants settled by Law (in thousands), Population, Enrollment from the kindergarten to 8th grades, Infant Mortality per 100 thousand inhabitants, Number of “Bolsa Família” beneficiaries, Schooling of mayors (dummies for elementary school, high school, and tertiary), gender of mayors (dummy equal to 1 for women and zero otherwise), and the regional dummies (north, northeast, center-west, north, and south).
Table A1: The effects of corruption (splitting by taxes)
Independent Variables
Second-Stage
Dependent variable: Municipal Taxes
Municipalities Services Tax Revenue
(ISS)
Urban Building and Land Tax Revenue (IPTU) All t All t+1 All t All t+1
Number of Observed Corruption Events -1.602*** -1.150*** -0.265*** -0.233*** (0.459) (0.419) (0.073) (0.063)
Municipal Fixed Effects? Yes Yes Yes Yes
Control Variables? Yes Yes Yes Yes
Number of Observations 35,095 29,487 35,095 29,487
First-Stage
Dependent variable:
Number of Observed Corruption events The municipality was selected randomly for audit
(Yes, dummy==1)
4.181*** 4.576*** 4.181*** 4.576*** (0.074) (0.086) (0.074) (0.086)
F-Statistic 545.40*** 441.00*** 545.40*** 441.00***
Note: *** Significant at the 1% level; ** Significant at the 5% level; *Significant at the 10% level. Robust standard deviations are
presented in parenthesis. Control variables: Number of Observed Mismanagement Events, Municipal GDP, Grants settled by Law (in thousands), Population, Enrollment from the kindergarten to 8th grades, Infant Mortality per 100 thousand inhabitants, Number of “Bolsa Família” beneficiaries, Schooling of mayors (dummies for elementary school, high school, and tertiary), gender of mayors (dummy equal to 1 for women and zero otherwise), the election dummy(dummy equal to 1 for the 2008 election and zero otherwise), and the regional dummies (north, northeast, center-west, north, and south).
Table A3: The effects of audited municipalities on municipal taxes and Grants
Dependent variables:
Total Municipal Revenue
Effective Tax Rate (Total Municipal
Revenue/GDP)
Origin of Grants:
Municipalities up to 500,000 inhabitants
All t All t+1 All t All t+1 Total Federal State
The municipality was selected randomly for audit (Yes, dummy==1)
0.219 -0.076 -0.097 -0.165 0.459* 0.176 0.201 (1.448) (1.207) (0.196) (0.197) (0.258) (0.214) (0.133)
Municipal Fixed Effects? Yes Yes Yes Yes Yes Yes Yes
Control Variables? Yes Yes Yes Yes Yes Yes Yes
Number of Observations 35,113 30,453 35,113 29,543 35,113 35,113 35,113
Note: *** Significant at the 1% level; ** Significant at the 5% level; *Significant at the 10% level. Robust standard deviations are presented in parenthesis. Control
variables: Municipal GDP, Grants settled by Law (in thousands), Population, Enrollment from the kindergarten to 8th grades, Infant Mortality per 100 thousand inhabitants, Number of “Bolsa Família” beneficiaries, Schooling of mayors (dummies for elementary school, high school, and tertiary), gender of mayors (dummy equal to 1 for women and zero otherwise), the election dummy(dummy equal to 1 for the 2008 election and zero otherwise), and the regional dummies (north, northeast, center-west, north, and south).