i
Joana Maria Serra de Oliveira Duarte Figueiredo
Licenciada em Bioquímica, Faculdade de Ciências da Universidade de Lisboa
The role of microRNAs in Amyotrophic
Lateral Sclerosis
Dissertação para obtenção do Grau de Mestre em Genética Molecular e Biomedicina
Orientador: Prof. Doutor Kevin Talbot, University of Oxford
Júri:
Presidente: Prof. Doutor José Paulo Sampaio
Arguente: Prof.ª Doutora Alexandra Ramos Fernandes Vogal: Prof.ª Doutora Paula Bernardo Gonçalves
UNIVERSIDADE NOVA DE LISBOA
FACULDADE DE CIÊNCIAS E TECNOLOGIA DEPARTAMENTO DE CIÊNCIAS DA VIDA
Joana Maria Serra de Oliveira Duarte Figueiredo
Licenciada em Bioquímica, Faculdade de Ciências da Universidade de LisboaThe role of microRNAs in Amyotrophic Lateral Sclerosis
Dissertação para obtenção do Grau de Mestre em Genética Molecular e Biomedicina
Orientador: Prof. Doutor Kevin Talbot, University of Oxford
Júri:
Presidente: Prof. Doutor José Paulo Sampaio
Arguente: Prof.ª Doutora Alexandra Ramos Fernandes Vogal: Prof.ª Doutora Paula Bernardo Gonçalves
The role of microRNAs in Amyotrophic Lateral Sclerosis
Copyright Joana Maria Serra Oliveira Duarte Figueiredo, FCT/UNL, UNL
Acknowledgements
I am deeply grateful to my supervisor Professor Kevin Talbot for the opportunity he gave me to research and study at the Department of Physiology, Genetics and Anatomy of the University of Oxford and for his supervision on my work. I also thank him for sharing his vision with me and guiding my work. I gratefully acknowledge Professor Kevin Talbot for being part of changing life experiences in a multicultural city, which exceptionally inspired and enriched my growth both in science and life. Foremost, I would like to express my sincere gratitude for all his words of encouragement throughout this year.
I also thank Professor Dame Kay Davies for the possibility to benefit of knowledge and discussion by outstanding researchers and the very open and incentive way she runs the Department.
To Dr. Sheena Lee I thank the friendly and invaluable support and all the recommendations and advices she gave me on scientific matters and the encouragement to continue the work mainly when the experiences went wrong.
Dr. Angie Biba deserves a special word of gratitude for both professional and emotional support and the friendship she revealed.
To Anna Dulneva I am deeply indebted for sharing with me her advanced knowledge on LCM and on lab techniques.
I am also grateful to Dr. Emmanuelle Bitoun for her sharing her expert knowledge.
To Dr. Neza Alfazema I wish to thank the initial technical help as I arrived at the laboratory.
To all my colleagues at the laboratories in Oxford I must thank the moments I spent with them this last year, especially to Dr. Ana Marques has my gratitude for the companionship she revealed and for the scientific help.
To Professor José Paulo Sampaio and to Professor Paula Gonçalves of the Department of Life Sciences of the Faculty of Science and Technology of NOVA University of Lisbon I express my gratitude for the support they gave me, as my internal co-supervisors, to go to the University of Oxford.
Resumo
Os microRNAs (miRNAs) têm-se revelado como mediadores cruciais da regulação genética em diferentes tipos de células. Há evidências de que subconjuntos específicos de miRNAs desempenham um papel proeminente no sistema nervoso, tanto no seu desenvolvimento como em doenças neurodegenerativas. Este estudo teve como objectivo elucidar o papel dos microRNAs com a morte selectiva de neurónios motores, característica da esclerose lateral amiotrófica (ALS).
Escolheu-se um estágio pré-sintomático pois os níveis dos miRNAs são alterados como consequência secundária dos processos de morte celular desencadeados pela doença. Usou-se a técnica de microdissecção e captura a laser (LCM) para estudar perfis de miRNAs em neurónios motores de espinal medula de ratos SOD1G93A, o modelo melhor caracterizado de ALS. Num trabalho preliminar, utilizando chips de miRNA específicos foram identificados dois miRNAs consideravelmente sobre-regulados antes do início da doença. Neste estudo obteve-se RNA de elevada qualidade a partir de células capturadas por LCM, o que consistiu num importante avanço no sentido da obtenção de resultados significativos da expressão miRNAs em aplicações posteriores.
A obtenção de quantidade suficiente de material de partida utilizando LCM para aplicações posteriores, ainda é um desafio, apesar desta tecnologia se ter tornado cada vez mais sofisticada. A combinação desta técnica optimizada com microarrays, seguida de validação por RT-qPCR pode elucidar o papel dos microRNAs na neurodegeneração dos neurónios motores em ALS.
Palavras-chave
Abstract
MicroRNAs (miRNAs) are emerging as a primary mediator of gene regulation in many different cell types. There is increasing evidence that specific subsets of miRNA play a prominent role in the nervous system, both in development and in specific neurodegenerative diseases. This study aims to elucidate the role of microRNA in selective motor neuron death that is the hallmark of amyotrophic Lateral sclerosis (ALS).
Pre-symptomatic time-point was chosen since the levels of miRNAs are highly likely to be altered as a secondary consequence of cell injury and death in ALS. Laser capture microdissection (LCM) was used to study miRNA profiles in motor neurons of spinal cord tissue from SOD1G93A mice, the best characterized model of ALS. In preliminary work, using miRNA specific chips we have identified 2 miRNAs which are dramatically upregulated before disease onset. In this study, high RNA quality was achieved from laser captured cells, which consist in a major advance towards obtaining meaningful results of these miRNAs expression in downstream applications.
Despite LCM technology has become increasingly sophisticated; rapidly obtaining enough amount of starting material for downstream applications is still extremely challenging. The combination of this optimized technique with microarrays, followed by RT-qPCR may provide insights into potential contribution of microRNAs to progression of neurodegeneration of motor neurons in ALS.
Keywords
Table of Contents
Acknowledgements ... v
Resumo ... vii
Abstract ... ix
List of figures ... xv
List of tables... xvii
List of Abbreviations and Acronyms ... xix
1. Introduction ... 1
1.1. Amyotrophic lateral sclerosis (ALS) ... 1
1.2. SOD1 mutations and neurototoxicity ... 3
1.3. ALS disease models ... 4
1.3.1. SOD1 mouse models ... 4
1.3.2. Transgenic SOD1G93A mice ... 5
1.4.Pathogenic mechanisms of ALS ... 7
1.4.1.Glutamate-induced Excitotoxicity ... 8
1.4.2.Oxidative stress and Mitochondrial dysfunction ... 8
1.4.3.Protein misfolding and aggregation ... 9
1.5. The potential role of MicroRNAs in ALS ... 10
1.5.1. miRNAs Biogenesis and target- Gene Silencing ... 11
1.5.2. Potential role of MicroRNAs in neurodegeneration ... 13
1.5.3. Searching for microRNAs implicated in ALS ... 14
1.6.Background ... 16
1.7.Aims of this thesis ... 16
2. Materials and Methods ... 17
2.1.Animals ... 17
2.1.2.Genotyping ... 17
2.1.3.Lumbar spinal cord dissection ... 20
2.2.Histology ... 21
2.2.1.Cryostat sectioning ... 21
2.2.2.Fixation and Hydration ... 21
2.2.3.Cresyl violet staining ... 21
2.2.4.Washing and Dehydration ... 21
2.3.Laser Capture Microdissection (LCM) ... 22
2.4.miRNA/RNA extraction ... 23
2.5.RNA quantification and quality control ... 23
2.6.Reverse transcription and quantitative PCR (RT-qPCR) ... 24
2.6.1.RT-qPCR TaqMan MicroRNA Assays ... 25
2.6.2.RT-qPCR Megaplex TM Pool with cDNA preamplification step ... 28
3. Results ... 33
3.1.Genotyping of WT and SOD1G93A Mice Littermates ... 33
3.2.Motor Neurons Isolation by LCM ... 34
3.3.RNA Quantity and Quality Assessment... 36
3.3.1.Quantity of total RNA was accurately determined by RiboGreen Assay ... 36
3.3.2.Quality of total RNA improves substantially with RNase Inhibitor ... 38
3.4.Expression profiling of microRNA using real-time quantitative PCR ... 42
4. Discussion ... 45
4.1.Laser Capture Microdissection: Advantages/ disadvantages and effect on quality and yield of RNA ... 45
4.2.Effect of RNase Inhibitor on RNA integrity assessed by Bioanalyser ... 47
4.3.RNA quality and yield impact and real time RT-qPCR microRNA analysis .. 48
4.4.Concluding remarks and Future Prospects ... 50
Supplementary data ... 63
List of figures
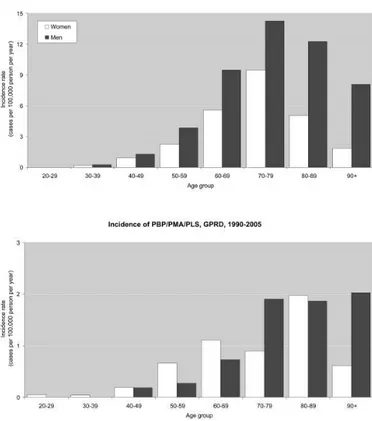
Figure 1.1 Incidence rate of amyotrophic lateral sclerosis in the General Practice Research Database
(GPRD), by age and sex, 1990–2005. (p2)
Figure 1.2 Time course of clinical and neuropathological events in high copy number transgenic
SOD1G93A mice. (p6)
Figure 1.3 Proposed mechanisms of toxicity in SOD1-mediated ALS. (p7)
Figure 1.4 Biogenesis and mode of action of miRNAs in mammalian cells. (p12)
Figure 1.5 Proposed Mechanisms by which miRNAs could influence neurodegeneration. (p13)
Figure 2.1 Spinal cord removal method from vertebral column of presymptomatic transgenic
SOD1G93Aand WT mice. (
p20)
Figure 2.2 RNA quality of extracted total RNA measured using Agilent 2100 bioanalyzer. (p24)
Figure 2.3 Schematic description of RT–PCR TaqMan® MicroRNA Assay chemistry including two
steps. (p26)
Figure 3.1 Ethidium bromide–stained 1.5% agarose gel for genotyping of 5 samples from mice
littermates. (p33)
Figure 3.2 Laser Capture Microdissection (LCM) of motor neurons from 1% cresyl violet stained
lumbar spinal cord (SC) sections of 40-day-old SOD1G93A (A, B, C, D) and WT (E, F, G, H) mice. (p35)
Figure 3.3 Standard curve for RNA concentration using RiboGreen assay. (p37)
Figure 3.4 Preservation of RNA integrity from LCM single cells, by addition of RNase Inhibitor and
staining optimization. (p38)
Figure 3.5 Quality of extracted RNA from 600 motor neurons collected by LCM samples was
analysed using Agilent RNA 6000 Pico chip, on a 2100 Bioanalyser. (p40)
Figure 3.6 Quality of extracted RNA from 3 spinal cord sections from WT (A,B) and SOD1G93A (C,
Figure 3.7 Standard curve analysis depicting perfect linearity and correlation between input quantity
(40-0.4 ng/µl) and measured Threshold Cycle (CT) value for four different miRNAs (182, miR-34c, miR-234 and miR-202). (p43)
List of tables
Table 1.1 Transgenic mutant SOD1 mouse models.(p5)
Table 2.1 Multiplex PCR Master mix reaction components for a final reaction volume of 25 μl used
for genotyping SOD1 G93A mice and WT littermates. (p18)
Table 2.2 PCR primer pairs of transgene and internal positive control used for genotyping SOD1
G93A mice and WT littermates. (p19)
Table 2.3 Cycling conditions used for genotyping SOD1 G93A mice and WT littermates. (p19)
Table 2.4 RT reaction master mix components in a final volume of 15 μl including 7 μl master mix, 3
μl of each primer and 5 μl total RNA. (p25)
Table 2.5 Cycling conditions to perform RT reaction followed by qPCR. (p26)
Table 2.6 Real-time PCR reaction mixture components. (p27)
Table 2.7 Parameter values used to program the thermal cycler to perform real-time PCR. (p28)
Table 2.8 RT reaction Mix components in final reaction volume of 7.5 μl. (p29)
Table 2.9 Cycling conditions used for Megaplex TM RT reaction. (p29)
Table 2.10 PreAmp Reaction Mix Components. (p30)
Table 2.11 PreAmp Reaction Mix Cycling conditions. (p30)
Table 3.1 RFU corrected values and RNA concentration of RNA standard sample in a final volume
assay of 200μl. (p36)
Table 3.2 RFU corrected values and RNA concentration of RNA ([RNAinitial]=5.7 ng/μl diluted to
1ng/μl) sample in a final volume assay 200μl. (p37)
List of Abbreviations and Acronyms
ABP Amyloid-ß peptide
AD Alzeimer Disease
ALS Amyotrophic Lateral Sclerosis
ATF6 Activating transcription factor 6
BiPs Binding immunoglobulin Proteins
EAATs Excitatory Aminoacid Transporters
ER Endoplasmic Reticulum
ERAD ER-associated degradation
FALS Familial Amyotrophic Lateral Sclerosis
FGF20 Fibroblast Growth Factor 20
FGFBP1 Fribroblast Growth Factor Binding Protein 1
FUS /TLS Fused in Sarcoma /Translated in Liposarcoma Protein
GLT1 Glutamate Transporter 1
HD Huntington’s Diease
HDAC4 Histones Deacetylase 4
IPC Insolube Protein Complexes
IRE1 Inositol-requiring enzyme 1
KBBP Appa B motif- binding phosphoprotein
LCM Laser Capture Microdissection
MND Motor neuron disease
NFQ Nonfluorescent quencher
NMJ Neuromuscular Junction
NMJ Neuromuscular junction
OCT Optimal cutting temperature compound
PBS Phosphate buffered saline
PD Parkison Disease
PERK Protein kinase RNA-like endoplasmic reticulum kinase
Pre-miRNA Precursor-microRNA
Pri-miRNA Primary-microRNA
qPCR Quantitative PCR
REST RE1 silencing transcription factor
RISC RNA-induced silencing complex
RT Reverse Transcription
SALS Sporadic Amyotrophic Lateral Sclerosis
SC Spinal Cord
SMA Spinal Muscular Atrophy
SMN Spinal Motor Neuron
SOD1 Superoxide dismutase 1
TDP-43 TAR DNA-binding protein 43
UTR Untranslated region
1.
Introduction
1.1.
Amyotrophic lateral sclerosis
Amyotrophic lateral sclerosis (ALS) is a neurodegenerative disorder characterized by selective degeneration and loss of upper and lower motor neurons (MNs) that leads to progressive weakness of limbs, paralysis and ultimately to death.
The disease was first described in 1869 by the French neurologist Jean-Martin Charcot. Although exciting new insights regarding the potential mechanisms that underlie the neurodegeneration have emerged in recent years, there are still no effective treatments for ALS.
Characteristic clinical manifestations of ALS include spasticity and hyperreflexia due to the dysfunction of upper MNs, and generalized weakness, muscle atrophy, and paralysis as a result of lower MN damage. Certain populations of MNs, eg; those serving oculomotor function, are relatively, though can be involved in later disease in patients with ALS (Sharma R. et al, 2011). The disease
symptoms progress rapidly leading to death, usually due to respiratory failure, on average within 2-3 years of onset.
ALS is the third most common adult neurodegenerative disease (after Alzheimer’d disease and Parkinson’s disease), with an annual incidence of 2 per 100,000 population and a prevalence of 5 to 7 per 100,000. The estimated lifetime risk of being diagnosed with ALS is 1 in 400-700 (Andersen P.M., 2006). There are approximately 4-5000 patients with ALS in the United Kingdom and 25,000 patients with ALS in the USA. Moreover, population-based studies have found that MND incidence is higher in men than women, with an incidence for both sexes which peaks at age 75–79 (Alonso A. et
al, 2009). Typical age onset of sporadic ALS been reported between 60 and 80 years with rapid
symptom progression to death, but juvenile ALS cases, which are typically inherited, with slow symptom progression have also been described (Butterfield R. J. et al, 2009).
The majority of ALS cases (80- 90%) correspond to a sporadic form of the disease (SALS) in which there is no apparent genetic linkage and the primary causes remain unknown. About 5-10% of ALS cases are reported as familial (FALS) in which the disease is inherited in a mendelian autosomal dominant mode with high penetrance (Cleveland D. W. and Rothstein J. D., 2001).
SALS are related with mutations in the Cu/Zn Superoxide dismutase 1(SOD1) gene (Valdmanis P.N.
et al, 2009).
Other genes implicated in FALS include Fused in sarcoma protein (FUS), TAR-DNA binding protein of molecular weight 43 kDa (TDP43). Mutations in FUS and TDP43 correspond to approximately 5% of all FALS cases each (Kwiatkowski et al., 2009, Kabashi et al., 2008). In
addition, mutations in other genes, including ALS2, SETX, SPG11, VAPB, ANG, and OPTN have also been associated with ALS but account for less than 5% of FALS, and often occur in patients with atypical phenotypes different from sporadic ALS (Nishimura et al., 2004; Pasinelli P. and Brown
R.H., 2006; Orlacchio A. et al, 2010; Maruyama et al., 2010).
Since FALS patients are indistinguishable clinically from SALS patients, new insights into the causes and pathogenic mechanisms of FALS might contribute to develop effective therapies also for the much common form of the disease, sporadic ALS.
Figure 1.1 Incidence rate of amyotrophic lateral sclerosis in the General Practice Research Database
(GPRD), by age and sex, 1990–2005. (Alonso A. et al, 2009)
epistatic or epigenetic mechanisms involving unknown other genes might contribute to the clinical manifestations of the disease. Therefore, an important step to clarify the causes of ALS is to understand the clinical heterogeneity observed.
ALS is a complex multifactorial disease in which the clinical manifestations are influenced by a combination of both genetic and environmental factors. For these reasons, the pathogenic mechanisms inherent in ALS are not fully elucidated yet and further research is needed in this field.
1.2.
SOD1 mutations and neurototoxicity
The first major genetic contribution to the understanding of ALS came with the discovery of mutations in the SOD1 gene on chromosome 21q22.11 (Rosen, D. R. et al). The SOD1 gene is
composed of five exons and encodes the antioxidant enzyme Cu/Zn SOD1 that converts superoxide radicals, generated by mitochondrial oxidative phosphorylation, to water and hydrogen peroxide. The cytoplasmic Cu/Zn SOD1 protein is ubiquitously expressed and highly conserved. The majority of SOD1 mutations identified are missense substitutions observed at almost any position throughout the gene. In exon 4 and 5 of the gene, frameshift deletions and insertions have also been reported (Shaw B.F. and Valentine J.S., 2007).
It has been reported that SOD1- mediated toxicity in ALS is not due to loss function but to a gain of function. In fact, transgenic mice overexpressing the human mutant SOD1 develop the disease but SOD1 knockout mice do not show ALS symptoms (Gurney et al., 1994; Reaume et al., 1996).
Moreover, it has been reported that some SOD1 mutants retain full catalytic activity and there is no correlation between the levels of enzymatic activity and the disease phenotype (Shaw B.F. and Valentine J.S., 2007). This suggests that SOD1 mutations possibly result in the acquisition of toxic properties of mutant SOD1, causing motor neuron degeneration.
1.3.
ALS disease models
1.3.1.
SOD1 mouse models
Over the years, several animal models have been used to study the selective motor neuron death, the hallmark of ALS. Many models were created in order to understand the SOD1-mediated toxicity in mice, rats, zebrafish, Drosophila melanogaster and Caenorhabditis elegans.
The first animal model of ALS was created in the mouse transgenically expressing the human SOD1 gene that encodes the G93A mutation from the human SOD1 promoter (Gurney et al, 1994).
For more than a decade, the mutant SOD1 mouse has been the best model to study the mechanisms underlying ALS pathogenesis. However, this model has not lead yet to a key step forward in ALS therapeutics. Therefore, ALS research directions include generating new mouse models of the disease based on other gene mutations, such as the recent mutations discovered in the genes encoding TDP-43 and FUS/TLS. Despite these attempts to create better mouse models based on these genes, mutant SOD1 mice models remain the best models presently available to study the pathogenesis of ALS and to test new therapies.
Currently, there are 12 SOD1 human ALS mutations expressed in mice (table 2). Besides the original SOD1 G93A mice, other transgenic mice were created, overexpressing human SOD1 with other
mutations such as G37R, G85R, G86R and D90A. These 12 mutations include 9 missense and 3 C-terminally truncated variants (SOD1L126X, SOD1L126delTT and SOD1G127X).
The SOD1G93Amice are the most frequently used transgenicmice models in ALS research,
although many studies have also been conducted using the SOD1G37R, SOD1G85R and SOD1G86R transgenic mouse models (Bruijn and Cleveland, 1996). While the SOD1G93A and SOD1G37R mutants are stable, active and highly expressed, the SOD1G85R mutant proteins are unstable and lower
expressed (Turner and Talbot, 2008).
The phenotypes of mutant SOD1 mouse models may depend on the transgene expression level and mutation type. It was described that mice expressing higher amounts of the SOD1G93A transgene
develop the disease earlier than the mice expressing lower amounts of the transgene.
Moreover, transgenic SOD1A4V mice showed symptoms in the later stages of the disease (>85
weeks) contrary to what as observed in humans, where the disease is rapidly progressive, likely due to low transgene expression level. However, double transgenic mice expressing the SOD1A4V transgene
and overexpressing wild-type SOD1 develop the earliest symptoms of ALS (35 weeks) (Deng et al.
Since most mouse SOD1 transgenics recreate many features of ALS seen in human patients, they have been crucial in ALS research. The SOD1G93A mouse is so far the main animal model for
ALS and has provided a relevant basis for study potential mechanisms of ALS.
Table 1.1 Transgenic mutant SOD1 mouse models. Adapted from Joyce et al, 2011.
nd not described, dl G1 del—low copy,
a
Double transgenic with SOD1WT
bMouse transgene
1.3.2.
Transgenic SOD1
G93Amice
The transgenic mice are generated using a transgenic construct containing 12-15 kb human genomic fragments encoding SOD1. The transgene is ubiquitously expressed under control of the human or mouse SOD1 gene promoter at much higher levels than the level of endogenous SOD1, due to insertion of multiple copies of the transgene into the mouse genome. The G93A mouse used in this work contains approximately 20 copies of the transgene, expresses protein at 6-10 fold higher levels than endogenous and has 11-fold higher SOD1 activity. The mutations induce fatal symptoms characteristic of ALS with onset at 3-4 months and death within 1-2 months of onset (Turner and Talbot, 2008).
show severe symptoms such as hyper-reflexia and paralysis. The progressive motor neurons loss in the lumbar spinal cord leads to death around 120 days.
The motor neuron loss begins at the distal axon and proceeds to the later proximal axonal loss around 80 days leading to a evident lower motor neuron death at 100 days, showing a "dying back" pattern (Fischer et al., 2004). In addition, ALS does not only cause the loss of lower motor neurons in
transgenic SOD1G93A mice but also loss of descending cortical and bulbar neurons(Zang and Cheema, 2002).
Several molecular mechanisms may underlie the phenotype including Golgi apparatus fragmentation, mitochondrial vacuolization, and mutant SOD1 aggregation into insoluble protein complexes (IPC) inclusion bodies that lead to endoplasmic reticulum (ER) stress, contributing to motor neuron degeneration.
Figure 1.2 Time course of clinical and neuropathological events in high copy number transgenic
The advantages of this model include predictable disease progression and the fact that it replicates many of the clinical, cellular and molecular features of ALS observed in human patients with ALS. Therefore, this transgenic mouse model has been a great contribution to understanding the pathogenic mechanisms of ALS.
1.4.
Pathogenic mechanisms of ALS
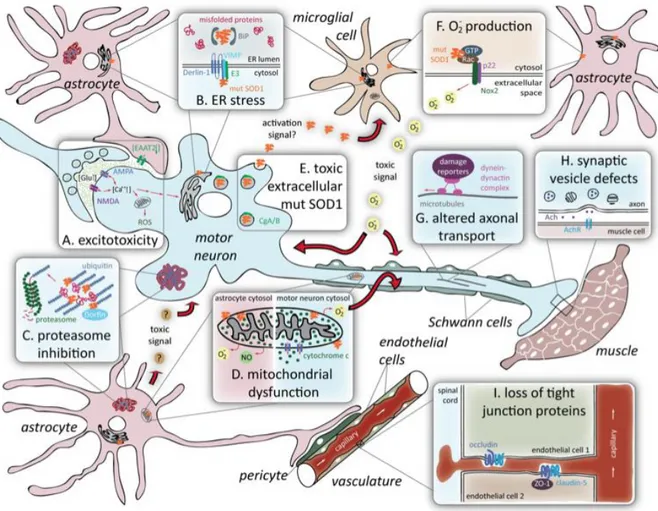
Over the years, various pathogenic mechanisms have been proposed to explain selective motor neuron degeneration in ALS, including glutamate - induced excitotoxicity, oxidative stress, protein aggregation, mitochondrial dysfunction, deficits in neurotrophic growth factors, astrogliosis, microgliosis and inflammation.
Figure 1.3 Proposed mechanisms of toxicity in SOD1-mediated ALS. (A) Excitotoxicity; (B) ER
The transgenic mice expressing mutant SOD1 have been essential to define the potential disease mechanisms and understand how a mutation in SOD1 enzyme, which is ubiquitously expressed, could be a primary cause of selective motor neuron death in ALS.
1.4.1.
Glutamate-induced Excitotoxicity
Excitotoxic damage is one of the mechanisms that could explain the selectivity of motor neuron death and the role of neighbouring non-neuronal cells in ALS.
The repetitive stimulation of glutamate receptors occurs due to a failure to rapidly remove glutamate from the synaptic cleft by excitatory amino acid transporters (EAATs). It has been reported that mutant SOD1 induces oxidative damage to the intracellular C-terminal part of the astroglial glutamate transporter EAAT2. This event contributes to a selective loss of EAAT2 transporter in astrocytes of motor cortex and spinal cord in sporadic and familial ALS patients (Trotti D. et al, 1999;
Van Damme P. et al, 2005). In addiction, the transcription of EAAT2 was found reduced in astrocytes
due to reduced expression of a kB motif binding phosphoprotein (KBBP), which is stimulated by neurons and required for GLT1/EAAT2 transcriptional activation (Yang Y. et al, 2009).
The hyperactivation of motor neurons by glutamate leads to high calcium influx and subsequently to activation of apoptotic pathways, which leads to motor neuron death (Foran E., Trotti D., 2009).
The intrinsic characteristics of motor neurons, observed in SOD1 mice spinal cord, contribute to explain the selective motor neuron death. These characteristics include a decreased of GluR2 AMPA subunit levels and an increase of GluR3 expression that explain high calcium influx. In addiction, motor neurons have low expression of calcium binding proteins that leads to low calcium buffering capacity (Tortarolo M. et al, 2006).
Excitotoxicity is an interesting mechanism and a potentially druggable target (Bogaert E. et al,
2010). However, it remains unclear whether these changes represent a primary defect that causes motor neuron degeneration, or are a downstream result of other primary ALS pathways.
1.4.2.
Oxidative stress and Mitochondrial dysfunction
The major source of oxidative stress is mitochondria, which play essential roles in ATP production, excitotoxicity, cell survival and apoptosis. Morphological and functional defects in mitochondria have been observed both in SOD1 mutant mouse models and human patients (Higgins C. M., et al, 2003). Mitochondrial dysfunction has been observed presymptomatically not only in
motor neurons but also in astrocytes, indicating that this mechanism can be a relevant contribution to triggering the disease (Damiano et al 2006; Cassina et al, 2008). Mutant SOD1 deposition on the
mitochondrial membrane leads to decreased activity of respiratory complexes and release of cytochrome C in motor neurons, whereas in astrocytes causes nitroxidative stress (Vande V.C. et al,
2008). The mitochondrial localization of mutant SOD1 increases with the overexpression of copper chaperone for SOD1, contributing to neurodegeneration (Son M., et al, 2007).
1.4.3.
Protein misfolding and aggregation
Similarly to other neurodegenerative disorders such as Alzheimer’s and Parkinson’s diseases, the presence of mutant protein aggregates or inclusions has also been reported in ALS. SOD1 mutant protein tends to be misfolded and forms cytoplasmic aggregates that occur early in disease. These aggregates have been observed in motor neurons and neighbouring astrocytes in the established ALS mouse models (Bruijn et al. 1998).
Several studies have been conducted in order to clarify the mechanisms by which the SOD1 protein aggregates may contribute to damage the motor neurons and astrocytes. It has been shown that the toxicity of aggregates arises from dysfunction of mitochondria, peroxisomes; indution of ER stress and inihibition of proteasome-mediated degradation pathway.
Mutant SOD1 aggregates were found in ER membranes, where they interact with endoplasmic reticulum (ER) proteins inducing ER stress pathways. It has been described that ER binding immunoglobulin proteins (BiPs) bind to SOD1 aggregates and act as chaperones that regulate the activation of unfolded protein response transducers such as IRE1, PERK, and ATF6 (Kikuchi et al,
2006).
of another unidentified early event (Nishitoh et al, 2008). In contrast, up-regulation of ER
stress-related genes before disease onset was observed in motor neurons in mice expressing mutant SOD1, showing that ER stress responses influence the progressive manifestations of the disease (Saxena et
al., 2009). Moreover, biochemical studies have provided evidence of decreased proteasome activity in
motor neurons of G93A SOD1 mice spinal cord, showing that UPS impairment may play a role in the disease progression (Cheroni et al., 2009).
1.5. The potential role of MicroRNAs in ALS
The first microRNA (miRNA) gene, lin-4, was discovered in 1993 as a result of a genetic
screen for mutations in Caenorhabditis elegans (Lee et al, 1993). Since then, many miRNAs have
been identified in several plants and animals.
MicroRNAs are small evolutionarily conserved noncoding RNAs (approximately 22 nucleotides long) that have emerged as key regulators in the majority of biological processes such as cell proliferation, differentiation, metabolism and apoptosis. It has been reported that miRNAs are strongly regulated and responsible for the most abundant mode of post-transcriptional regulation of diverse downstream targets (Lu et al, 2008). It is estimated that more than 60% of human
protein-coding genes have miRNA target sites in their 3’ untranslated region and are potentially regulated by these molecules (Friedman et al, 2009; Sayed D. et al, 2011). Many miRNAs are expressed in the
nervous system and play an important role in neuronal differentiation, synaptogenesis and plasticity (Vo et al, 2010). In recent studies, microRNAs have been shown to have an important role in many
1.5.1. miRNAs Biogenesis and target- Gene Silencing
The majority of miRNAs are localized in intergenic regions, although a minority were found in the intronic regions of known genes
(
Griffiths-Joneset al,
2006)
. It has been reported thatintragenic miRNAs are co-transcribed with their host genes while most intergenic miRNAs are transcribed from their own RNA polymerase II promoter (Corcoran D.L. et al., 2009).
The miRNA gene expression pathway is initiated in the nucleus, where the miRNAs genes are transcribed by RNA polymerase II or III into primary miRNA transcripts (pri-miRNA), which can be more than 1000 nucleotides in length. The pri-mRNA is cleaved by Drosha RNase III endonuclease to a ~70 nt stem loop precursor miRNA pre-miRNA. The resulting pre-miRNA is transported to the cytoplasm via Exportin-5. Once in the cytoplasm, the pre-miRNA is processed by a RNase III endonuclease (Dicer) which cleaves it to produce a mature double-stranded RNA of 19–23 nucleotides. One strand of the duplex is degraded, whereas the other strand is the mature microRNA that binds to Dicer and Argonaute (Ago) proteins to form RNA-induced silencing complexes (RISCs) (Fig.1.4; Hebert and De Strooper, 2009). Consequently, the RISC complex mediates post-transcriptional gene regulation by binding through imperfect base-pairing interactions with sequences in the 3’ UTR of target mRNAs in animals (Nahvi et al, 2009). This leads to a repression of protein
Figure 1.4 Biogenesis and mode of action of miRNAs in mammalian cells. Endogenously expressed
from the genome, miRNA genes are transcribed by DNA polymerase II (or III) to produce long (>1000 nucleotides [nt]) primary transcripts (pri-miRs) that resemble in structure classical mRNA (mRNA) molecules (i.e. possess a 50 cap and a polyA tail). These transcripts are further processed in the nucleus by the Drosha–DGCR8 enzymatic complex to generate a hairpin-like precursor miRNA (pre-miRNA). Once exported in the cytoplasm by exportin 5, the 70 nt pre-miRNA is a substrate for Dicer, which produces the mature 19–23 nt miRNA molecule (blue). Upon incorporation into the RISC complex, composed of argonaute and associated proteins, the miRNA ‘guide’ strand binds the 30UTR of target mRNA sequences (green) with partial complementarity, which leads to translation inhibition (possibly via deadenylation) or degradation. Adapted from Hebert and De Strooper, 2009.
Several models have been proposed for miRNA-mediated gene regulation, including repression of translation at the level of initiation at either the cap recognition stage or the 60S subunit joining stage, repression of translation at post-initiation level, proteolytic degradation of nascent polypeptides and miRNA mediated deadenylation followed by decapping and degradation of target mRNA (Filipowicz W. et al, 2008). However, the exact mechanisms underlying miRNA-mediated
1.5.2. Potential role of MicroRNAs in neurodegeneration
Several recent studies have reported exciting findings regarding differential expression of miRNAs in patients and models of many neurodegenerative disorders. These studies have focused on understanding the influence of miRNAs on both neuronal survival and the accumulation of toxic proteins that lead to neurodegeneration. Since increasing evidence indicates regulatory feedback loops between miRNAs and their targets, it is also relevant to study how these toxic proteins may affect miRNA expression.
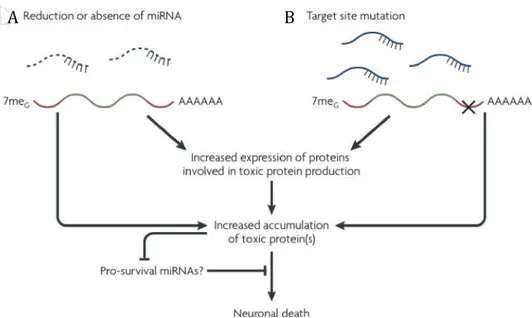
A common feature among many neurodegenerative diseases is the accumulation of mutant proteins with toxic properties that contribute to neuronal degeneration. Therefore, two mechanisms have been proposed to explain the role of microRNAs in neurodegeneration: reduction or absence of the microRNAs and mutation of a miRNA-binding site in the 3’untranslated region of a target mRNA (Eacker et al, 2009). These mechanisms would be predicted to prevent miRNA mediated repression
and lead to an increase of the target toxic proteins or proteins that are involved in the production of toxic proteins. The accumulation of toxic proteins is likely to cause neuronal death and also affects the expression of miRNAs responsible for the neuronal survival (Figure 1.5).
Figure 1.5 Proposed Mechanisms by which miRNAs could influence neurodegeneration. A) reduction or
absence of miRNAs. B) mutation of miRNA-binding site in the 3’untranslated region of a target mRNA.
Both mechanisms lead to increase of toxic proteins that cause neuronal death and affects the expression of
unidentified pro-survival miRNAs. Adapted from Eacker et al, 2009.
Several miRNA profiling studies have identified differentially expressed miRNAs in neurodegenerative diseases, including miR-29a/29b, miR-433, miR-133b and miR-9/9*. For instance, a correlation between lower expression of miR-29a/29b and higher expression of BACE1 was found in brains of patients with Alzheimer disease (AD), suggesting that miR-29 family might play a role in preventing the accumulation of toxic amyloid-ß peptide (APP) (Bettens et al, 2009). An example of a
miRNA that may be implicated in Parkinson disease (PD) is the miR-433 since a point mutation was found in the 3’ UTR of fibroblast growth factor 20 (FGF20) that disrupts the miR-433 binding site leading to an increased expression of α-synuclein (Wang et al, 2008). Moreover, a decrease in miR-9
expression was observed as Huntington’s disease (HD) progresses. It has been described that miR-9 may regulate the expression of proteins involved in neuronal survival through its interaction with RE1 silencing transcription factor (REST) and its co-repressor coREST (Packer et al, 2008).
1.5.3. Searching for microRNAs implicated in ALS
Despite recent studies providing some insight into how miRNAs may be involved in neurodegeneration, there is still very little information about deregulated miRNA expression associated with ALS.
The FUS/TLS and TARDBP/TDP43 ALS-linked proteins, interact with several proteins that are components of Drosha microRNA processing complexes, suggesting that they may be involved in the regulation of miRNA expression (Gregory et al, 2004; Ling et al, 2010).
Various studies identified several miRNAs specifically expressed in skeletal muscles such as miR-1, miR-133, miR-181, miR-214, and miR-206 (van Rooij et al, 2008). A recent study
investigated whether ALS progression in SOD1 G93A transgenic mice was accompanied by changes of miRNA expression in muscle. Williams et al found that from 320 miRNAs tested, the
miR-206 may be involved in a compensatory response to motor neuron injury that leads to regeneration of neuromuscular synapses and consequently delays ALS progression (Williams et al,
2009).
A recent study provided evidence that miRNA function is crucial in spinal motor neuron (SMN) diseases and highlighted the potential role of miR-9 in neurodegeneration (Haramati et al,
2010). It was observed that mice with miRNA dysfunction in spinal motor neurons (MNDicer mut
mice) showed features of spinal muscular atrophy (SMA) including sclerosis of the spinal cord ventral horns, myofiber atrophy and denervation. Moreover, the authors verified that the heavy neurofilament subunit is a target of miR-9, a miRNA that is specifically down-regulated in SMA. It has been reported that miR-9 with miR-124 plays a role in neuronal differentiation (Yu et al, 2008; Yoo et al,
2009).
1.6.
Background
In preliminary work, laser capture microdissection was performed to establish miRNA profiles in 40-day-old mice carrying the G93A SOD1 mouse mutation since the expression of miRNAs are highly expected to be changed as a secondary consequence of neurodegeneration and death in ALS. Using miRNA specific chips (TaqMan® Array MicroRNA Cards, Applied Biosystems) 2 miRNAs were identified, which were dramatically upregulated before disease onset. However, since RNA used in this preliminary work was very degraded, these results were not considered reliable.
1.7.
Aims of this thesis
The aims of this thesis were to:I.
Optimize Laser capture microdissection of spinal motor neurons in presymptomatic (P40) SOD1G93A mice.II.
Produce high quality RNA from laser captured cells.2.
Materials and Methods
2.1.
Animals
2.1.1.
SOD1
G93Atransgenic mice
The colony of mutant mice expressing the human SOD1 G93A transgene was derived from B6.Cg-Tg (SOD1*G93A) 1Gur/J mice purchased from Jackson Laboratories and was maintained by breeding male transgenic animals to female inbred mice C57BL/6J. Only male hemizygous transgenic mice were used for breeding since females carrying the SOD1 G93A mutation were shown to have reduced fertility (Ho Y.S. et al, 1998).
All the experiments were performed using female transgenic SOD1 G93A mice as gender has been shown to influence survival of SOD1 mutant mice (Heiman-Patterson TD et al, 2005). Six mice
at 40 days old (presymptomatic stage of ALS) were studied including SOD1 G93A transgenic mice (n=3) carrying the mutant form of human SOD1 (glycine to alanine substitution at position 93) and litter matched wild-type (WT) mice (n=3) that were used as controls to minimize genetic variation.
40-days-old SOD1
G93A transgenic and nontransgenic control littermates were sacrificed by CO2 asphyxiation in compliance with Schedule I of the UK Animals (Scientific Procedures) Act 1986. All procedures used on mice were carried out in the Oxford University Animal Facility.2.1.2.
Genotyping
The genotyping of SOD1G93A transgenic and WT mice was determined by analysis of DNA extracted from ear clips of mice younger than 40 days and from tail tips from 40-days-old mice. For DNA extraction, ear clips and tail tips (0.5cm) were digested in 100 and 200 μl DirectPCR Lysis Reagent (Viagen Biotech®) with 3 and 5 μl Proteinase K (15 mg/ml, Roche®), respectively. Lysis of tissue biopsies was performed overnight at 55°C. The lysates were then heated at 85°C for 45 min and centrifuged 10 min at 10,000 x g. The resulting supernatants were used in 25 μl PCR reactions.
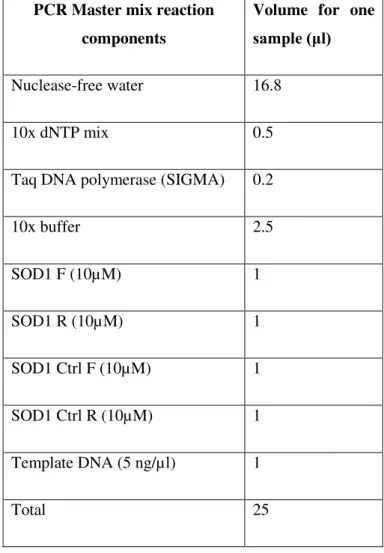
Table 2.1 Multiplex PCR Master mix reaction components for a final reaction volume of 25 μl
used
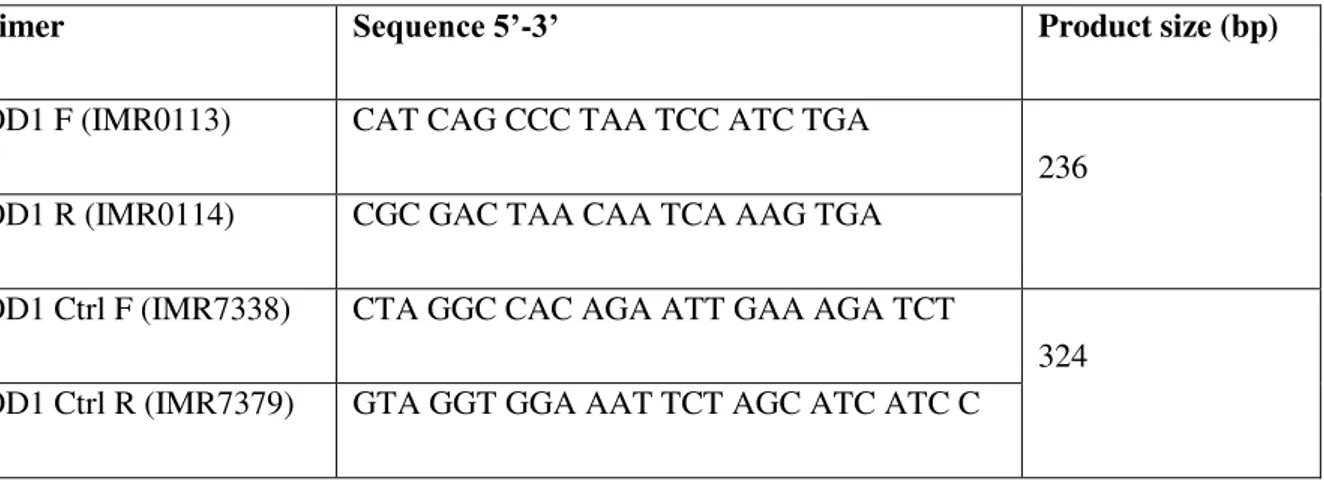
for genotyping SOD1 G93A mice and WT littermates.The primers for the transgene hSOD1 were IMR113 (forward) and IMR114 (reverse), which amplify a 236 base pair product. The primers for the gene mIL2 (internal positive control) were IMR042 (forward) and IMR043 (reverse), which amplify a 324 base pair product. The concentration of these primers was 10 µM and their sequences are indicated on table 2.2.
PCR Master mix reaction
components
Volume for one
sample (μl)
Nuclease-free water 16.8
10x dNTP mix 0.5
Taq DNA polymerase (SIGMA) 0.2
10x buffer 2.5
SOD1 F (10µM) 1
SOD1 R (10µM) 1
SOD1 Ctrl F (10µM) 1
SOD1 Ctrl R (10µM) 1
Template DNA (5 ng/µl) 1
Table 2.2 PCR primer pairs of transgene and internal positive control used for genotyping SOD1 G93A
mice and WT littermates.
Primer Sequence 5’-3’ Product size (bp)
SOD1 F (IMR0113) CAT CAG CCC TAA TCC ATC TGA
236
SOD1 R (IMR0114) CGC GAC TAA CAA TCA AAG TGA
SOD1 Ctrl F (IMR7338) CTA GGC CAC AGA ATT GAA AGA TCT
324
SOD1 Ctrl R (IMR7379) GTA GGT GGA AAT TCT AGC ATC ATC C
The PCR reaction was performed for 35 cycles in a DNA thermal cycler according to the cycling conditions specified on table 2.3.
Table 2.3 Cycling conditions used for genotyping SOD1 G93A mice and WT littermates.
Step Temperature ( °C) Time
Initial denaturation 95 3 min
Denaturation 95 30 s
Annealing 60 30 s (x35 cycles)
Elongation 72 45 s
Final Elongation 72 2 min
Hold 4 ∞
Electrophoresis of PCR products was performed in 1X TBE at 110V for 45 min and then visualized under Ultra-violet (UV) light illumination.
2.1.3.
Lumbar spinal cord dissection
After death, mice were quickly dissected to remove the whole vertebral column. RNase Zap (Ambion®) was used to clean all the instruments and working surfaces before use.
The spinal cord (SC) was extracted using a 20 ml syringe filled with GIBCO Phosphate Saline (PBS) pH 7.2 (Invitrogen®) with a 18-guage needle inserted into the vertebral column (Meikle A. D. and Martin A. H., 1981).
The SC was ejected at the cervical end of column vertebral by hydraulic pressure (figure 2.1) and then was cut in order to discard the cervical, thoracic and sacral tracts. The lumbar region of spinal cord was isolated since the ALS-like mice have clinical manifestation of hindlimb paralysis and spinal cord motor neuron degeneration (Gurney M.E. et al, 1994).
The isolated lumbar tract was embedding in optimal cutting temperature compound (OCT) compound, immediately frozen on dry ice and stored at -80°C until use. All procedures were conducted under strict RNase free conditions to avoid RNase contamination in all further experiments.
Figure 2.1 Spinal cord removal method from vertebral column of presymptomatic transgenic
2.2.
Histology
2.2.1.
Cryostat sectioning
The samples of OCT frozen SC were sectioned in the transversal plane (- 20ºC) at a thickness of 10 μm on a cryostat (Bright®) (previously cleaned with 100% ethanol). A maximum of 6 sections per slide were mounted onto 1.0 PEN (polyethylene naphthalate) membrane slides (Carl Zeiss®) required to perform Laser Capture Microdissection (LCM). These slides were previously treated with RNase Zap (Ambion®), washed in RNAse-free-water and air-dried in a decontaminated area.
Every effort was made in order to avoid RNA degradation by RNAses when handling tissue blocks, slides, and tissue sections.
2.2.2.
Fixation and Hydration
The sections were immediately fix and hydrate, after they were cut, by dipping up and down the slides in graded ethanol/water dilution series of 95%, 75% and 50% (for 30 s in each solution) at -20ºC. The ethanol solutions used were previously treated with ProtectRNA™ RNase Inhibitor (Sigma®).
2.2.3.
Cresyl violet staining
The sections were stained with 1% cresyl violet for 45 seconds. The stain was prepared by dissolving cresyl violet acetate powder (Sigma®, C1791) in 50% ethanol/RNase free water. The prepared cresyl violet was then heated at 55ºC for ~2 hour and kept rotating overnight at room temperature in order to complete dissolve and filtered before use.
2.2.4.
Washing and Dehydration
The slides were further treated with xylene for 30 s and 5 min and allowed to air dry for 3–5 min at room temperature. The prepared slides with fresh sections were transported straight away in a box containing drying perls Orange (heavy metal free) (Sigma®) to the LCM room.
2.3.
Laser Capture Microdissection (LCM)
Laser Capture Microdissection (LCM) is a technique for isolating highly pure cell populations of specific morphologically identical cells from a heterogeneous tissue section. The LCM system was developed during the mid 1990s by Dr Emmert-Buck and his colleagues at the National Institutes of Health, USA (Emmert-Buck et al, 1996).
Biological tissues are complex heterogeneous structures composed of many cell types, which are morphologically and functionally distinct. The analysis of whole tissue samples lead to results usually determined by the major or predominant cell type, which may difficult to uncover relevant changes occurring in a particular type of cells. Therefore, it is crucial to analyze specific cell types in order to obtain significant data to identify and characterize biological processes. LCM has been very relevant for obtaining specific groups of cells, when the cell type of interest forms only a small proportion of the cells present in a tissue, allowing pure, homogeneous sample preparation and increasing the accuracy of molecular analysis.
LCM system includes a microscope connected to a computer for laser control and where tissue sections are visualized and cells of interest are selected to be collected. This system utilizes a narrow beam UV laser (less than 1 µm in diameter) to cut around the selected cells with a high degree of accuracy and precision. A pulse from microdissection laser and pressure catapulting system is then used to catapult the dissected cells into a collection tube cap (Kuhn et al., 2006; Murray GI., 2007).
Since motor neurons represent only 10% of spinal cord cells (Schaffner et al., 1983), in the present study, LCM was performed to obtain pure populations of motor neurons.
LCM was carried out immediately after preparation of SC sections in order to isolate motor neurons that were identified by location in ventral horn using 5x amplification and by size (at least 25µm in diameter) (Perrin FE et al, 2005) using 40x amplification.
The whole process of SC sections preparation followed straight away by LCM was repeated until a total of 600 motor neurons were collected per sample.
2.4.
miRNA/RNA extraction
Total RNA (including miRNA) was extracted using RNAqueous-Micro Kit (Ambion®) following manufacturer's protocol from 600 cells (200 pooled together) in 100 μl volume of lysis solution for each sample of a total of 6 samples (3 SOD1 G93A and 3 WT).
The lysate was mixed with 1.25 volumes of ethanol to recover large and small RNAs including tRNAs, 5S rRNA and microRNAs. The extracted RNA was then treated with DNase to remove trace amounts of genomic DNA.
2.5.
RNA quantification and quality control
RNA concentration was determined using a Quant-iT RiboGreen RNA reagent kit (Invitrogen®) according to the manufacturer's instructions. Quant-iTTM RiboGreen RNA reagent is an
ultrasensitive fluorescent nucleic acid stain that allows the quantitation of as little as 1 ng/mL RNA with a fluorescence microplate reader and fluorometer using fluorescein excitation and emission wavelengths (Jones L.J. et al, 1998). The use of this reagent avoid the major disadvantages of the most commonly used absorbance-based method for nucleic acid quantitation (determination of absorbance at 260 nm), such as large relative contribution of proteins and free nucleotides to the signal, the interference caused by contaminants and the relative insensitivity of the assay (an A260 of 0.1
corresponds to a 4 μg/mL RNA solution). Fluorescence of each sample was measured using the same instrument parameters to those used when generating the standard curve. To minimize photobleaching effects, the time for fluorescence measurement was kept constant for all samples. The fluorescence value of the reagent blank was subtracted from that of each sample. Corrected data was used to generate a standard curve of fluorescence versus DNA concentration. RNA concentration of each sample was determined from the standard curve generated.
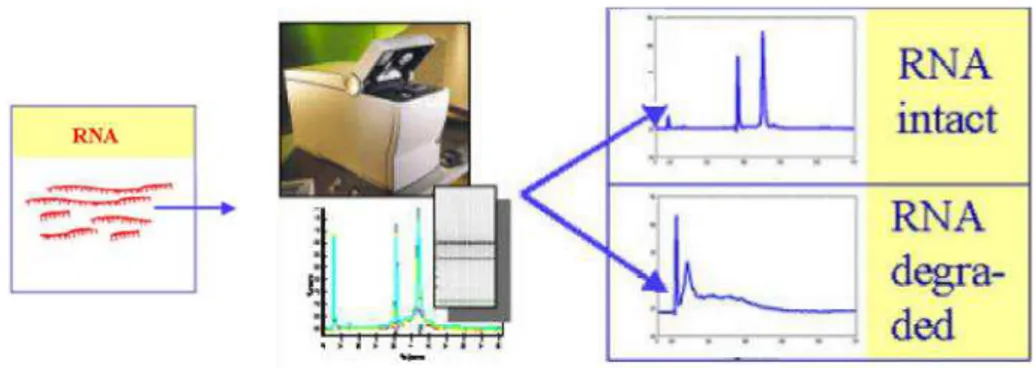
Number (RIN) were automatically generated by Bioanalyzer 2100 software. RIN number is determined from the shape of the curve in the electropherogram, in order to get a robust and reliable prediction of RNA quality not only based on 28S/18S ratios but also taking other critical characteristics of several regions of the recorded electropherogram into account. The RIN software algorithm allows the classification of total RNA on a numbering system from 1 to 10, with 1 being the most degraded profile and 10 being the most intact (Schroeder A. et al, 2006) (Fig.2.2).
Figure 2.2 RNA quality of extracted total RNA measured using Agilent 2100 bioanalyzer. The
distinction with regard to integrity was based 28S/18S ratios and RIN of each sample. Example electropherograms from intact RNA sample showing high 18S and 28S rRNA and degraded RNA samples showing elevated threshold baseline and a shift in the RNA size distribution toward smaller fragments (Figure adapted from Schroeder A. et al, 2006).
2.6.
Reverse transcription and quantitative PCR (RT-qPCR)
For miRNA cDNA synthesis, miRNA reverse transcription (RT) was conducted using the TaqMan MicroRNA reverse transcription kit (Applied Biosystems®), according to manufacturer’s protocol.
2.6.1.
RT-qPCR TaqMan MicroRNA Assays
The TaqMan® real-time RT–PCR for miRNA quantification was performed in two steps: RT and real- time PCR schematically represented in Fig. 2.3 (Chen C. et al, 2005).
In the RT step, cDNA was reverse transcribed from total RNA samples using commercially available specific stem-loop miRNA primers from the TaqMan® MicroRNA Assays and reagents from the TaqMan® MicroRNA Reverse Transcription Kit. The stem–loop RT primers bind to the 3’ end of miRNA molecule that is reverse transcribed to cDNA with a reverse transcriptase.
The TaqMan® MicroRNA assays and MultiScribeTM Reverse Transcriptase were used to prepare each 15 μl RT reaction master mix consisting of 7 μl master mix, 3 μl of each primer and 5 μl total RNA (table 2.4).
Table 2.4 RT reaction master mix components in a final volume of 15 μl including 7 μl master mix, 3
μl of each primer and 5 μl total RNA.
The parameter values used to program the thermal cycler to perform RT reaction are specified on table 2.5.
RT Master mix components Volume for one sample
(μl)/ 15 μl reaction
100mM dNTPs (with dTTP) 0.15
MultiScribeTM Reverse Transcriptase, 50 U/μL 1.00
10 Reverse Transcription Buffer 1.50
RNase Inhibitor, 20U/μL 0.19
Nuclease-free water 4.16
Table 2.5 Cycling conditions to perform RT reaction followed by qPCR.
Temperature (ºC) Time (min) Stage
16 30 Hold
42 30 Hold
85 5 Hold
4 ∞ Hold
In the real time PCR step, the RT product is amplified using TaqMan® Universal PCR Master Mix together with TaqMan® PCR assay that includes miRNA-specific forward primer, reverse primer and TaqMan® probes. The TaqMan® probes contain at the 5′ end a reporter dye (FAMTM dye) and at 3’ end a minor groove binder (MGB) and a nonfluorescent quencher (NFQ). The TaqMan® probe anneals specifically to the complementary target sequence between the forward and reverse primer sites. The cleavage of probes hybridized to the target by the DNA polymerase separates the reporter dye from the quencher dye resulting in increased fluorescence by the reporter.
Figure 2.3 Schematic description of RT–PCR TaqMan® MicroRNA Assay chemistry including two
To evaluate the primers efficiency, qPCR was performed using serial dilutions of cDNA. The log-transformed cDNA input was plotted against Ct values (cycle threshold, which is a cycle number based on the point where the fluorescence response rises above the background level and is measured in the exponential phase) and the slope of the resulting curve was then used to calculate the efficiency (E) according to equation E = (10-1/slope– 1) x 100.
The real time PCR reactions were performed in triplicate using Taqman® 2X Universal PCR Master Mix (Applied Biosystems®) in a final volume of 20μL (table 2.6), according to the manufacturer’s protocol.
Table 2.6 Real-time PCR reaction mixture components.
The cycling conditions used to perform real-time PCR on a StepOnePlus Real-time PCR machine (Applied Biosystems®) are shown on table 2.7.
Component Volume (μL) / 20-μL
Reaction
TaqMan® MicroRNA Assay (20) 1.00
Product from RT reaction 1.33
TaqMan® 2 Universal PCR Master Mix, No AmpErase UNGa
10.00
Nuclease-free water 7.67
Table 2.7 Parameter values used to program the thermal cycler to perform real-time PCR.
The relative expression of miRNAs was determined using the comparative Ct method. The Ct values of both the calibrator and the samples of interest were normalized to endogenous control (ΔCt = Ct Target - CtEndogenous Control). The ΔCt values were normalized relatively to a control or calibrator (ΔΔCt = ΔCt Sample - ΔCt Calibrator). The 2-ΔΔ Ct value was then determined for each sample. The endogenous controls used in all the experiments for quantifying mature miRNA expression were sno-RNA234 and snoRNA-202 that showed the least variation across all tissue samples and cell lysates. Three biological and triplicates were utilized in all experiments.
2.6.2.
RT-qPCR Megaplex
TMPool with cDNA preamplification step
Relative quantitation using Megaplex TM Pools was performed in three steps: RT-PCR, preamplification and real-time PCR.
In the RT step, cDNA was reverse transcribed from total RNA samples, using RT Megaplex TM primers and reagents from TaqMan MicroRNA Reverse Transcription Kit. Megaplex TM RT Rodent
primer pools A and B (TaqMan) allow reverse transcription of 375 miRNAs each (figure S1) and 6 controls including Mamm U6 were used to perform RT reaction followed by a preamplification step of cDNA. Megaplex TM RT were performed with 3 μL of total RNA (1 ng/µL) and 4.5 μL of Megaplex TM RT reaction (components shown on table 2.8).
Step Temperature (°C) Time Step
Enzyme activation 95 10 min Hold
Denaturation 95 15 sec
40 cycles
Table 2.8 RT reaction Mix components in final reaction volume of 7.5 μl
.
Megaplex TM RT reaction was performed using the cycling conditions indicated on table 2.9 and was followed by a preamplification step prior to qPCR.
Table 2.9 Cycling conditions used for Megaplex TM RT reaction.
Temperature Time Stage
16 °C 2 min
Cycle (40 cycles)
42 °C 1min
50 °C 1 sec
85 °C 5 min Hold
4 °C ∞ Hold
RT reaction Mix components Volume for one sample
(μl)/ 15 μl reaction
Megaplex TM RT Primers (10x) 0.80
dNTPs with dTTP (100 mM) 0.20
MultiScribe Reverse Transcriptase (50 U/μL) 1.50
10x RT Buffer 0.80
MgCl2 (25 mM) 0.90
RNase Inhibitor (20 U/μL) 0.10
Nuclease-free water 0.20
In the preamplification step, PCR products were uniformly amplified from cDNA templates using the Megaplex TM PreAmp Primers and the TaqMan PreAmp Master Mix in a 22.5 μl reaction (components are described on table 2.10) and the cycling conditions presented on table 2.11.)
Table 2.10 PreAmp Reaction Mix Components.
Table 2.11 PreAmp Reaction Mix Cycling conditions.
PreAmp Reaction Mix Components Volume for one
sample (μl)
TaqMan® PreAmp Master Mix, 2x 12.5
Megaplex TM PreAmp Primers (10X) 2.5
Nuclease-free water 7.5
Total 22.5
Stage Temp (°C) Time
Hold 95 10 min
Hold 55 2 min
Hold 72 2 min
Cycle (12 Cycles)
95 15 sec
60 4 min
Hold (a) 99.9 10 min
(a) This step was required for enzyme inactivation
3.
Results
3.1.
Genotyping of WT and SOD1
G93AMice Littermates
The mice littermates in each new generation were successfully genotyped by identification of the PCR products size.
Figure 3.1 shows one of the genotyping experiments performed. SOD1G93A transgenic mice were efficiently distinguished from WT by originating PCR products of the expected characteristic size. The use of a 100pb DNA ladder as a mass and size standard during electrophoresis allowed the estimation of the fragment band sizes. The presence of the transgene (SOD1) was identified by 236bp band and the reference gene (mIL2) was identified by 324bp band. From 5 samples of mice littermates, 3 were identified as SOD1G93A transgenic mice and 2 as WT. The absence of bands for negative control shows there was no contamination.
Once distinguished which ones were WT and SOD1G93A transgenic mice, 3 of each were subsequently used for the experiments.
Figure 3.1
Ethidium bromide–stained 1.5% agarose gel for genotyping of 5 samples from mice littermates. Lane 1: 100 bp marker ladder; lanes 2 and 3: SOD1G93A positive controls (236bp).;lanes 4 and 5: WT positive controls (324bp).; lane 6: negative control; lane 7-11: 5 samples (3 WT
3.2.
Motor Neurons Isolation by LCM
To study the differential miRNA expression that may occur during early events of ALS and eventually predispose or trigger motor neuron degeneration, it was necessary to use LCM in order to isolate motor neurons from lumbar spinal cord.
Spinal cord samples were successfully sectioned and stained with clear histological results as shown on Fig.3.2, allowing motor neurons identification.
As expected in a presymptomatic stage of ALS, there were no evident differences in number and morphology of motor neurons between 40-day-old WT and SOD1G93A mice. Approximately 40-60 motor neurons were found in the ventral horn of spinal cord (Fig.3.2 B and F) with a diameter between 25 and 50 µm (C and G). Morphology of motor neurons appeared similar in both WT and mutant mice, showing classical neuronal features including a large cell body (soma) with a single nucleus and no signs of neurodegeneration (Fig. 3.2 C and G).
Starting with low amount of LCM cells may strongly compromise the results of downstream applications. The Applied Biosystems TaqMan microRNA Array and qPCR require a minimum quantify of 1ng starting total RNA. It was reported in the literature that a total of 500 cells is expected to yield around 5 ng of total RNA (Perrin et al, 2005; Ferraiuolo et al, 2007).Therefore,
Figure 3.2 Laser Capture Microdissection (LCM) of motor neurons from1% cresyl violet stained
lumbar spinal cord (SC) sections of 40-day-old SOD1G93A (A, B, C, D) and WT (E, F, G, H) mice. (A, E) SC sections prior to LCM. (B, F) SC sections (A) and (E) after capture of motor neurons
localized in the ventral horn. (C, G) Selected motor neurons for LCM showing a diameter at least
of 25 µm.(D, H) SC after capture of motor neurons (higher magnification of (B) and (F)). Pictures
were taken at 5x magnification (A, E, B, F) and 40x magnification (C, D, G, H). Scale bar represents 25 µm in (C, D, G, H) and 200 µm in (A, B, E, F). Morphology of motor neurons was similar in WT and SOD1G93A SC with no signs of degeneration.
Pre-LCM
Post-LCM
D
C
B
A
G
H
3.3.
RNA Quantity and Quality Assessment
3.3.1.
Quantity of total RNA was accurately determined by RiboGreen Assay
Quantification of RNA is essential to check RNA quality prior to the following experiments. To ensure that enough RNA yield was obtain after total RNA extraction from microdissected motor neurons, RNA quantity was measured via NanoDrop (ND) 1000 spectrophotometer, Quanti-iT Ribo Green Assay and Agilent 2100 Bioanalyzer.
Although Agilent 2100 Bioanalyzer can determine both integrity and quantity of RNA, it has been considered a quantification method that exhibits lower precision and accuracy than Quanti-iT Ribo Green Assay and ND-1000 spectrophotometer in 0.05 –500 ng/μl range (Aranda R. et al, 2009).
Therefore, to ensure that enough RNA yield was obtain after total RNA extraction from microdissected motor neurons, RNA quantity was measured in the 0-10 ng/µl range via ND-1000 spectrophotometer and Quanti-iT Ribo Green Assay. RNA samples from three sections after LCM were used to test these two quantification methods in different dilutions in a 0.25-1 ng/μl range.
The low-range standard curve used to estimate the RNA concentration using Quanti-iT Ribo Green Assay was consider linear since it showed a correlation coefficient (R2) ≥ 0.995 (Fig. 3.3). This curve was traced using the fluorescence values showed on table 3.1.
Table 3.1 RFU corrected values and RNA concentration of RNA standard sample in a final volume
assay of 200μl.
RNA standard RFU
RNA standad RFU
corrected
[RNA standard]
(ng/200μl)
65000 59526 10
64443 58969 8
51381 45907 6
34279 28805 4
20799 15325 2
12701 7227 1
9838 4364 0.5
Figure 3.3 Standard curve for RNA concentration using RiboGreen assay.
Results using RNA samples in a 0.25-1ng/μl range showed that Quanti-iT Ribo Green Assay was more accurate than NanoDrop in measure small amounts of RNA (Table 3.2).
Table 3.2 RFU corrected values and RNA concentration of RNA ([RNAinitial]=5.7 ng/μl diluted to
1ng/μl) sample in a final volume assay 200μl.
Moreover, it has been previously reported in literature that Quanti-iT Ribo Green Assay exhibits high precision and accuracy in a 1-0.05 ng/μl range, while NanoDrop demonstrates this in a
RNA RFUa [RNA ]
(ng/200µl) [RNA ] (ng/200µl) RiboGreen Assay [RNA] (ng/200µl) NanoDrop
6636 1 0.91 1.99
8007 1 1.06 1.63
5712 0.5 0.75 1.50
4595 0.5 0.60 1.61
3884 0.25 0.40 1.34
3513 0.25 0.35 1.43
ablank corrected values
y = 7411,3x + 179,09 R² = 0,999
0 10000 20000 30000 40000 50000 60000 70000
0 2 4 6 8 10 12
RF
U
RNA concentration (ng/ul)


![Figure 1.4 Biogenesis and mode of action of miRNAs in mammalian cells. Endogenously expressed from the genome, miRNA genes are transcribed by DNA polymerase II (or III) to produce long (>1000 nucleotides [nt]) primary transcripts (](https://thumb-eu.123doks.com/thumbv2/123dok_br/16675584.742911/34.892.243.551.100.447/biogenesis-mammalian-endogenously-expressed-transcribed-polymerase-nucleotides-transcripts.webp)