i
Cristiana Carvalho Pinheiro
Licenciada em Bioquímica
Exopolysaccharide production by
Enterobacter
A47: optimization of cultivation
conditions and study of polymer functional
properties
Dissertação para obtenção do Grau de Mestre em Biotecnologia
Orientadora: Doutora Maria Filomena Freitas
Co-
orientadora: Prof. Doutora Maria d’Ascensão Reis
Júri:
ii Exopolysaccharide production by Enterobacter A47: optimization of cultivation conditions and study of polymer functional properties
Copyright ® Cristiana Carvalho Pinheiro, Faculdade de Ciências e Tecnologia, Universidade Nova de Lisboa.
iii The Masters thesis has been one of the most significant and challenging academic achievements that I had to come across with.
Without the support, patience and guidance from my supervisor Dr. Filomena Freitas, I would never have been able to finish my dissertation, and for that I am truly grateful.
I would like to thank my co-advisor, Dr. Ascensão Reis, for providing me with a dynamic and joyful lab team as well as a well-equipped workplace, which without them would certainly be much more difficult to do research.
For both Dr. Filomena Freitas and Dr. Ascensão Reis, I would like to express my sincere thanks, for giving me a huge opportunity to do science abroad.
I would like to express my gratitude to Dr. VÍtor Alves and the Instituto Superior de Agronomia, for having available the equipment needed to perform the rheology measurements and the films characterization.
My gratefulness goes also to my fellow co-workers, Sílvia, Margarida, Cristiana Torres and Inês that were always willing to help me, and for their interesting discussions and motivating conversations. And I could not stop thanking to my friends, Diana and Cristiana Morais, who helped me on a daily basis.
v O FucoPol é um biopolímero de elevado conteúdo em fucose, produzido pela bactéria Enterobacter A47 DSM 23139. Trata-se de um exopolissacárido microbiano (EPS) cuja composição engloba açúcares neutros (fucose, galactose, glucose), açúcar acídico (ácido glucurónico), e ainda grupos acilo substituintes (acetato, piruvato e succinato).
No âmbito deste trabalho foram considerados dois objectivos principais: a optimização da produção de EPS e o estudo das propriedades funcionais de diversos polímeros produzidos pela Enterobacter A47. No estudo da optimização do FucoPol, foi avaliado tanto o efeito do oxigénio dissolvido em diferentes concentrações (10, 30 e 60%), como o impacto da redução de concentração de fosfato no meio de cultura. Desta forma, não só foi possível observar o efeito de ambos os parâmetros no crescimento celular e na capacidade produtiva bacteriana, como também, a sua influência na composição química do EPS. A produção máxima de EPS (6.11 g L-1)foi obtida a 10% de oxigénio dissolvido, e, embora a redução de fosfato no meio de cultivo não tenha influenciado a capacidade produtiva bacteriana, esta originou uma diminuição do conteúdo em fucose até 24%mol.
Posteriormente, foram avaliadas as propriedades funcionais de exopolissacáridos produzidos pela Enterobacter A47, a diferentes condições de cultivo. A maioria dos polímeros evidenciou um comportamento reofluidificante, atingindo maior viscosidade aparente (0.2 - 0.3 Pa.s) a menores taxas de escoamento (0.3 a 1 s-1) para os polímeros EPS-g, EPS-s e GNEX. Também na sua maioria, os polímeros apresentaram capacidade para formar e estabilizar emulsões a diferentes temperaturas. Relativamente à capacidade filmogénica, EPS-s, EPS-g e EPS-x demonstraram boas propriedades mecânicas juntamente com elevada permeabilidade ao vapor de água. Todos os polímeros demonstraram actividade floculante à concentração de 0.01%, sendo esta substancialmente diminuída a uma menor concentração de EPS (0.001%).
vii FucoPol is a fucose-containing biopolymer produced by the bacterium Gram-negative, Enterobacter A47 DSM 23139. It is an exopolysaccharide (EPS) composed of neutral sugars (fucose, galactose, glucose), an acidic sugar (glucuronic acid), and also non-saccharide substituents (acetate, pyruvate and succinate).
In this work, two primary objectives were considered: the optimization of EPS production
by varying two different parameters, and the functional properties’ assessment of different
EPS produced by the bacterium. In the optimization study, the influence of different dissolved oxygen concentrations (controlled at 10, 30 and 60% of air saturation), and the impact of phosphate concentration reduction in the culture medium (5.25 and 3.81 g L-1) were assessed. The objective was to evaluate not only the effect of both parameters on cellular growth and exopolysaccharide-synthesis, but also to determine their influence in EPS chemical composition. The best results were obtained with DO at 10%, with the highest EPS production (6.11 g L-1), and although a reduction of phosphate concentration didn’t affect the EPS production, it reduced the exopolysaccharide’s fucose content to 24%mol.
Secondly, the functional properties of nine distinct exopolysaccharides synthesized by Enterobacter A47 under different cultivation conditions were evaluated. Rheologically, most of the EPS polymer solutions showed shear-thinning behavior, wherein EPS-s, EPS-g and GNEX achieved the highest apparent viscosity (0.2 - 0.3 Pa.s) at lower shear rates (0.3 to 1 s-1). Also, most of the polymers presented emulsifying capacity at different temperatures. Concerning the film-forming capacity, EPS-s, EPS-g and EPS-x films demonstrated to have good mechanical properties and high water vapour permeability. And, all polymers described flocculating activity at 0.01% of EPS, which was significantly diminished at lower concentration, 0.001%.
ix
Acknowledgements... iii
Resumo... v
Abstract ... vii
Index... ix
Nomenclature ... xv
1. Introduction ... 1
1.1 Substrate ... 2
1.2 Exopolysaccharide composition ... 3
1.3 Exopolysaccharide structure ... 4
1.4 Bacterial biosynthetic pathways ... 5
1.5 Exopolysaccharides properties ... 5
1.5.1 Rheological properties ... 6
1.5.2 Emulsion forming and stabilizing capacity ... 8
1.5.3 Flocculation capacity ... 9
1.5.4 Film-forming capacity... 9
1.6 FucoPol... 10
2 Motivation ... 13
3 Materials and Methods ... 15
3.1 EPS Production ... 15
3.1.1 Microorganism ... 15
3.1.2 Cultivation Media... 15
3.1.3 Inocula preparation... 15
3.1.4 Shake Flasks Assays ... 16
3.1.5 Bioreactor cultivation assays ... 16
3.2 Exopolysaccharide Extraction... 17
3.3 Analytical Techniques ... 17
3.3.1 Apparent Viscosity ... 17
3.3.2 Cell Dry Weight ... 18
3.3.3 Ammonium concentration ... 18
3.3.4 Glycerol concentration ... 18
x
3.4.3 Product and Biomass Yield ... 19
3.5 Chemical Characterization of the Polymers ... 19
3.5.1 Elemental Analysis ... 19
3.5.2 Exopolysaccharide Composition ... 19
3.6 Functional Properties... 22
3.6.1 Rheological Properties ... 22
3.6.2 Film-forming capacity... 22
3.6.3 Emulsion forming and stabilizing capacity ... 23
3.6.4 Flocculation capacity ... 24
4 EPS Production by Enterobacter A47 ... 27
4.1 Effect of Dissolved Oxygen Concentration ... 27
4.1.1 Cultivation Assays ... 27
4.1.2 EPS Chemical characterization ... 34
4.2 Effect of Phosphate Concentration ... 36
4.2.1 Shake flasks assays ... 36
4.2.2 Bioreactor Cultivation assays ... 37
4.2.3 EPS Chemical characterization ... 41
5 Functional Properties of the EPS synthesized by Enterobacter A47 ... 43
5.1 Rheological properties ... 43
5.2 Film-forming capacity ... 47
5.2.1 Tensile tests ... 48
5.2.2 Water Vapour Permeability ... 51
5.3 Emulsifying capacity ... 53
5.3.1 Freezing and Thawing Stability ... 57
5.3.2 Thermal Stability ... 58
5.4 Flocculating capacity ... 60
6 Conclusion and Future Work ... 63
xi Fig. 1.1 – Bacterial external structure representation and its circular DNA molecule identified as
circular chromosome. ... 1
Fig. 1.2 - The ideal repeating unit of xanthan as reported by Jansson et al. 1975. ... 4
Fig. 1.3 - Gellan structure: repeating units of D-glucose, D-glucuronic acid, D-glucose, and L-rhamnose ... 4
Fig. 1.4 - Catabolic mechanism representing the sugar nucleotide synthesis and the interconversion of various monosaccharides through epimerization, dehydrogenation and decarboxylation, occurred in the cell cytoplasm. (Kumar et al. 2007). ... 5
Fig. 1.5 - Flow curves corresponding to different types of liquid behavior: Newtonian fluids and non-Newtonian fluids. ... 7
Fig. 1.6 - Frequency sweep graphic, representing both elastic (G’) and viscous (G’’) modulus at fixed stress and temperature. ... 8
Fig. 1.7 - An emulsion vs an unblended oil-water liquid system. ... 8
Fig. 1.8 – Representation of the water treatment steps (an example). ... 9
Fig. 1.9 - Soluble soybean polysaccharide based film. ... 10
Fig. 1.10 - Enterobacter A47 (DSM 23139) rod-shaped morphology. ... 10
Fig. 1.11 – Freeze-dried biopolymer, FucoPol, produced by Enterobacter A47 (DSM 23139). ... 10
Fig. 4.1 - Cultivation profiles for Enterobacter A47 with dissolved oxygen concentration controlled at 10% (A), 30% (B) and 60% (C) air saturation... 29
Fig. 4.2 - Apparent viscosity of the culture broth during cultivation of Enterobacter A47 with DO controlled at 10%, measured at shear rates of 0.3 – 11.2 s-1. ... 30
Fig. 4.3 - Apparent viscosity of the culture broth during cultivation of Enterobacter A47 with DO controlled at 30%, measured at shear rates of 0.3 – 11.2 s-1. ... 31
Fig. 4.4 - Apparent viscosity of the culture broth during cultivation of Enterobacter A47 with DO controlled at 60%, measured at shear rates of 1.4 – 11.2 s-1. ... 32
Fig. 4.5 - Optical density of Enterobacter A47 grown in the shake flasks assays, for 47h, with different phosphate concentrations: 8.12 g L-1 (Experiment A); 5.25 g L-1 (Experiment B); 3.81 g L-1 (Experiment C); 3.09 g L-1 (Experiment D); 2.95 g L-1 (Experiment E) and 2.37 g L-1 (Experiment F). ... 36
Fig. 4.6 - Cultivation profiles for Enterobacter A47 with dissolved oxygen concentration controlled at 10% air saturation and phosphate concentrations: 5.25 g L-1 (A) and 3.81 g L-1 (B). ... 38
Fig. 4.7 - Apparent viscosity of the culture broth during cultivation of Enterobacter A47 with different phosphate concentrations: 5.25 g L-1 and 3.81 g L-1, measured at shear rates of 0.3 – 11.2 s-1. ... 40
Fig. 5.1 - Comparative flow curves of the different exopolysaccharides produced by Enterobacter A47. The measurements were made at 25 °C, with 1% (w/w) of EPS aqueous solutions in 0.1 M NaCl. ... 43
xii Fig. 5.4 - Films made from specific exopolysaccharides produced by Enterobacter A47, which presented film-forming capacity using an aqueous solution of 1.25 % (w/v), with presence of 30% of glycerol 99% as plasticizer. ... 48 Fig. 5.5 - Assembly of the film in the TA-Xtplus texture analyser at rest and visualization of
film’s rupture as result of the tensile experiments. ... 49 Fig. 5.6 - Representation of the tensile tests, F vs distance, of the EPS-s, EPs-g and EPS-x films. ... 49 Fig. 5.7 - Schematics of the water vapour permeability’s equipment: (A) vial; (B) vial with
xiii Table 1 - Phosphate concentrations of the different experiments in the shake flasks assays. ... 16 Table 2 - Biopolymers description including cultivation conditions and physical
characterization. Biopolymers produced by Enterobacter A47 ... 25 Table 3 - Kinetic parameters for the cultivation of Enterobacter A47 with dissolved oxygen concentration controlled at different air saturation values. ... 33 Table 4 - Exopolysaccharide sugar and acyl’s composition. ... 34 Table 5 –Exopolysaccharide’s elemental analysis and its water, protein and inorganic residues
content. ... 35 Table 6 - Kinetic parameters for the cultivation of Enterobacter A47 in medium supplemented with different phosphate concentrations. ... 40 Table 7 - Exopolysaccharide sugar and acyl composition of the different phosphate
xv Acronyms
CDW (g L-1) Cell dry weight DO (%) Dissolved oxygen EPS (g L-1) Exopolysaccharide
GRP Glycerol-rich product
vvm Volume of gas per volume of liquid per minute
Kinectic
parameters
µ (h-1) Specific growth rate
ΥX/S (gcell gglycerol-1) Yield of biomass on glycerol
1
1.
Introduction
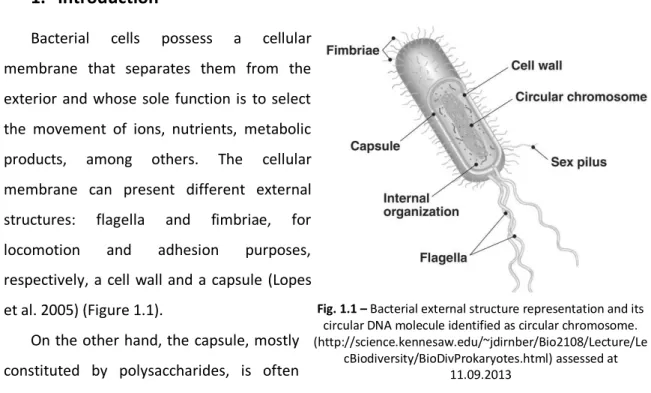
Bacterial cells possess a cellular membrane that separates them from the exterior and whose sole function is to select the movement of ions, nutrients, metabolic products, among others. The cellular membrane can present different external structures: flagella and fimbriae, for locomotion and adhesion purposes, respectively, a cell wall and a capsule (Lopes et al. 2005) (Figure 1.1).
On the other hand, the capsule, mostly constituted by polysaccharides, is often
associated to the cell’s protective response towards external factors (Lopes et al. 2005). Its physiological roles can vary from desiccation protection due to its high water content, protection against predatory microorganisms or even blockage of other microorganisms’ interactions. The capsule can be highly structured, being associated with the cell surface membrane and may be covalently bound to it, or highly disorganised, resulting into a slime layer of extracellular polymer, loosely bound to the cell surface (Vanhooren et al. 1998). The later, are known as extracellular polysaccharides or exopolysaccharides (EPS) and their different structural organization is dependent on the specific bacterial secretion systems (Whitney et al. 2013).
The EPS are hydrophilic and high molecular weight polymers, mainly composed of carbohydrates, with glucose, galactose and mannose being the most common monomers, wherein neutral sugars (e.g. rhamnose and fucose), some uronic acids (mainly glucuronic and galacturonic acids) and aminosugars (N-acetylamino sugars) are also frequently present. Bacterial EPS might also contain non-sugar functional groups, like ester-linked and ketal-linked pyruvate as organic substituents (Sutherland 1994).
Polysaccharides can be derived from many natural sources. They may be plant based (e.g. guar gum, arabic gum, starch and pectins), marine originated (e.g. carrageenan and alginate), animal originated (e.g. chitin and chitosan) or of microbial origin (e.g. xanthan, gelan, pullulan and bacterial alginate) (Kaur et al. 2012).
Microorganisms are found to be more advantageous than plants, crustacean and algae for exopolysaccharide production, due to their intrinsic characteristics. Bacteria usually have Fig. 1.1 – Bacterial external structure representation and its circular DNA molecule identified as circular chromosome. (http://science.kennesaw.edu/~jdirnber/Bio2108/Lecture/Le
2 higher specific growth rates and allow manipulation of the growth conditions for improving fermentation yields, productivity and biopolymer’s properties (Freitas et al. 2009a).
Many Gram-negative EPS-producing bacterial species have been reported in the literature over the last decades. For example, Azotobacter vinelandii (Sabra et al. 1999), Agrobacterium sp. (Lee et al. 1999), Sphingomonas paucimobilis (Ashtaputre et al. 1995) and Xanthomonas campestris (Liakopoulou-Kyriakides et al. 1999) and their products have gainned considerable commercial interest in the past few years.
These biopolymers possess numerous properties depending on their chemical composition, molecular structure, average molecular weight, and distribution. The main properties of polysaccharides that are relevant for their industrial development include rheology modifier of aqueous solutions, gel-forming ability, and emulsifying and/or flocculating capacity, among others. As such, they can be valorized into food, pharmaceuticals, cosmetics and agriculture applications, just to name a few (Freitas et al. 2011a).
1.1
Substrate
The major limitation for EPS production at large scale is their inherent production costs. For this reason expensive substrates (e.g. refined sugars as glucose, sucrose, etc. ) usually used in microbial EPS production are being replaced by some manufactures by cheaper and more accessible substrates, like waste residues or agro-industrial by-products, in order to have more cost-effective processes (Du et al. 2011).
Biodiesel is a well-known biofuel that has been contributing to the worldwide bioenergy production scenario, with a significant share of the renewable sources. It is originated by the transesterification of vegetable oils and animal fats in the presence of a catalyst, through a primary alcohol (usually methanol or ethanol), leading to the product formation of fatty acid methyl esters, FAMES (Rywinska et al. 2013), along with a major by-product formation, crude glycerol.
3 The main disadvantages of crude glycerol for use in several of the glycerol traditional applications rely on its variable composition and lower purity degree associated to contaminants. Crude glycerol contains several impurities, such as fat and protein contents ranging from 1 to 13 % and 0.06 to 0.44 %, respectively, whereas metals (Ca2+, K+, Mg2+) and other macroelements (P and S) are commonly present in smaller concentrations, from 4 to 163 mg L-1, in exception for Na2+, which averages barely over 1% (Rywinska et al. 2013). However,
these industrial wastes’ inherent characteristics can be overcome by refining their composition, or using microbes tolerant to inhibitors present in this case in crude glycerol, converting it into various biotechnological products.
On the other hand, industrial waste prices can also be decisive for the approval of crude glycerol as a primary carbon resource. As such, crude and pure glycerol’s prices in Europe were assessed at 200-260 and 480-530 euros per ton, respectively, in September of 2011 (Almeida et al. 2012), constituting an attractive and crucial factor to its growing preference towards biotechnological applications.
1.2
Exopolysaccharide composition
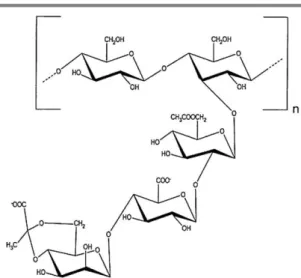
Bacterial EPS of Gram-negative bacteria can be homopolysaccharides, usually with D-glucose as the repeating unit, or heteropolysaccharides (Figure 1.2 and 1.3), whose repeating units differ not only along its structure but also in its size distribution, ranging from disaccharides to octasaccharides.
4 The acyl groups play an important role in the exopolysaccharide properties since the charged residues, found on the exterior of the extended molecules, may promote interaction with ions and other macromolecules (Chandrasekaran 1997). That is originated for instance by pyruvate, glycerate and succinate, which confer an anionic character to the polysaccharides (Freitas et al. 2009a).
1.3
Exopolysaccharide structure
A polysaccharide is constituted by long chains of monosaccharide units linked together by glycosidic linkage. The glycosidic linkages can be either alfa or beta, and vary between 1 3; 1 4; 1 6 or 1 2 to form either linear or ramified structures (Kumar et al. 2007).
For instance, the bacterial EPS curdlan is composed entirely of 1 3 β-linked D-glucose residues, while fungal scleroglucan has the same backbone structure as curdlan but has attached side-chains of 1 6 β-linked D-glucose (Sutherland 1994).
The EPS structure has direct influence on its function once the presence of side-chains on linear polysaccharide macromolecules promote conformational disorder and inhibit ordered assembly, therefore resulting in solubility in aqueous solutions (Rinaudo 2004).
Fig. 1.2 - The ideal repeating unit of xanthan as reported by Jansson et al. 1975.
5
1.4
Bacterial biosynthetic pathways
Bacterial EPS are synthesised by either Gram-positive or Gram-negative bacteria, by two very distinct mechanisms. In Gram-positive bacteria, EPS (e.g. levans, alternans and dextrans) are synthesized by an extracellular process (Vanhooren et al. 1998) but in Gram-negative bacteria they are synthesized intracellularly (e.g. xanthan, gellan, cellulose, succinoglycan) (Sutherland 2001).
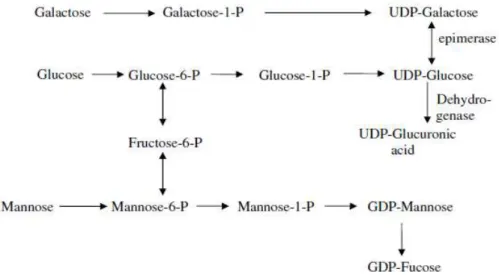
The intracellular biosynthesis is regulated by enzymes that are located in various regions of the cell. In the citoplasm, glucose-1-phosphate (G-1P) is converted (Figure 1.4) to the key molecule in exopolysaccharide synthesis, uridine diphosphate glucose (UDP-Glc) (Figure 1.4). Afterwards, in the cell periplasmic membrane, glycosyltransferases transfer the nucleosides diphosphates sugars (NDPs) to form the repeating unit attached to a glycosyl carrier lipid. Finally, the macromolecules are polymerized and secreted (Kumar et al. 2007).
1.5
Exopolysaccharides properties
Microbial polysaccharides stand out from traditional plant polysaccharides due to their unique or superior physical properties (Sutherland 1998). Aside from their intrinsic biodegradability, non-toxicity and biocompability characteristics, this type of natural polysaccharides can possess many properties that could be broadly used in industrial applications: as emulsion stabilizing and gelling agents in food products; as foam stabilizing agents in the beverage industry and to fire-fighting fluids; as inhibitors of crystal formation in
Fig. 1.4 - Catabolic mechanism representing the sugar nucleotide synthesis and the interconversion of various monosaccharides through epimerization, dehydrogenation and decarboxylation, occurred in the cell cytoplasm.
6 frozen food, pastilles and sugar syrups; as film-forming agents that have special interest in food coatings; as flocculant agents, applied into water clarification; as hydrating agents in cosmetics and pharmaceutical products, among others (Sutherland 1998). Most of these applications have been developed and improved, for xanthan, gellan and hyaluronan (Mishra et al. 2013), and their potential has also been introduced into bioplastic industry and designed to meet therapeutic trends, as drug-delivery composites, for example (Halley et al. 2011).
1.5.1 Rheological properties
Various microbial polysaccharides show high water solubility, producing aqueous solutions with interesting rheological properties that can be used as viscosifying, thickening, stabilizing and/or gelling agents in several applications (Freitas et al. 2009a).
Aqueous solutions of polysaccharides can be characterized as Newtonian or non-Newtonian fluids (Verbeeten 2010).
For a Newtonian fluid, there is a direct relationship between the shear stress (τ) and its shear rate ( ̈) (Figure 1.5). A non-Newtonian fluid is a fluid whose flow properties aren´t proportional to the shear rate, being non-linear and even time-dependent (Figure 1.5).
Without any applied force, the EPS in the aqueous media are randomly arranged and present no resistance. But, when a unidirectional shear stress is applied, an initial resistance can be observed, before the fluid starts to flow. Hence, when the biomolecules are moving, they tend to entangle themselves with each other, resulting in an enhanced resistance to flow (McNeil et al. 1993; Gibbs et al. 2000). Thus the relationship between shear stress and shear rate is not constant, depending on the imposed degree of shearing (Seviuor et al. 2011).
7 Shear-thinning fluids are the largest and probably most important class of non-Newtonian fluids (Cross 1965).
Many non-Newtonian fluids, like most EPS aqueous solutions, exhibit both viscous and elastic properties when undergoing deformation, behavior that is known as viscoelasticity. Further, non-linear viscoelastic materials exhibit mechanical properties that are dependent upontime and magnitude of the stress thatis applied to the material, simultaneously (Vélez-Ruiz et al. 1997). On the contrary, mechanical properties of linear viscoelastic materials only are dependent upon time.
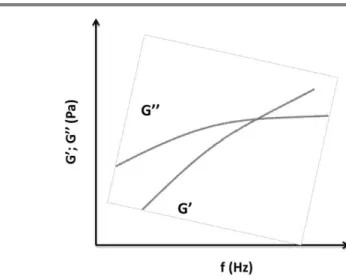
The viscoelastic behavior of EPS aqueous solutions is evaluated by measuring the storage modulus and the loss modulus (Figure 1.6).
The storage modulus (G’) or elastic modulus, measures the ability of the material to store energy or its ability to recover while the loss modulus (G’’) or viscous modulus, expresses the ability of the material to dissipate energy as heat (per cycle of deformation). In a perfect elastic-solid polymer wherein all energy is stored, G’’ is zero, in opposition to a liquid that without any elastic properties, i.e., all the energy is dissipated, G’is in turn, zero (Rao 2007). Fig. 1.5 - Flow curves corresponding to different types of liquid behavior: Newtonian fluids and non-Newtonian fluids.
(http://www.globalspec.com/reference/10735/179909/chapter-3-physical-properties-of-fluids-vapor-pressure-and-boiling-point-of-liquids) assessed at 11.09.2013
8 1.5.2 Emulsion forming and stabilizing capacity
In an emulsion, one liquid (the dispersed phase) is dispersed in other liquid (the continuous phase), presenting a two-phase system (Figure 1.7). This system may exhibit structural changes depending on the characteristics of the phases, and the conditions that they are under (Vianna-Filho 2013).
Emulsifying compounds can be low molecular weight molecules that efficiently lower the surface tension and
interfacial tensions or high molecular weight molecules, which bind tightly to surfaces thus being more effective at stabilizing water/oil emulsions (Abbasi et al. 2008). These characteristics are found in some neutral, eg. galactomannans, or in anionic polysaccharides, eg. xanthan gum and fugogel, which possess emulsion forming and stabilizing capacity (Vianna-Filho 2013).
Biobased emulsions can be utilized in engineered multilayered ‘smart’ delivery systems, for targeted delivery of specialized bioactive agents and functional foods, to combat diseases and to promote and sustain good health. Hence, biobased emulsions can play a fundamental role in many fields, including the pharmaceutical, cosmetics and food industries (Imam et al. 2012).
Fig. 1.6 - Frequency sweep graphic, representing both elastic (G’) and viscous (G’’) modulus at fixed stress and temperature.
Fig. 1.7 - An emulsion vs an unblended oil-water liquid system. (http://www.fiocruz.br/ccs/media/ emulsao%20biosurfactante.JPG)
9 1.5.3 Flocculation capacity
Flocculation is first and foremost a chemical process wherein particles dispersed in a liquid, and not actually dissolved in solution, come out of suspension in the form of stable flocs or aggregates (Chaiwong et al. 2008) (Figure 1.8). This separation occurs by the addition of a flocculating agent, into the previous heterogeneous mixture.
Differently to precipitation, in a flocculated system, there’s no cake formation, since all the particles behave like flocs or aggregates. Still, and because the particles are not in physical contact it is also possible to reverse the formation of aggregates.
Conventionally, many different flocculants are used in several industrial processes, such as, wastewater treatment, dredging, brewing, downstream processing, fermentation and food processing (Dermlin et al. 1999). However the most commonly used products are synthetic flocculants, organic (eg. polyacrylamide, polyethylenimine) and inorganic (eg. polyaluminium chloride and aluminium sulphate), that have shown to be carcinogenic and neurotoxic (Kumar et al. 2004).
In light of this, the naturally occurring flocculant agents (eg. chitosan, sodium alginate, gelatin and microbial polymers), have been recently preferred due to their biodegradability factor and innocuous degradative intermediates (Mandal et al. 2013). The flocculating substances produced by microorganisms are expected to be useful since they are environmentally safer and also can be produced uniformly and reliably by fermentation (Prasertsan et al. 2006).
1.5.4 Film-forming capacity
As mentioned before, polysaccharides have a huge variety of functional attributes. Their unique macromolecular features turn them into very attractive raw materials for the public consumption, in chemicals, pharmaceuticals, tissue engineering products, nutraceuticals, biomedical devices, building materials and enhanced oil recovery aids (Imam et al. 2012).
10 Some natural polysaccharides, from soluble soybean (Tajik et. al. 2013), chitosan (Bourbon et al. 2011), levan and alginate (Freitas et al.
2011a), for example, have film-forming capacity (Figure 1.9). This property can be useful in bioplastics and packaging industries where they are used for tailoring the mechanical and barrier properties of those materials and improving the efficiency of packaged foods conservation (Tajik et. al. 2013).
In order to characterize the exopolysaccharide biofilm’s
properties several parameters should be studied, including their water vapour permeability and the mechanical properties.
The water vapour permeability measures the diffusion capacity of the water molecules through the polymer matrix (Alves et al. 2010a), while the mechanical properties of the films, namely tensile strength and elongation at break are important to evaluate their ability to perform in different applications (Xu et al. 2005).
1.6
FucoPol
FucoPol is a high molecular fucose-containing exopolysaccharide (EPS) produced by Enterobacter A47 (DSM 23139) (Freitas et al. 2011b).
This bacterial strain belongs to a large family of Gram-negative bacteria, the Enterobacteriaceae. The Enterobacteriaceae include many genera: Escherichia, Shigella, Salmonella, Klebsiella, Serratia, Proteus, Enterobacter and others. This family has rod-shaped morphology with typically 1-5 μm in length (Figure 1.10), it is non-spore-forming, it is facultative anaerobe or aerobe and it can also ferment a wide range of carbohydrates (Murray et al. 2003).
This biopolymer (Figure 1.11) is composed of fucose (36-37%mol), galactose (25-26%mol), glucose (27-28%mol),
glucuronic acid (10-11%mol), pyruvate (9-13%mol), succinate (2-3%mol) and acetate (5-8%mol) (Torres et al. 2012). Fucose is a neutral sugar commonly found in exopolysaccharides
Fig. 1.11 – Freeze-dried biopolymer, FucoPol, produced by
Enterobacter A47 (DSM 23139). Fig. 1.9 - Soluble soybean polysaccharide based film.
(Tajik et. al. 2013)
Fig. 1.10 - Enterobacter A47 (DSM 23139) rod-shaped
11 produced by bacteria of the genus Enterobacter, such as E. amnigenus, E. sakazakii and E. cloacae.
E. amnigenus originates a heteropolymer containing glucose, galactose, fucose, mannose, glucuronic acid and pyruvil (Cescutti et al. 2005); Enterobacter sp. CNCM 1-2744 has fucose, galactose, glucose and glucuronic monomers in a ratio of 2:2:1:1 (Philbe 2002); Enterobacter sp. SSYL (KCTC 0687BP) produces a exopolysaccharide with a 40-70% and 8-10% of glucuronic acid and fucose content, respectively (Yang 2002); Enterobacter sakazakii strains ATCC 53017, ATCC 29004 and ATCC 12868 form an exopolysaccharide with 13-22% of fucose content (Harris et al. 1989) and Enterobacter cloacae secretes a biopolymer with glucose, galactose, glucuronic acid, fucose and acetyl groups in a molar ratio of 5:4:4:11:1 (Meade et al. 1994).
The monosaccharide fucose adds an increased market-value to the biopolymer since L-fucose and L-fucose-rich oligo- and polysaccharides (FROP-s) have proven to promote acceleration of wound healing and scavenge free radicals. As a starting point, this rare sugar has anti-inflammatory and anti-aging properties, enhancing its biological properties that can be incorporated into pharmaceutical and cosmetic products (Péterszegi et al. 2003a; Péterszegi et al. 2003b). However, for this particular exopolysaccharide (FucoPol), its biological activity related to the monomer fucose is yet to be determined.
FucoPol production is a patented process (Reis et al. 2011) which consists on the use of glycerol byproduct from the biodiesel industry, as the carbon source. Its standard operation results in a specific growth rate of 0.30-0.32 h-1, a volumetric productivity of 0.53-0.56 gEPSgCDW -1
d-1 and EPS production of 7.23-7.79 g L-1 (Torres et al. 2012). Its main known properties are related to viscous shear-thinning solutions in aqueous media, film-forming, emulsifying and flocculating capacity, as well as biological activity due to fucose content (Freitas et al., 2011b).
13
2
Motivation
The microbial polysaccharides have been raising commercial interest against synthetic polymers, over the past years. This increasing attention has been associated with their natural sources and renewable resources based production. Microbial polysaccharides are able to provide biodegradable and biocompatible polymers, as opposed to the synthetic polymers, and utilize industrial wastes/byproducts for polymer production, which consequently heighten their value-added characteristics.
The glycerol byproduct of biodiesel industry was presented as the sole carbon source of the novel patented bacterial fucose-rich exopolysaccharide, FucoPol (Reis et al., 2011). In addition to previous studies on the effect of the environmental conditions, pH and temperature (Torres et al. 2012), and nitrogen/glycerol ratio (Torres et al. 2013), it was also necessary to determine the oxygen dissolved requirements of such production. Furthermore, an evaluation on the reduction of the phosphate concentration into FucoPol production was needed, in order to decrease its associated high costs.
15
3
Materials and Methods
3.1
EPS Production
3.1.1 Microorganism
Enterobacter A47 (DSMZ 23139) was preserved in 20% (v/v) glycerol as a cryoprotectant agent, at -80 °C. To perform the reactivation of the microorganism, it was grown in a chromagar (CHROMagarTM Orientation) plate, during 24 h at 30 °C, to obtain isolated colonies.
3.1.2 Cultivation Media
Luria Broth (LB) medium, used for preparation of the pre-inocula, had the following composition (per liter): yeast extract (Cultimed), 5.0 g; bacto-tryptone (LaborSpirit) 10.0 g and NaCl (Panreac) 10.0 g.
Medium E*, which was used for preparation of the inocula for bioreactor and shake flasks experiments, had the following composition (per liter): (NH4)2HPO4 (Scharlau), 3.3 g; K2HPO4 (Panreac), 5.8 g; KH2PO4 (Panreac), 3.7 g; 10 mL of a 100 mM MgSO4 solution (Cmd Chemicals) and 10 mL of a micronutrients solution. This micronutrients solution had the following composition (per liter of 1N HCl (Scharlau)): FeSO4·7H2O (Sigma-Aldrich), 2.78 g; MnCl2·4H2O (Acros-Organics), 1.98 g; CoSO4·7H2O (Merck), 2.81 g; CaCl2·2H2O (Scharlau), 1.67 g; CuCl2·2H2O Merck), 0.17 g; ZnSO4·7H2O (Merck), 0.29 g.
Every step involved in the handling of the bacterial strain was carried out in a laminar flow chamber (Heraeus SB 48, Germany). For every flask or bottle containing solutions required to
the bioreactors’ experiments, sterilization (Uniclave 77, Portugal) was achieved at 120 °C, during at least 20 min.
3.1.3 Inocula preparation
Pre-inocula for the experiments were prepared by inoculating a single Enterobacter A47 colony grown on a chromagar plate into 40 mL LB Medium (pH 6.8-7.0) and incubating it in an orbital shaker (IKA ® KS 260 basic orbital shaker, Germany) at 30 °C, 200 rpm during 24 h.
pre-16 inocula prepared as described above were transferred into 200 mL Medium E*, in 500 mL shake flasks, and incubated at 30 °C, 200 rpm during 48-72h.
3.1.4 Shake Flasks Assays
For the study of the effect of phosphate on the bioprocess, six shake flasks assays were performed (in duplicate experiments) by varying the concentration of this nutrient’s sources in
Medium E*(K2HPO4 and KH2PO4). Hence the phosphate concentrations tested were:
Table 1 - Phosphate concentrations of the different experiments in the shake flasks assays.
Experiment A B C D E F
PO43- (g L-1) 8.12 5.25 3.81 3.09 2.95 2.37
3.1.5 Bioreactor cultivation assays
All the experiments were executed in 2 L bioreactors (BioStat B-plus, Sartorius, Germany) with the following operation mode: a batch phase characterized by the exponential microbial growth phase, followed by a fed-batch phase during which a feeding solution was supplied to the culture at a constant rate of 2.5 mL h-1. This solution was identical to Medium E* (described above), but had a higher carbon source concentration, 200 g L-1. The bioreactor was operated with a constant aeration rate of 0.125 vvm, with controlled temperature and pH, 30 °C and 6.8-7.0, respectively. The pH control was achieved with 2M NaOH (eKa) and 2M HCl (Scharlau). Silicone based anti-foam (VWR) was used to control foam formation during the process.
The dissolved oxygen concentration (DO) was controlled by the automatic variation of the stirrer speed (300–800 rpm). In the study of the effect of phosphate on the bioprocess, the DO was controlled at 10% of the air saturation, while in the study of the effect of DO, it was maintained at different air saturation values: 10, 30 or 60% during the batch and fed-batch phases.
To measure the broth viscosity and to quantify the kinetic parameters, ≈25 mL samples
17
3.2
Exopolysaccharide Extraction
For extraction of the biopolymer from the cultivation broth, it was diluted with deionized
water. This dilution depended on the broth’s viscosity: 1-50 mPa.s (no dil.); 50-300 mPa.s (dil. 1:2); 300-1000 mPa.s (dil. 1:3), which was measured at shear rates from 0.3 to 55.8 s-1. The diluted broth was then centrifuged (Sartorius 4K 15, Germany) at 11 627 g for 15 min to separate the biomass from the cell-free supernatant, which contained the biopolymer. After this separation step, the cell-free supernatant was subjected to a thermal treatment at 70 °C for 1 h followed by centrifugation at 11 627 g for 15 min, to remove any remaining cell debris and denatured proteins. The treated supernantant was subjected to dialysis with a 10,000 MWCO membrane (SnakeSkinTM Pleated Dialysis Tubing, Thermo Scientific) against deionized water, with constant stirring at 4 °C. The dialysis was monitored through measurements of the ionic content in the solution for an average of 48 h, so that the conductivity reached below 25 µS m-1, and contaminants adsorbed by the biopolymer were reduced.
For the study of the functional properties the polymers were extracted with an alternative procedure, to guaranty a higher purity degree. A similar procedure was performed, but the thermal treatment of the cell-free supernatant was replaced by protein precipitation with trichloroacetic acid (TCA). 4 mL TCA 99% (Sigma-Aldrich) at a concentration of 100% (w/v) was added to the cell-free supernatant (40 mL) and the mixture was kept at 4 °C for 15 min. After centrifugation at 11 627 g for 15 min to remove the denatured proteins, the treated supernatant was dialyzed, as described above.
In both procedures, the dialyzed supernatants were frozen in liquid nitrogen and freeze-dried (Telstar Cryodos-50, Spain) at - 40 °C and 340 mbar for 48 h.
3.3
Analytical Techniques
3.3.1 Apparent Viscosity
18 3.3.2 Cell Dry Weight
The broth samples were centrifuged (16 743 g during 15 min). The cell-free supernatant was kept at -20 °C for the quantification of ammonium, glycerol and exopolysaccharide, while the cell pellet was used for the gravimetric quantification of the cell dry weight (CDW). The pellet was washed twice in deionized water, filtered in a vacuum system through a cellulose acetate membrane 0.2 µm (GVS), and, finally, dried at 100 °C (Memmert U15, Germany) for 24 h.
3.3.3 Ammonium concentration
To determine the ammonium concentration, 1 mL of the cell-free supernatant sample was mixed with 20 µL ISA (Ionic Strength Adjuster) which is a reagent composed of NaOH, 200 g; EDTA, 8.6107 g; and thymolphthalein, 0.0158g per liter of deionized water. After 5 min, the conductivity was measured using a potentiometric sensor (Thermo Electron Corporation Orion 9512). The ammonium concentration was determined using a NH4Cl (Sigma-Aldrich) standards (0.0056 – 1.8 g L-1).
3.3.4 Glycerol concentration
Glycerol concentration in the cell-free supernatant was determined by high performance liquid chromatography (HPLC) with a Varian 87H column (Metacarb), coupled to a refractometer (Merck). This analysis was performed at 50 ◦C, using 0.01 N H2SO4 (Fischer Chemical) as eluent at a flow rate of 0.6 mL min-1. A standard calibration curve (glycerol 99% - Sigma-Aldrich) with concentrations ranging from 0.15 to 5 g L-1 was used.
3.4
Calculations
3.4.1 Specific Growth Rate
The maximum specific growth rate (µmax, h-1) was determined using the following equation:
⁄ ,
19 3.4.2 Volumetric Productivity
The EPS volumetric productivity (rP, g L-1 h-1) was determined by the following equation:
, Where dP (g L-1) is the variation of product formation during the experiment and
dt (h) is the time period of the experiment delay.
3.4.3 Product and Biomass Yield
The biomass yield on substrate (Υx/s, gcell gglycerol-1) was determined considering the biomass
produced (ΔX, gcell) per substrate consumed (ΔX, gglycerol) during the assay:
⁄ ( )
,
The product yield on substrate (Υp/s, gEPS gglycerol-1) is based on the product formed (ΔP, gEPS) per substrate consumed (ΔX, gglycerol):
⁄ ( ) .
3.5
Chemical Characterization of the Polymers
3.5.1 Elemental Analysis
The measurement of the biopolymers’ composition in C, N, O, H and S, was executed at 60 kPa pressure with a carrier gas flow of 150 mL min-1 and column temperature of 1000 °C
(Manufacturer Eurovector, Model EuroEA, Italy).
3.5.2 Exopolysaccharide Composition
3.5.2.1 Sugar Monomers
20 reaction was done at 120 °C for 2 h. After hydrolysis, 92 µL of 1.6 % NH4OH was added to the hydrolyzed sample.
Prior to analysis, all samples were prepared according to the following 96-well PMP-derivatization method: 75 µL of PMP-derivatization reagent were added to 25 µL of sample in a 96-well-PCR micro titer plate. The plate was sealed with a silicone cap mat, mixed well and centrifuged at 2.000 g for 2 min at 20 °C. After incubation (100 min at 70 °C) in a PCR-cycler and a following automated cool down to 20 °C, an aliquot of 20 µL was transferred to a fresh 96-well micro titer plate and mixed with 130 µL acetic acid. The samples were then transferred into a 96-well filter plate and centrifuged at 2.500 g for 5 min at 20 °C. Finally, the plate was sealed with a 96-well silicon cap mat.
The analysis was performed by a HPLC analysis of monosaccharide-PMP-derivatives. The HPLC system (Ultimate 3000RS, Dionex) was composed of a degasser (SRD 3400), a pump module (HPG 3400RS), an autosampler (WPS 3000TRS), a column compartment (TCC 3000RS), a diode array detector (DAD 3000RS) and an ESI-ion-trap unit (HCT, Bruker).
Data was collected and analyzed with Bruker Hystar, QuantAnalysis and Dionex Chromelion software. The column (Gravity C18, 100 mm length, 2 mm i.d.; 1.8 µm particle size; Macherey-Nagel) was tempered to 50 °C. Mobile phase A consisted of 5 mM ammonium acetate buffer with 15 % acetonitrile and a chromatographic flow rate of 0.6 mL/min. A switch valve behind the UV-detector (245 nm) refused the first 3 min of chromatographic flow. Before entering ESI-MS the flow was splitted 1:20 (Accurate-Post-Column-Splitter, Dionex).The autosampler temperature was set to 20 °C and an injection volume of 10 µL was used. Calibration 200 - 2mg/L: Man, D-mannose; GlcUA, D-glucuronic acid; GlcN, D-glucosamine; GalUA, D-galacturonic acid; Rib, D-ribose; Rha, L-rhamnose; Gen, D-gentiobiose; GalN, galactosamine; GlcNAc, N-acetyl-glucosamine; Lac, lactose; Cel, cellobiose; Glc, D-glucose; GalNAc, N-acetyl-D-galactosamine; Gal, D-galactose; Ara, L-arabinose; Xyl, D-xylose; Fuc,L-Fucose; 2-d-Glc, 2-deoxy-D-glucose; 2-d-Rib, 2-deoxy-D-ribose.
21
3.5.2.2 Volatile Fatty Acids
The analysis of the acyl groups’ composition was performed by hydrolyzing 5mg of EPS dissolved in 5mL of deionized water, with 100 µL of trifluoroacetic acid, TCA 99% (Scharlau). The reaction was done at 120 °C in 2 h (Hach Lange LT 200, Germany).
A standard solution composed by a mixture of acetic acid (Fischer Chemicals), succinic acid (Merck) and pyruvic acid (Sigma-Aldrich), each in a 1 g L-1 concentration, with 0.001 M H2SO4 as solvent, was hydrolyzed under the same conditions as the samples. This standard solution was successively diluted to: 0.5, 0.25, 0.125, 0.0625, 0.03125, 0.015625 and 0.0078125 g L-1. All the reagents used in the standard solution had a purity degree ranging from 98 to 100%.
The analysis was performed by HPLC (Merck) with an Aminex 87H column (Biorad), coupled to a UV-Visible detector (Merck), at 50 ◦C, 210 nm and a flow rate of 0.6 mL min-1 with 0.001 M H2SO4 as eluent.
3.5.2.3 Protein, Water and Inorganic Content
For determination of the protein content, 5.5 mL samples of aqueous EPS solutions (4.5 g L-1) were mixed with 1 mL 20% NaOH and hydrolyzed at 100 °C for 5 min. After cooling on ice, 170 µL of 25% (v/v) CuSO4.5H2O (Riedel de Haen) were added. After mixing, the samples were centrifuged (VWR MicroStar 17, EUA) at 10000 rpm during 5 min and the optical density was measured at 560 nm (Spectrophotometer Helios Alpha, Thermo Spectronic, UK). The protein standard solutions contained BSA 98% (Sigma-Aldrich) in 3.0 to 0.015625 g L-1 concentrations.
In relation to the water content quantification, 10 mg of EPS was placed in a glass fiber 1.2 µm (VWR), folded and placed at 100 °C overnight. Afterwards the same sample was placed at 550 °C (Muffle Nabertherm B150, Germany) during 20 h.
The water content was determined as the amount of water that was evaporated from the EPS sample, after 24 h at 100 °C, as suggested by the following formula:
( ) ( )
.
22
3.6
Functional Properties
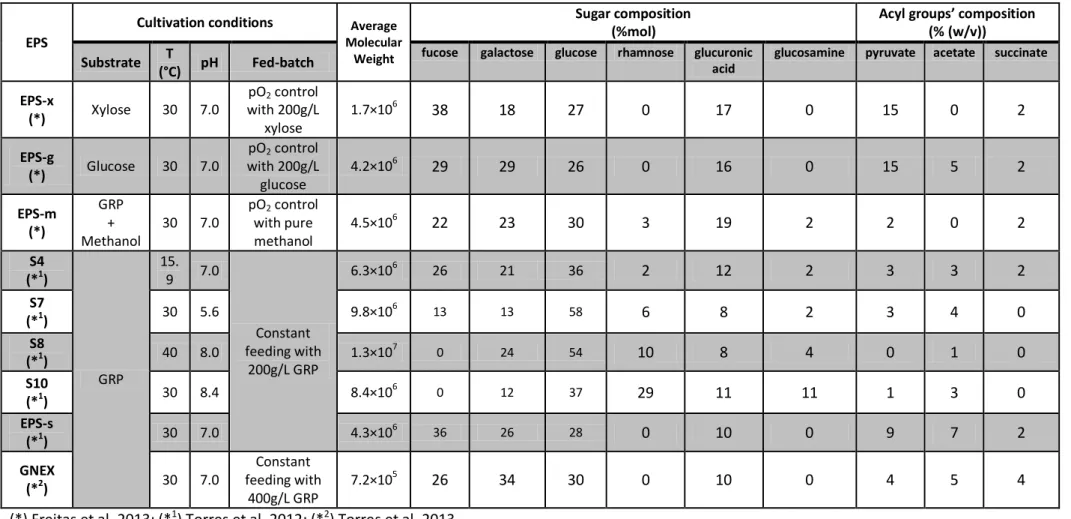
EPS with distinct composition produced by the bacterium Enterobacter A47 under different cultivation conditions were characterized in terms of their functional properties. Such polymers were obtained in previous studies and their physical-chemical characteristics are present in Table 2.
3.6.1 Rheological Properties
The rheology of 1% (w/w) biopolymers’ aqueous solutions in 0.1 M NaCl (Panreac) were studied using a controlled stress rheometers (Haake Mars III, Thermo Scientific, Germany), equipped with a cone and plate geometry: diameter 3.5 cm and a 2° angle. During the experiments, the shearing geometry was covered with paraffin oil in order to prevent water loss. Flow curves were determined at 25 °C using a steady state flow ramp in the shear range of 1–700 s−1. The shear rate was measured point by point with consecutive 30 s steps of constant shear rate. The viscosity was recorded for each point to obtain the flow curves. Frequency sweeps were carried out at a controlled stress of 1 Pa (shown by stress sweeps to give values within the linear viscoelastic region) in order to measure the dynamic moduli G’
and G’’.
3.6.2 Film-forming capacity
A preliminary test was made for all biopolymers to test their capacity to form films by solvent casting: 5 mL of 1% (w/w) EPS aqueous solutions were put in plastic Petri dishes (d=90 mm) and placed at 40 °C, for 24 h, for solvent evaporation. For the biopolymers which had film-forming capacity, their properties were studied, including the mechanical properties and water vapor permeabilities. For this purpose, films were prepared using 19.5 g of 1.25% (w/w) EPS aqueous solutions with 30% (v/v) (gglycerol gdry polymer-1) glycerol 99% content as a plasticizer. The solutions were put in plastic Petri dishes and placed at 40 °C for approximately 48 h, for solvent evaporation. The films were peeled from the dishes’ surfaces and kept in a desiccator with a controlled relative humidity atmosphere of 45 % until testing. Their thickness was measured at three different points using a digital micrometer (Mitutoyo, UK).
23 Micro Systems, Surrey, England). The stress at break was calculated as the ratio of the maximum force to the films' initial cross-sectional area. The elongation at break was
determined as the ratio of the extension of the sample upon rupture by the initial gage length.
The slope of stress as a function of strain, within the elastic deformation of the stress–strain curve, was taken as the Young's modulus, which was calculated according to the following
equation:
Where, (Pa) is the Young’s modulus (or elastic modulus).
Water vapour permeability’s evaluation was performed gravimetrically at 25.0 ± 1.0 °C. The films samples were sealed with silicone on the top of the vials (d=2.5 cm), placed in a desiccator containing a saturated Mg(NO3)2.6H2O solution (aw = 0.534) and equipped with a fan to promote air circulation. Room temperature and relative humidity inside the desiccator were monitored over time using a thermohygrometer (Vaisala, Finland). To impose the selected driving force, a saturated KBr solution was placed inside the vial (aw = 0.809) and water vapour flux was determined by weighing the vial in regular time periods for 47 h. Three independent runs were performed for each EPS film. The water vapour permeability was determined by the following equation:
Where, is the water vapour molar flux, is the film thickness and is the effective driving force, expressed as the water vapour pressure difference between both sides of the film, calculated taking into account the mass transfer resistance of the stagnant film of air below the test film.
3.6.3 Emulsion forming and stabilizing capacity
24 different temperatures, 4, 23 and 37 °C, independently, for several days and temperature fluctuations, such as, freezing at -20 °C and sequential thawing at 20 °C for a time period of 24 h, and increasing temperature from 40 to 100 °C. Each test was carried out once for each EPS-oil mixture.
The emulsification index (EIndex, %), was determined by the following equation:
,
Where (cm) is the height of the emulsion layer and (cm) is the total height of the mixture.
3.6.4 Flocculation capacity
To test the flocculating activity of the different polymers, a 5 g L-1 Kaolin clay (Fluka) suspension was prepared along with a 1% (w/v) CaCl2 (Kemira) solution. EPS aqueous solutions at two different concentrations, 0.01 and 0.001% (w/v) were tested. With a final ratio volume of 40:1:0.1 (Kaolin:CaCl2:EPS), the samples were stirred in the vortex at 2400 rpm, for 1 min. After 5 min the optical density was measured at 550 nm.
A blank sample containing deionized water instead of the EPS solution was used. All measurements were performed in duplicate.
Flocculation (%) was determined using the following equation:
(
) ,
25 Table 2 - Biopolymers description including cultivation conditions and physical characterization. Biopolymers produced by Enterobacter A47
(*) Freitas et al. 2013; (*1) Torres et al. 2012; (*2) Torres et al. 2013
EPS
Cultivation conditions Average
Molecular Weight
Sugar composition (%mol)
Acyl groups’ composition
(% (w/v))
Substrate T
(°C) pH Fed-batch
fucose galactose glucose rhamnose glucuronic acid
glucosamine pyruvate acetate succinate
EPS-x
(*) Xylose 30 7.0
pO2 control with 200g/L
xylose
1.7×10⁶ 38 18 27 0 17 0 15 0 2
EPS-g
(*) Glucose 30 7.0
pO2 control with 200g/L
glucose
4.2×10⁶ 29 29 26 0 16 0 15 5 2
EPS-m (*)
GRP + Methanol
30 7.0
pO2 control with pure methanol
4.5×10⁶ 22 23 30 3 19 2 2 0 2
S4 (*1)
GRP
15. 9 7.0
Constant feeding with
200g/L GRP
6.3×10⁶ 26 21 36 2 12 2 3 3 2
S7
(*1) 30 5.6 9.8×10
6 13 13 58 6 8 2 3 4 0
S8
(*1) 40 8.0 1.3×10
7
0 24 54 10 8 4 0 1 0
S10
(*1) 30 8.4 8.4×10
6
0 12 37 29 11 11 1 3 0
EPS-s
(*1) 30 7.0 4.3×10
6 36 26 28 0 10 0 9 7 2
GNEX
(*2) 30 7.0
Constant feeding with
400g/L GRP
27
4
EPS Production by
Enterobacter
A47
One of the aims of this thesis was to optimize the production of biopolymer FucoPol, otherwise known as a fucose-containing biopolymer.
In order to improve productivity many factors have to be taken into account, such as, the type of bioreactor used, the mode of operation, the medium composition, and the culture conditions: temperature, pH, dissolved oxygen concentration, aeration rate and stirring speed.
In previous studies, the mode of operation (Torres et al. 2013) and the effect of temperature and pH (Torres et al. 2012) on exopolysaccharide production by Enterobacter A47, were established. Hence, in this thesis, two other factors were chosen to be studied, the effect of dissolved oxygen concentration and the effect of phosphate concentration, on EPS production.
4.1
Effect of Dissolved Oxygen Concentration
4.1.1 Cultivation Assays
For this particular study, dissolved oxygen concentration (DO, %) was selected because it is extremely important in aerobic bioprocesses. The DO corresponds to the relative amount of oxygen gas in the media, depending intrinsically on the oxygen gas partial pressure (Atkins, P. et al. 2008). A suitable DO allows a sufficient accessibility from bacterial cells towards the oxygen gas, which in turn determines their growth.
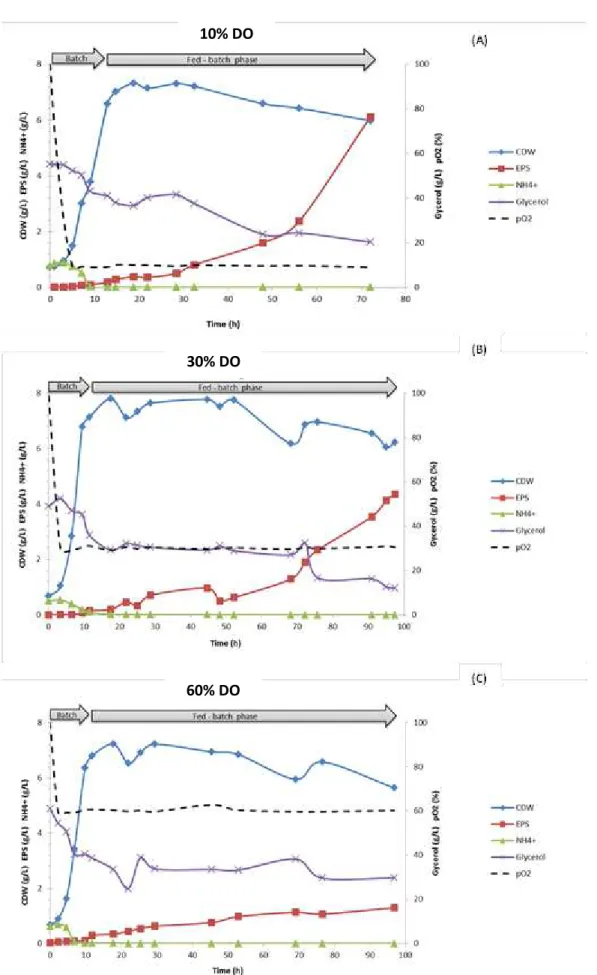
To begin with, experiments were performed at a constant aeration rate of 1 vvm varying the DO concentration (10, 30 and 60%), as shown in Figure 4.1.
Figure 4.1 (A) shows the profile of cell growth and production of the exopolysaccharide under the standard conditions, with DO controlled at 10%, similar to previous assays (Alves et al. 2010b; Torres et al. 2010). Following inoculation of the culture into the bioreactor, bacterial growth started without presenting any lag phase, leading to an immediate decrease of the DO (from 100 to 9.2% within 5 h) due to bacterial activity. The maximum specific growth rate was 0.33 h-1 (Table 3), and the biomass concentration rose from 1.48 g L-1 to approximately 6.00 g L-1 at the end of the batch phase (Figure 4.1 (A)).
28 At this point, the fed-batch phase was implemented (Figure 4.1), in which a feeding solution was fed to the bioreactor to provide more nutrients, namely glycerol.
EPS production slowly started after 1 h of the inoculation, reaching only 0.18 g L-1 by the end of the batch phase. In the next 20 h, EPS production was still relatively low, rising to 0.81 g L-1, but immediately after, it started to increase significantly for the remaining cultivation time. An EPS production of 6.11 g L-1, was attained at the end of the run. As shown in Table 3, cultivation with DO controlled at 10% resulted in a volumetric productivity of 0.080 g L-1h-1 and an yield on glycerol of 0.11 gEPS gglycerol-1.
Biomass concentration declined 18% since its maximum (7.32 g L-1 ) at ≈20 h. This outcome was probably due to dilution of biomass caused by the volume withdrawn from the bioreactor for sampling and the addition of feeding solution and pH control solutions during the fed-batch phase.
Comparatively with other experiments previously performed with the standard conditions (Alves et al. 2010b; Torres et al. 2010), it is verified a very similar cultivation profile.
29 Fig. 4.1 - Cultivation profiles for Enterobacter A47 with dissolved oxygen concentration controlled
at 10% (A), 30% (B) and 60% (C) air saturation. 10% DO
30% DO
30 Finally, during the cultivation assay, a change in the broth viscosity was observed (Figure 4.2). At the beginning, when the EPS concentration in the broth was low, the broth’s viscosity
was 1.45 mPa.s (at 11.2 s-1). In the first 30 h, the broth’s viscosity was slightly increased to 2.86 mPa.s ( at 11.2 s-1). After that, the broth’s viscosity increased proportionally to EPS production, till the end of the run, reaching a maximum of 671 mPa.s (at 0.3 s-1) along with the maximum EPS production.
In the cultivation assay wherein DO was controlled at 30%, a similar cultivation profile was verified, since DO quickly stabilized at 30% within 3.5 h and was kept at this value till the end of the run. Also without lag phase, bacteria grew exponentially for 7 h with a specific growth rate of 0.33 h-1, rising from an initial CDW of 1.04 to 6.78 g L-1 in the end of batch phase. During this batch phase, ammonium was consumed and reached a limiting concentration (<0.1 g L-1). 10 g L-1 of carbon source were also consumed, from the initially 50 g L-1 available (Figure 4.1 (B)). Then, the fed-batch phase was initiated by the addition of the feeding solution to the bioreactor.
Exopolysaccharide production begun, at 10 h and proceeded until the end of the run. After approximately 98 h of cultivation, 4.35 g L-1 of EPS were produced, corresponding to an overall volumetric productivity of 0.045 g L-1 h-1.These values are lower than the ones obtained under the standard conditions (6.11 g L-1 and 0.080 g L-1 h-1, respectively), which is probably related to the non-limiting DO concentration (30%). Also, the lower EPS productivity resulted in a lower yield of EPS on glycerol, 0.07 gEPS gglycerol-1 in comparison to 0.11 gEPS gglycerol-1, with DO at 10% (Table 3). Furthmore, glycerol consumption was higher (64.36 g L-1) than in standard conditions (55.99 g L-1), which indicates that with 30% of air saturation, less EPS production is obtained
Fig. 4.2 - Apparent viscosity of the culture broth during cultivation of Enterobacter A47 with DO controlled at 10%, measured at shear rates of 0.3 – 11.2 s-1.
31 with superior substrate consumption. This superior substrate consumption was probably due to its deviation towards other metabolic pathways.
Taking into consideration the maximum value of CDW at standard conditions, 7.32 g L-1, at 30%, CDW reached to 7.80 g L-1, which describes a similar behavior in the biomass concentration even if DO its three times higher.
So, in conclusion, the biomass concentration was not affected with DO at 30% but the EPS productivity ability of the bacteria, decreased considerably.
Relatively to the culture broth viscosity (Figure 4.3), that was initially 1.05 mPa.s (at 11.2 s -1), it increased slowly to 50.1 mPa.s (at 0.6 s-1) and it took another 20 h to reach to 391 mPa.s (at 0.3 s-1), as opposed to the 671 mPa.s (at 0.3 s-1), in 98 h of cultivation with DO controlled at 10% (Figure 4.2). The inferior increase of broth’s viscosity was corroborated by the direct relation to the lower EPS production, with DO controlled at 30%.
In the cultivation assay Figure 4.1 (C), wherein the DO concentration was controlled at 60%, identical bacterial growth profile was observed.
The cell growth started without lag phase, increasing exponentially for 9 h, from 0.06 to 6.21 g L-1 with a specific growth rate of 0.33 h-1, till the end of the batch phase. This occurred simultaneously with the exhaustion of ammonium, which reached the limiting condition, <0.1 g L-1, and also with the consumption of 20 g L-1of glycerol (from the initial 60 g L-1 initially available).
After that, the fed-batch phase was implemented and it was continuously fed with a solution containing 200 g L-1 of glycerol, equally to both cultivation assays presented previously (DO at 10 and 30%). At the fed-batch phase, DO and ammonium levels were kept at 60% and <0.1 g L-1, respectively.
Fig. 4.3 - Apparent viscosity of the culture broth during cultivation of Enterobacter A47 with DO controlled at 30%, measured at shear rates of 0.3 – 11.2 s-1.
32 Even though the exopolysaccharide was slowly produced during the entire cultivation assay, from 0.12 g L-1 to only 1.27 g L-1, after 87 h of fed-batch phase, bacteria continued to consume glycerol till the end. Its total glycerol consumption (61.90 g L-1) was higher than glycerol consumption (55.99 g L-1) at standard conditions, probably due to its deviation for other metabolic routes (e.g. protein production), with high DO concentrations. The EPS production and volumetric productivity, 1.27 g L-1 and 0.013 g L-1 h-1, respectively, were unequivocally lower than standard conditions.
The only parameter that was not affected with DO controlled at 60%, was the biomass concentration that reached a maximum of 7.20 g L-1, identical to the ones verified with DO at 10 and 30%, 7.32 and 7.80 g L-1, respectively.The EPS production, productivity and yield on glycerol were negatively affected, reaching to the lowest values of the present study. For these last reasons, the cultivation assay with DO at 60% is considered an exopolysaccharide non-productive set of conditions.
Regarding the culture broth viscosity (Figure 4.4), concomitant with the low EPS production, it reached a final value of only 25 mPa.s (at 1.4 s-1).
Resorting to Table 3, all different DO concentration values equally provided optimal bacterial growth, ranging from 6.54 to 7.11 g L-1, with a specific growth rate of 0.33 h-1 and biomass yield of 0.12 gcell gglycerol-1. Nevertheless, higher DO concentrations, inversely affected the product yield, which was five times lower at 60%, 0.02 gEPS gglycerol-1 than it was in standard conditions, 0.11 gEPS gglycerol-1.
Fig. 4.4 - Apparent viscosity of the culture broth during cultivation of Enterobacter A47 with DO controlled at 60%, measured at shear rates of 1.4 – 11.2 s-1.
33 Table 3 - Kinetic parameters for the cultivation of Enterobacter A47 with dissolved oxygen concentration controlled
at different air saturation values.
Experiment A B C
DO (%) 10 30 60
µ (h-1) 0.33 0.33 0.33
CDWproduced (g L-1) 6.60 7.11 6.54
EPS (g L-1) 6.11 4.35 1.27
rp (g L-1h-1) 0.080 0.045 0.013
glycerol cons. (g L-1) 55.99 64.36 61.90
YX/S (gcell gglycerol-1) 0.12 0.11 0.11
YP/S (gEPS gglycerol-1) 0.11 0.07 0.02
According to these data, it’s possible to confirm that standard conditions were the most adequate for EPS production by Enterobacter A47. A partially-growth associated product was attainable with this specific bacteria caused by two triggering events, carbon source availability and nitrogen limitation. Therefore, similar biomass concentration was originated in all assays by exhaustion of the limiting nutrient and EPS production was reduced for DO concentration above 10% of air saturation.
In comparison to the literature, it is referred that the role of oxygen limitation in polysaccharide biosynthesis could exercise positive or negative influence. For instance, (Peters et al. 1989) and (Amanullah et al. 1998), support the idea that dissolved oxygen above 20%, enhance biopolymer formation and production rate in species such as Xanthomonas campestris. Banik et al. 2006, also reported that cultivation of Sphingomonas paucimobilis with higher DO levels, from 20 to 100%, increases biomass formation and biopolymer production, as opposed to DO levels below 20%.
However, Rho et al. 1988 support that in some cultures, such as Aureobasidium pullulans, oxygen demand is so high, that under conditions at low DO, an optimum biopolymer synthesis is achieved. Moreover, they reinforce that biomass production is not affected by different DO levels. Specifically for bacteria strains, such as Azotobacter vinelandii, low DO concentrations (between 2-3%) were the most suitable for alginate production and biomass formation, in the range of 1–10% of air saturation, after which both parameters decreased significantly (according to Sabra et al. 1999).