RESEARCH ARTICLE
Dynamic of the structural alteration of biochar
in ancient Anthrosol over a long timescale by
Raman spectroscopy
Daniel Vieira de SousaID1*, Luciano Moura Guimarães2, Jorlandio Francisco Fe´lix3, João Carlos Ker4, Carlos Ernesto R. G. Schaefer4, Maria Jacqueline Rodet5
1 College of Geography, Federal University of São Francisco Valley, Senhor do Bonfim, Bahia, Brazil, 2 Physics Department, Federal University of Vic¸osa, Vic¸osa, Minas Gerais, Brazil, 3 Institute of Physics, University of Brasilia, Brasilia, Federal District, Brazil, 4 Department of Soils, Federal University of Vic¸osa, Vic¸osa, Minas Gerais, Brazil, 5 Archaeology Department, Federal University of Minas Gerais, Belo Horizonte, Minas Gerais, Brazil
Abstract
The presence of biochar with high carbon accumulation capacity and nutrient adsorption is causally associated with archeological soils. Although this type of soil organic matter has been known for a long time, the knowledge of its structure and environmental behavior is still limited. This work used Raman spectroscopy to obtain structural information and identify alterations in biochar particles. To this end, we studied biochar particles found in an archae-ological site with a temporal window lasting 12451 to 11080 yr cal BP. The molecular, struc-tural and sp2/sp3 characteristics of the charcoal particles were determined at the time of burning and associated with the temperature, time and characteristics of the burnt material. We propose that the process of oxidation of the biochar occurs during the first 2000 years after its genesis. The oxidation process is a reflection of decreases in the number of defects related to sp2 bonds on amorphous carbons and increases in the number of defects associ-ated with ionic impurities, which clearly indicate the interaction between biochar particles and the soil matrix. The data confirm the hypothesis that the persistence of biochar in the environment is due to its graphite structure and suggest that over a 12000 year timeframe, biochar particles undergo several changes that occur in the disordered phase and are rap-idly oxidized.
Introduction
Biochar can be conceptualized by two distinct perspectives: the “chemical” perspective and the "utility" perspective. In the “chemical” perspective, biochar can be understood as the solid product of biomass pyrolysis that formed by the incomplete combustion of organic com-pounds [1–3] and is composed of a graphite microstructure with ordered and disordered phases [3]. The ordered phase is attributed to polyaromatic nanographite domains, which confer structural stability and long-term permanence in the environment. The disordered/ amorphous phase is the most susceptible to changes. This phase is composed of carboxylic and aliphatic groups [4,5], which are responsible for generating electrical charges and adsorbing
a1111111111 a1111111111 a1111111111 a1111111111 a1111111111 OPEN ACCESS
Citation: Sousa DVd, Guimarães LM, Fe´lix JF, Ker JC, Schaefer CERG, Rodet MJ (2020) Dynamic of the structural alteration of biochar in ancient Anthrosol over a long timescale by Raman spectroscopy. PLoS ONE 15(3): e0229447.https:// doi.org/10.1371/journal.pone.0229447
Editor: Jorge Paz-Ferreiro, RMIT University, AUSTRALIA
Received: August 14, 2019 Accepted: February 6, 2020 Published: March 23, 2020
Copyright:© 2020 Sousa et al. This is an open access article distributed under the terms of the
Creative Commons Attribution License, which permits unrestricted use, distribution, and reproduction in any medium, provided the original author and source are credited.
Data Availability Statement: All relevant data are within the manuscript and its Supporting Information files.
Funding: Minas Gerais State Research Foundation Grant number APQ-02672-14 and APQ-00681-14, received by João Carlor Ker and Carlos Ernesto R. G. Schaefer respectively.
Competing interests: The authors have declared that no competing interests exist.
nutrients [6,7]. According to the modern concept, which relates to "utility" and intentionality, biochar is widely recognized as the appropriate term for man-made charcoals that are used to improve the chemical and physical properties of soil [8].
One early focus of biochar studies was on the anthropic soil of the Amazon forest known as "Indian Black Earth," which is found in open-air archaeological sites with human occupation dating between 800 and 2000 years before the present (BP) [9–12]. Despite the numerous stud-ies on biochar, its stability and dynamics in the environment have yet to be fully elucidated, and this question has been examined and discussed for decades [13–17]. Previous researchers clarified that a higher burning temperature produces biochar with higher polyaromatic struc-tures and larger crystallite size.
Recent studies have shown that biochar particles are the altered (oxidized) in soil and sedi-ments, revealing that biochar can be altered over time through biotic and abiotic mechanisms [18–20]. To further elucidate the process and mechanisms of biochar degradation, it is neces-sary to evaluate the structural alterations in detail over time, and this line of inquiry is particu-larly important in the context of carbon sequestration and global warming mitigation as well as for biochar transport, erosion, cation retention, and stability [21–24]. Previous studies have addressed the structural alteration of biochar particles using a time scale analysis, although the time scales of these studies did not exceed 1000 years [18,20,25–27]. An approach that covers a longer timescale (Pleistocene/Holocene to historical period) in the same locality is still unprecedented in biochar research.
A considerable variety of methods have been used to reveal the structure of biochar, includ-ing NMR, FTIR, XPS, SEM-EDS, Synchrotron-based techniques and Raman spectroscopy [8,
28–31]. Raman spectroscopy is very sensitive to alterations in the structure of carbon and therefore is able to shed light on the degradation of biochar in soil. This technique has been used for studies of the nanostructures of charcoal (biochar) in Anthrosols [4,20,32,33].
The most prominent features in the Raman spectra of graphite materials are the so-called G and D bands. The G band is the signature of graphite materials associated with the vibration of the carbon atoms tangentially to the plane of the graphene. This band can be observed at approximately 1580 cm-1, and it indicates the presence of organized sp2 domains [34–37]. The D band is related to defects associated with the breaking of the hexagonal symmetry of the car-bon atoms in the graphene sheets and can be observed at approximately 1350 cm-1. The rela-tionship between the intensities of the D and G bands can provide an estimate of the crystallite size and also related to the number of defects present in the material [36]. However, for highly disordered materials, other bands are induced by other types of defects in the crystalline lattice and appear as first-order peaks at approximately 1150 (D4), 1530 (D3) and 1600 cm-1(D2) [25].
To elucidate the biochar degradation across the time, we examine the biochar particles over a long timescale in an ancient anthropic soil using Raman spectroscopy to evaluate the alter-ation of the structure of biochar over time. Our study adopted an original and previously unpublished approach that considers a long temporal period (e.g., the Pleistocene/Holocene 12702 yr cal BP to the historical period). This approach helps to understand the behavior of biochar over time and provides information on the dynamics of changes of the carbon parti-cles in the environment.
This research is based on the ancient anthropic soil found at the Bibocas II archaeological site (UTM coordinates 563175, 8096575) located in the municipality of Jequitaı´, and it is approximately 34 m long and 5 m deep. This site is located in the central Brazilian Plateau in the upper São Francisco River basin between the archaeological provinces of Lagoa Santa and Peruac¸u Valley, which are the regions in Brazil with the most archaeological sites dating from the late Pleistocene to the early Holocene [38,39]. According to Sousa [40,41], anthropic
action in the Bibocas II archaeological site is responsible for the high concentrations of carbon, calcium, phosphorous, and potassium and the high magnetic susceptibility. The anthropic activi-ties in the site influenced the melanization of the soil, mainly in the stratigraphic layers, where bonfires have been identified. Melanization is a product of higher organic matter and charcoal contents. Sousa [40] observed a close correlation between the amounts of carbon, potassium, and calcium and magnetic susceptibility and suggested that magnetic susceptibility could result from intense heating of the soil caused by anthropogenic fires. Such in situ human activity would promote the formation of new mineral phases, such as magnetite and maghemite [41].
Current regional research is concentrated on the banks of the São Francisco River and in the karst regions of Jequitaı´ and Lagoa dos Patos [42,43], and the results show that the local prehistoric people produced very elaborate unifacial and bifacial lithic instruments from the various raw materials available in the local environment (e.g., quartzite, quartz, silexite, and green chloritic rocks). The essential element of these cultures was the systematic pebble debit-age, which produced rock flakes that were directly used without further transformation [42]. The evidence of this technological choice is present throughout the stratigraphic sequence up to the time of contact with the European colonizers, which occurred at the São Francisco river-bank sites. Fires used to cook food or transform raw materials for painting are a constant regional feature. Some shelters in the Peruac¸u River valley of the Itacarambi municipality have remnant bonfires that were used only for making pigments. In the Bibocas II archaeological site, bonfires are systematically identified throughout the excavated stratigraphy (in all the lay-ers) and represent the origin of the charcoals used in this research.
This shelter was chosen for this study for some reasons: i) it has thick, continuous and undisturbed sedimentary sequences and ii) it shows evidence of old occupation, with14C dat-ing (12451 to 11080 yr cal BP [Beta-265452]) indicatdat-ing continuous human occupation up to the present day [42].
Our primary objective was to investigate the changes in molecular structures of charcoal (biochar) over a long timescale of natural oxidation. The questions that drive the present study are as follows: Assuming that charcoal particles, although stable, change over time, how do these changes happen over a long time scale? What contribution can Raman spectroscopy bring to the process of charcoal particle alteration?
Materials and methods
Charcoal production in muffle ovens
A higher pyrolysis temperature of carbon-related material generates a more organized carbon structure, which is a reflection of the greater amount of the graphite component compared to that in the disorganized phase [3]. To generate charcoals with a known structural organization that can be used as standard material, charcoals were produced using muffle ovens at different pyrolysis temperatures.
It is important to highlight that the landscape of the archaeological site location underwent modifications at the end of the Pleistocene and during the Holocene, and these modifications led to alteration of the structural vegetation. Thus, with the exception of the more recent archae-ological layers, it is impossible to use plant materials to produce these charcoals, which resemble the materials used by prehistoric populations. Because these charcoals are only included to pro-vide a gradient of samples with distinct structural organizations, which is strongly influenced by the pyrolysis temperature [3,8,36,44], any plant material could be used.
Therefore, eucalyptus bark was chosen because it is a very available residue from Brazil and has great potential for use in the production of biochar. Thus, by characterizing the structural organization of biochar produced from eucalyptus bark, we contribute relevant information
about the temperature and time of pyrolysis and the respective structural organization of the material. The eucalyptus peels were dried in a forced-air circulation oven at 70 ˚C until reach-ing a constant mass and then passed through a 2 mm mesh to obtain a homogeneous sample. Pyrolysis was conducted in a muffle furnace under atmospheric air with samples and then con-ditioned in closed porcelain crucibles. Pyrolysis temperatures of 300, 400, 550, 700, and 1000 ˚C were applied for 10 minutes. The heating rate was 10 ˚C/minute until reaching the final temperature.
Archaeological samples: Collection and sample preparation
The archaeological field work carried out at the Bibocas II was coordinated by the archaeolo-gist Maria Jacqueline Rodet, who obtained permission from the Institute of National Historical and Artistic Heritage (IPHAN) to carry out the intervention in this archaeological site as well as research that led to the excavation work. During the field season, soil samples were collected at all stratigraphic layers.
To compose the “charcoal sample” analyzed in this work, three charcoal particles (biochar) were randomly collected from the coarse sand fractions (in 1.5 mm to 4 mm) of the following stratigraphic layers: Surface, with human occupation from the early 20th century; Layer I, III (1698 to 1656 yr cal BP [Beta-256643]), and Upper IV; Middle IV, Lower IV, and Middle V (8543 to 8357 yr cal BP [Beta-256648] and 10,230 to 9885 yr cal BP [Beta-256648]); Lower V (11090 to 10,655 yr cal BP 264540]); and Upper VI (12702 to 12543 yr cal BP [Beta-256647]) (Fig 1andTable 1). The uncalibrated14C dates were measured at the Beta Analytic
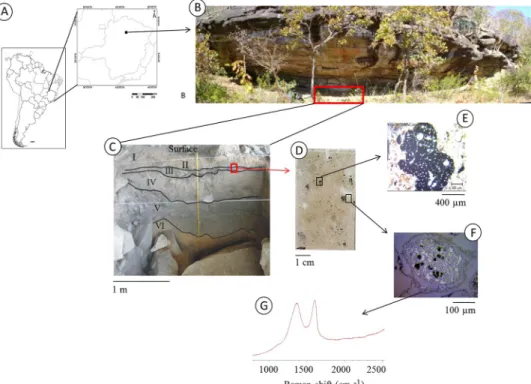
Fig 1. From the meter (landscape and archaeological site) to the micrometer (charcoal particle) scale. A—Location of the sample collection area in South America. B—Archaeological site Bibocas II. The area marked with the red box indicates the excavated site. C—Stratigraphy of the archaeological site with the dating. The black box indicates the location of the thin section samples. D—Micromorphology thin section. The black boxes indicate the locations in which the carbon particles in the transect were analyzed. E—Larger particle of charcoal observed with an optical microscope with transmitted light. F—Smaller particle of charcoal observed with an optical microscope with incident light. G—Example of a Raman spectrum, still untreated, of the smaller-sized charcoal particle (image F).
Laboratory [42]. The calibrated ages were obtained using OxCal [45];https://c14.arch.ox.ac. uk/oxcal/OxCal.html) and the SHCal13 Southern Hemisphere calibration dataset [46].
The collected charcoals were cleaned with deionized water and dried at 40 ˚C. Glass micro-scope slides were used to deposit these samples for Raman spectroscopy measurements. Dur-ing the fieldwork, undisturbed samples (micromorphology samples) were collected between Layers II and III to prepare soil thin sections. These undisturbed samples were impregnated with an epoxy resin [47]. Two charcoal fragments on soil thin sections were selected for the point-to-point analysis, which was performed from the edge toward the center of the charcoal particles.
X-ray diffraction
An X-ray diffraction analysis was used to study the crystallinity of samples submitted to differ-ent thermal treatmdiffer-ents. The diffraction patterns were obtained using a Bruker D8 Discover diffractometer equipped with Cu Kα radiation (λ = 1.5418 Å). The diffraction pattern was obtained at diffraction angles between 5 and 70˚ (2θ) at room temperature with a scan velocity of 0.02˚/s.
Raman spectroscopy and spectrum adjustment procedures
Raman measurements were carried out on a Renishaw micro Raman inVia spectrometer. An argon laser at 514.5 nm was used as an excitation source. The spectra were obtained using a 50X objective and NA = 0.75 with a laser power of 0.3 mW on the sample, which resulted in a spot diameter of approximately 1μm. For each sub-sample, 5 Raman spectroscopy measure-ments were performed, totaling 15 measuremeasure-ments per sample.
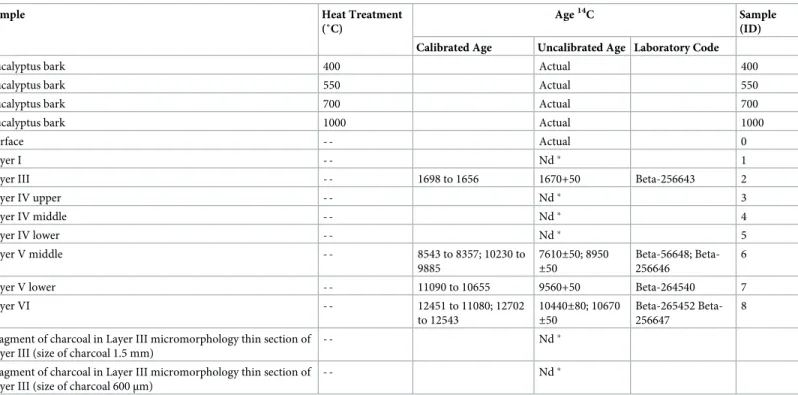
Table 1. Samples used in this work.
Sample Heat Treatment
(˚C)
Age14C Sample
(ID) Calibrated Age Uncalibrated Age Laboratory Code
Eucalyptus bark 400 Actual 400
Eucalyptus bark 550 Actual 550
Eucalyptus bark 700 Actual 700
Eucalyptus bark 1000 Actual 1000
Surface - - Actual 0
Layer I - - Nd� 1
Layer III - - 1698 to 1656 1670+50 Beta-256643 2
Layer IV upper - - Nd� 3 Layer IV middle - - Nd� 4 Layer IV lower - - Nd� 5 Layer V middle - - 8543 to 8357; 10230 to 9885 7610±50; 8950 ±50 56648; Beta-256646 6
Layer V lower - - 11090 to 10655 9560+50 Beta-264540 7
Layer VI - - 12451 to 11080; 12702 to 12543 10440±80; 10670 ±50 265452 Beta-256647 8 Fragment of charcoal in Layer III micromorphology thin section of
Layer III (size of charcoal 1.5 mm)
- - Nd�
Fragment of charcoal in Layer III micromorphology thin section of Layer III (size of charcoal 600μm)
- - Nd�
�not dated
The baseline of the spectra was extracted via a linear function. The spectrum fit was per-formed with 6 curves: two Gaussian (D and G) and four Lorentzian functions (D2, D3, D4, and D5). In general, the deconvolution of the spectrum can be performed by simple adjust-ment using only two Lorentzian or two Gaussian functions, which allows for the study of the dispersion behavior of the D and G Raman bands without a high level of details [48]. However, when the primary aim of the research is to identify the subtle nuances of the spectrum, a 5-band (G, D1, D3, D3, and D4, seeFig 2) adjustment is required [12,25,49–55]. The D5 band at 1700 cm-1was inserted to improve the accuracy of the fit.Table 2shows general infor-mation about each of the bands (Fig 2).
The crystallite size (La) calculation was performed using the Tuinstra and Koening equa-tion, in which La = A x (IG/ID), where “A” is a constant that depends on the energy of the laser.
For the 514.5 nm laser line, “A” is equilibrated at 44Å [34].
Scanning electron microscopy
Samples of soil thin sections were coated with graphite and analyzed by scanning electron microscopy using a JEOL model 6010LA coupled to a dispersive energy spectrometer (EDS). The measurements were performed at 15 kV.
Statistical analysis
Multivariate statistical analyses (cluster analysis (CA) and principal component analysis (PCA)) were performed to find patterns in the structural alteration data. CA employed the amalgamation rule of “single linkage” with the “Euclidean distance.” The PCA was based on the correlation matrix. Statistica 7.0 software was employed for the statistical analyses. The CA and PCA were performed using the following variables:ωG; ωD; the ratio of the area of the D1 band and G band (AD1/AG) and the ratio of the intensity of the D1 and D4 band.
Fig 2. Example of the fitting performed in the samples used in this work.
Results
Structural characteristics of standard charcoal pyrolyzed in muffle ovens
The X-ray diffraction (XRD) analyses (Fig 3) revealed the changes of the biomass during the pyrolysis reaction and showed that the full width half maximum (FWHM) for the lattice planes (hkl planes (002), (004), (100)) decreased with increasing temperature.
Fig 4Ashows the Raman spectra for the charcoal produced samples at several temperatures and illustrates the reorganization of the lignocellulosic structures in polyaromatic structures Table 2. General information on the bands used in this work.
Band Raman Shift (cm-1) Vibration Mode Phonon
Type
Adjust Model
Source Initial Position in Carbon
Material Soot Disordered Graphite HOPG G 1580, s
1580, s 1580, s Ideal Graphite Lattice (E2g –Symmetry) sp2 in rings and chains
iTO, LO Gaussian Tuinstra F, Koenig (1970) [34]; Wang Y. et al. (1990) [37]; Ferrari & Robertson (2000) [48]; Dresselhaus et al. (2005) [35]
D1 (D) 1350, vs
1350, m - Discorded graphite lattice (A1g-Symmetry) sp2 in rings
iTO Gaussian Tuinstra F, Koenig (1970) [34]; Wang Y. et al. (1990) [37] Dresselhaus et al. (2005) [35] D2
(D’)
1620, s
1620, w - E2g Simetry LO Lorentzian Wang Y. et al. (1990) [37]
D3 (D”, A)
1500, m
- - Amorphous Carbon Lorentzian Jawhari T. et al. (1995) [49]; Wang Y. et al. (1990)
[37] Dippel B. et al. (1999) [51] D4 (I) 1180,
w
- - Disordered carbon (A1 symmetry)
polyenes, ionic impurities sp2-sp3, or C = C or C-C stretching
Lorentzian Al-Jishi R & Dresselhaus G (1982) [50]; Cuesta et. al. (1998) [52]
D5 1700,
w
C = O Lorentzian Inoue et al. (2017) [20]
s–strong; vs–very strong; m–medium; w—weak;
https://doi.org/10.1371/journal.pone.0229447.t002
Fig 3. Width of the base of the peak to half-height in 2Ɵ for the hkl planes (002), (004), and (100).
with the subsequent organization of graphite structures. This process can be observed by the appearance of the G band in the Raman spectrum. This reorganization is caused by the char-ring of the vegetal biomass [55,56].
The G-band is a signature of the sp2-type carbon structure. The D band arises due to the broken symmetry of the hexagonal structure of the carbon atoms caused by defects in the lat-tice, which may be a simple vacancy to the replacement of atoms in the sp2 hybrid orbitals. A G-band shift from 1584 cm-1to 1592 cm-1was observed prominently between 400 and 700 ˚C (Fig 4B). The FWHM peak of the G-band decreases as a function of the temperature (Fig 4C), which indicates an enhancement of the crystallinity and is consistent with the XRD results shown inFig 3.
Structural differences between pyrolyzed fresh charcoals and “fossil”
charcoal
The stratigraphic profile of the Bibocas II archaeological site is represented by the respective layers shown inFig 5A. The Raman spectra of the samples of charcoal collected in these differ-ent layers are visualized inFig 5B.Fig 5Bshows that there is a subtle increase of the D4 band as it deepens in the soil profile. The origin of this band may be related to the increase of structures with sp2-sp3, C-C or C = C bonds; this band is associated with defects of the sp2 network. The D1 band becomes less intense, and the peak relative to the D4 band (Fig 5B) becomes stronger. This behavior makes the D4 band more evident in the spectrum, which can be explained by the interaction between the biochar particles and the soil matrix.
The main characteristic of the Raman spectra of the charcoal with depth in the soil profile can be observed inFig 6.Fig 6Aillustrates that the G-band clearly undergoes a shift to regions of higher energies, with displacement from 1589 cm-1to 1596 cm-1.
Fig 4. (A) Raman spectra of the charcoal samples obtained from the eucalyptus bark burned at temperatures from 400 to 1000 ˚C; (B) FWHM for the G-band as a function of the firing temperature; and (C) frequency of the G-band as a function of the charred temperature.
The ratio between the intensity of the D4 and D1 bands (Fig 6C) was analyzed to identify changes in lattice defects that indicate an oxidation trajectory. The results show that the D1 band (for which vibrational modes are related to lattice defects from structures with 6 carbon atoms) decrease their intensity relative to the D4 band (which is related to sp2-sp3- structural defects, CC or C = C). However,Fig 6Billustrates the decreasing ratio between the intensities of ID/IG with depth in the soil.
Fig 5. Schematic profile of the stratigraphy of the archaeological site Bibocas II by De´borah Duarte and Luis Felipe Bassi (A). Raman spectra of charcoal superimposed according to stratigraphy (B).
https://doi.org/10.1371/journal.pone.0229447.g005
Fig 6. Characteristics of the Raman spectrum distributed along the stratigraphic profile in the following sequence: (A)—frequency of G (cm-1); (B)—intensity ratio of ID/IG; and (C)—intensity ratio of ID4/ID1.
The CA and PCA were performed using the variablesωG, ωD1, and the ratio of the area of the D1 band and G band (AD1/AG) was used to identify a pattern and similarities among the samples studied (Fig 7A and 7B). The sample with lower structural organization, which was pyrolyzed at 400 ˚C, was not closely similar to any other sample. However, the results revealed a similarity between the charcoal samples collected at the Surface layer of the archaeological site, and samples produced at higher temperatures from the pyrolysis at 700 ˚C and 1000 ˚C, which include the charcoal that was produced in muffle ovens and showed better structural organization. The similarity was greater between samples pyrolyzed at 550 ˚C and samples with dates older than 1670± 50 years BP (Layers IV, V and VI). Surface samples are relatively new (from the early 20th century), and the samples obtained from Layer I (older than the Surface) exhibit less alteration. The samples collected in Surface and Layer I (Fig 5A) have greater simi-larity to charcoals produced at more elevated pyrolysis temperatures (700 ˚C and 1000 ˚C).
Fig 7Bindicates that two factors account for 94% of the variability of the data. Factor 1, which explains 74.22% of the variability of the data, is attributed to the charcoal organization (graphitic component) acquired during the pyrolysis process. The Surface samples are from the archaeological site Bibocas II and resemble the samples pyrolyzed at 700 and 1000 ˚C. The samples from Layer I resemble the samples pyrolyzed at lower temperatures (550 and 400 ˚C), indicating the change of carbon structure due to the oxidation processes. Factor 2, which explains 20.41% of the variability of the data, represents the unorganized fraction of the char-coal particles. In the archaeological samples, this result suggests the nanostructural evolution during the alteration processes because in fresh charcoal, this result is related to lattice defects, generated during the pyrolysis process.
Cross-section analyses of biochar particles found in the ancient anthropic
soil
To observe how the alteration process occurs in biochar, a cross-section of two biochar parti-cles found in the micromorphological samples was generated (soil thin sections of Layer III,
Fig 1). These two particles, which had diameters of approximately 1.5 mm and 600μm (Fig 8), were measured at distinct points starting at approximately 1.5μm from the edge toward the center of the particle.
Fig 7. Analysis of the grouping of the samples produced in the muffle oven and collected from the archaeological site: 400, 500 and 700 ˚C; Sup—surface; I—layer I—610 years BP; III—layer III, 1170 years BP; IVs–layer IV-upper; IVm–layer IV-middle; IV- layer IV-lower; Vm–layer V- middle (8500 years BP); VI–V lower; VIs–layer VI upper.
Fig 8Ashows that smaller ratios between the intensity of bands D and G are found farther from the edge of the particle. At the first measurement point at approximately 1.5μm away from the edge, the ID/IG ratio shows a value of 1.72, while at 44μm from the edge, this value drops to 0.97, and at approximately 600μm from the first measurement point, it reaches a minimum of 0.774. Higher ID/IG ratios indicate defects in the crystal lattice that affect the La, which will increase with distance from the particle edge (Fig 8B). The first measurement point at approximately 1.5μm from the edge has a La of 2.5 nm; at 44 μm from the edge, the La cal-culated by the Tuinstra and Koening equation [34] was 4.85 nm, and at 600μm from the edge, the La was 5.98 nm.
Cross-sectional analyses of the smaller particle size (600μm) reveal a similar behavior with previous samples. The mathematical model that describes the data behavior is an exponential model. Greater structural disorder (higher ID/IG) is observed closer to the edge. The ID/IG values are 1.8 to 2μm at the edge and decrease to 0.76 at 44 μm from the particle edge. The La values have the same behavior and are smaller at the particle edge, with a value of 2.46 nm at 2μm from the edge and 5.74 nm at 44 μm. For the smallest sample (600 μm), the ID/IG is higher than that obtained at the same distance for the larger sample (1.5 mm). The same behavior is observed for La, with smaller charcoal particles showing greater crystal lattice dis-order and a smaller La.
SEM-EDS approach to observing the interaction between biochar particles
and soil matrix
Micromorphological samples were analyzed using a scanning electron microscope coupled to an energy-dispersive spectrometer to study the interaction of charcoal fragments with the soil matrix. Charcoal fragments without a clay coating or quasi-coating were rarely observed, and Fig 8. Structural disorder and size of the crystal from the periphery towards the center; A and B, ID/IG and La of charcoal at 1.5 mm; C and D, ID/IG and La of charcoal at 600μm.
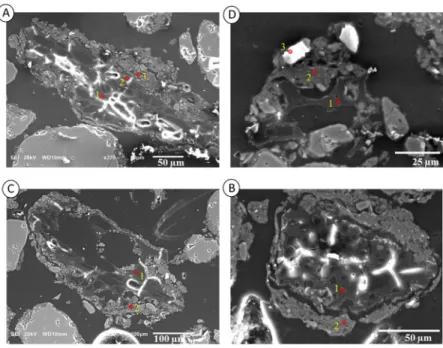
in most of the observations, the charcoal particles included a fine fraction on the periphery. The results of the SEM-EDS analyses are simplified inFig 9andTable 3.Fig 9A and 9Cshow an elongated charcoal fragment with a clay coating and a fine sand fraction on the periphery.
Fig 8Bshows a small microaggregate composed of charcoal in the center and the clay, silt and fine sand fractions.Fig 9Dshows the formation of a microaggregate that has a charcoal frag-ment in its interior and presents a clay coating and quasi-coating throughout its periphery.
The data inTable 3are the results of the EDS microanalysis of the red points shown inFig 8. The microanalysis carried out by EDS revealed that the soil clay matrix has a kaolinitic-oxidic composition because the Al:Si ratio is close to 1 for certain points (point 2 in Image 9A; point 2 in Image 9C) (Fig 9). The microanalyses illustrated inFig 9B(point 1) show a particle and charcoal with Fe, Al, Si, and traces of K and P (Table 3), and point 2 reveals traces of K and P in the clay matrix.
Points 1 and 2 inFig 9Aare from the middle of the particle and near the edge of the char-coal, while point 3 shows the clay coating. A comparison of the data at points 1 and 2 shows that at point 1, the C:O ratio is 2.30 while at point 2, it is 1.96, which indicates a higher pres-ence of O atoms in relation to C atoms, suggesting that there are substantial amounts of car-boxylic groups at the edge of the particle. In addition, at point 2, Al, Fe, Si and traces of K are observed. Si and K are possibly inherited from the plant material itself, while Al and Fe reflect the interaction between the charcoal particle and the soil through adsorption processes.
The EDS data fromFig 9A and 9Dsuggest that the fine fraction, clay coating (Fig 9A) and quasi-coating (Fig 9D) are composed of a significant amount of nano-charcoals, which leads to the large amount of carbon identified in the micro-chemical analysis (points 2 and 3 ofFig 9A and 9D, respectively) that is similar to the content found in the carbon particle analysis (point 1 ofFig 9A and 9D).
Fig 9. Scanning electron microscopy of particles of charcoal from a soil thin section collected between Layers II and III of the Bibocas II archaeological site. The red points indicate the EDS microanalysis data shown inTable 3. Images A and B show the charcoal particles within a soil microaggregate. Image C shows a clay coating over the charcoal particles. Image D illustrates the quasi-coating formed by clay minerals and nano-charcoal particles, which is suggested by the high content of carbon in the clay matrix.
Discussion
Structural differences between modern and fossilized charcoals and
evolution of biochar structures over time
The pyrolysis process promotes the loss of hydrogen and oxygen and the formation of long molecules of carbons, and as a consequence, the carbon structures evolve into graphite struc-tures (Fig 4A) [44]. Hemicellulose is decomposed at temperatures of approximately 202–315 ˚C, while cellulose decomposes between 280 and 400 ˚C. Lignin is a complex macromolecule with different chemical bonds, and its degradation varies according to the material that was burned and disappears at temperatures over 650 ˚C [57,58]. The cellulose decomposition can be observed by the appearance of the G and D bands in the samples pyrolyzed at temperatures above 300 ˚C (Fig 4A), which indicates the formation of ordered ring structures. As the pyroly-sis temperature increases, the structures become more ordered; this process can be shown by the shift of the G band from 1584 to 1590 cm-1(Fig 4B) and the decreased FWHM of the G band (Fig 4C).
According to the elapsed time, the structural organization of the charcoal during the pyrol-ysis process changes due to the oxidation process, with the frequency of the G band shifting to higher energy from 1589 cm-1to 1596 cm-1(Fig 6) with greater depth into the soil profile. The shift of the G band to higher energy associated with a decrease of the defects of the D1 band (sp2 in rings) in relation to the D4 band (ionic impurities) suggests a charge transfer signature between sp2 structures and the soil matrix. This interaction between the biochar particles and the soil mineral matrix was previously demonstrated by Shepherd et al. [59], Archanjo et al. [31], and Hagemann et al. [60] and others [30,61,62].
The biochar and soil matrix interaction promotes the carbon oxidation pathway [19], which can be observed by the decreasing ID/IG ratio and the shift ofωG to a higher frequency as a function of depth in the soil profile (Fig 6A and 6B). These data show that the alteration process acts in the degradation of disorganized structures, contributing to the relative increase of the organized fraction (nanographite structures) [54,55]. As more unstable and disordered structures are oxidized, the nanographite structures remain unaltered due to their stability. This alteration in the biochar structure occurred in approximately the first 2000 years after the initial burning (Layer III; 1698 to 1656 yr cal BP). Between 1698 and 8543 yr cal BP, the bio-char particles continued to undergo changes in structure, although to a lesser extent. After the middle Layer V (8543 yr cal BP), there is an apparent stabilization of the values of the shift in ωG and ID/IG, which indicates a decreased oxidizing process because of the predominance of the nanographite component.
Image Point Element (% mass)
C O Al Fe Si K P 9A 1 66.69 28.96 4.24 - - - -2 52.15 26.58 7.28 5.24 7.75 1 -3 50.23 27.24 7.8 4.21 9.05 4.21 -9B 1 62.29 32.67 3.62 0.51 0.48 0.15 0.28 2 38.28 34.45 8.8 4.41 12.13 1.77 0.16 3 14.88 48.58 2.12 - 33.47 0.95 -9C 1 66.49 25.46 3.67 0.72 0.37 - 0.29 2 3.14 37.15 8.77 5.21 10.89 0.85 -9D 1 69.09 27.38 2.86 0.67 - - -2 62.97 21.68 5.22 3.35 6.03 0.76 -https://doi.org/10.1371/journal.pone.0229447.t003
During the first 2000 years following the "creation" of charcoal, the most significant struc-tural changes occurred. The amorphous phase of charcoal is the one that suffered major changes, which is indicated by the appearance of new defects in the crystalline lattice. The gra-phitic component underwent only minor changes and remained more stable, although there was a decrease of the La. Finally, the next 9000 years did not bring about significant changes in the nanographite structure, although there was a considerable blue-shift in the G band, which suggests that there is an amorphization trajectory or an interaction between the soil matrix that caused charge changes. Previous works on a much smaller timescale also detected changes in the amorphous component of biochar particles, although the researchers did not detect any alterations in the graphite component [20,63].
Structural alteration preferentially occurs on the charcoal periphery
According to the data shown in Figs8and9, particles with a diameter of 1.5 mm and 600μm have a high structural disorder on their periphery that decreases toward the center of the parti-cle. This characteristic was also found for Indian Black Earth of the Amazon region [12,33]. The data inFig 8also indicate that smaller particles exhibit greater structural disorder, both on the periphery and at the center. This difference in structural order/disorder according to the size of the charcoal particle indicates the existence of physical protection against oxidation pro-cesses. Thus, the protection process against structural alteration is more efficient for larger par-ticles [64].
From the moment that the plant material is pyrolyzed, the carbon presents molecular and structural characteristics, with the sp2/sp3 ratio determined by the characteristics of the mate-rial pyrolyzed (e.g., lignin and cellulose), temperature and pyrolysis [48,65]. It is worth men-tioning that in archaeological sites, it is common for bonfires to be placed in locations that previously hosted bonfires. Therefore, charcoal from archaeological sites can undergo several processes of pyrolysis until they are buried by sedimentary processes.
Once the sedimentary action has buried the charcoal, the main process the particles undergo is biological oxidation [64], which will "consume" the more unstable fraction of car-bon and oxidize aromatic rings into carboxylic and phenolic groups. Thus, the Surface layer will have a higher capacity for adsorbing chemical elements because of the oxidation-generated charges as well as the high specific surface associated with the small La of approximately 2.3 nm, which was estimated by the Tuinstra and Koenig equation [34] (Fig 9B and 9D). This high specific surface area and small La will promote the adsorption of Fe, Al, K, Ca, and P onto bio-char particles as demonstrated by Archanjo [31] and Shepherd [59]. When the soil solution flows between the pores of the soil, the charcoal particles will encounter a basic microenviron-ment that favors the precipitation of certain molecules, such as Fe oxides and carbonates. Fe oxides may contribute to the adsorption of phosphorus [66], potassium, and other nutrients [67] and pollutants [68,69]. Hagemann [60] proposed that not only the interaction of the min-eral matrix and biochar particles is responsible for nutrient adsorption but also highlighted the action of organic clusters with biochar and organic compounds.
The interaction of the charcoal with the soil is clearly observed inFig 8. InFig 8A and 8C, an elongated charcoal fragment with a clay coating is observed.Fig 8Bshows a microaggregate composed of charcoal in the center with a clay coating and the presence of quartz in the silt fraction. The interaction between the soil matrix and charcoal particles can form soil microag-gregates (Fig 8D) with a charcoal fragment at the core and clay forming a coating and quasi-coating throughout the periphery.
The oxidation of the charcoal is due to microbiological action as well as the reduction and oxidation processes that occur with the soil constituents, such as with the Fe oxides on the
surface of the charcoal [14,59]. These redoximorphic reactions consume electrons coming from the periphery of the charcoal particle, thus aiding its weathering and contributing to its physical fragmentation. These interactions occur with the ion-exchange and electrons in soil and charcoal and explain the G-band displacement shown inFig 6A. However, this "encrusta-tion" of the charcoal particle by oxides and clayey material as observed inFig 8A–8Das well as in Shepherd [59] and Sousa [40] will contribute to its permanence in the environment due to the physical protection provided by the mineral fraction [5]. Instead of the carbon being oxi-dized, the Fe oxides incorporated in the surface of the particle will undergo oxidation-reduc-tion processes, thus promoting the physical and chemical protecoxidation-reduc-tion of the charcoal particle. In addition to iron oxide, other constituents may exert such physical protection, such as Al, Mn, Si and other clay constituents.
Conclusions
This work supports previous findings that show that charcoal will suffer alteration processes over time, and our results support the following conclusions. i) The most significant changes occur in the crystalline lattice during the first 2000 years following the contact of the charcoal particle with the soil matrix. ii) The amorphous fraction is more altered, which is reflected in the decreased number of defects associated with the D1 band in relation to the D4 band. The D1 band defects are related to sp2 bonds on amorphous carbons, and the D4 band defects are associated with ionic impurities, which indicate the interaction between the biochar particle and soil matrix. iii) Changes in the graphite structure occur after the initial 2000 years, with a decreased oxidizing process and a predominance of the nanographite component. iv) Smaller biochar particles have a smaller La and a greater edge density and reactivity.
The application of Raman spectroscopy and a long timescale perspective have provided novel information on the chemical structure of charcoal that is difficult to obtain by other means. The results provide insights on the evolution of biochar structures and the dynamic alteration of biochar over time from the end of the Pleistocene (12702 to 12543 yr cal BP) to the historical period (beginning approximately 500 years ago).
The data presented here confirm the hypothesis that the presence of biochar in the environ-ment is due to its graphite structure and allow us to conclude that graphite structures can change over 12000 years and the interaction between biochar particles and soil matrix pro-duces defects (D4 band) in the crystalline lattice.
Supporting information
S1 Fig. Plot of linkage distances across stepd (euclidian distances) of cluster analysis. (TIF)
S1 Table. Factor scores, based on correlations, of principal component analysis. (DOCX)
S2 Table. Case contributions, based on correlations, of principal component analysis. (DOCX)
Acknowledgments
We are grateful to the anonymous reviews and to Giovanni Mastrolonardo for the important comments and suggestions to improve the manuscript. We are also thankful to Prof. Renê Chagas from the Department of Physics of the UFV for assistance in the in SEM-EDS analyses in the Scanning Electron Microscopy laboratory in the Physics Department of UFV.
Author Contributions
Conceptualization: Daniel Vieira de Sousa, Luciano Moura Guimarães, Maria Jacqueline Rodet.
Formal analysis: Daniel Vieira de Sousa, Luciano Moura Guimarães, João Carlos Ker. Funding acquisition: João Carlos Ker, Carlos Ernesto R. G. Schaefer.
Investigation: Daniel Vieira de Sousa, Luciano Moura Guimarães, Jorlandio Francisco Fe´lix, Carlos Ernesto R. G. Schaefer, Maria Jacqueline Rodet.
Methodology: Daniel Vieira de Sousa, Luciano Moura Guimarães, Jorlandio Francisco Fe´lix, João Carlos Ker, Carlos Ernesto R. G. Schaefer.
Project administration: Daniel Vieira de Sousa. Resources: João Carlos Ker.
Software: Daniel Vieira de Sousa, Luciano Moura Guimarães, Jorlandio Francisco Fe´lix. Supervision: João Carlos Ker, Carlos Ernesto R. G. Schaefer.
Validation: Daniel Vieira de Sousa, Luciano Moura Guimarães, Jorlandio Francisco Fe´lix. Visualization: Daniel Vieira de Sousa, Jorlandio Francisco Fe´lix, Maria Jacqueline Rodet. Writing – original draft: Daniel Vieira de Sousa.
Writing – review & editing: Daniel Vieira de Sousa, Luciano Moura Guimarães, Jorlandio Francisco Fe´lix, João Carlos Ker, Carlos Ernesto R. G. Schaefer, Maria Jacqueline Rodet.
References
1. Glaser B, Birk JJ. State of the scientific knowledge on properties and genesis of Anthropogenic Dark Earths in Central Amazonia (terra preta de I´ndio). Geochim Cosmochim Acta. 2012; 82: 39–51.https:// doi.org/10.1016/j.gca.2010.11.029
2. Weber K, Quicker P. Properties of biochar. Fuel. 2018.https://doi.org/10.1016/j.fuel.2017.12.054 3. Knight DS, White WB. Characterization of diamond films by Raman spectroscopy. J Mater Res. 1989;
https://doi.org/10.1557/JMR.1989.0385
4. Cohen-Ofri I, Weiner L, Boaretto E, Mintz G, Weiner S. Modern and fossil charcoal: Aspects of structure and diagenesis. J Archaeol Sci. 2006;https://doi.org/10.1016/j.jas.2005.08.008
5. Schmidt MWI, Torn MS, Abiven S, Dittmar T, Guggenberger G, Janssens IA, et al. Persistence of soil organic matter as an ecosystem property. Nature. 2011.https://doi.org/10.1038/nature10386PMID: 21979045
6. Liang B, Lehmann J, Solomon D, Kinyangi J, Grossman J, O’Neill B, et al. Black Carbon Increases Cat-ion Exchange Capacity in Soils. Soil Sci Soc Am J. 2006;https://doi.org/10.2136/sssaj2005.0383 7. Gul S, Whalen JK. Biochemical cycling of nitrogen and phosphorus in biochar-amended soils. Soil
Biol-ogy and Biochemistry. 2016.https://doi.org/10.1016/j.soilbio.2016.08.001
8. Lehmann J, Stephen J. Biochar for Environmental Management: Science, Technology and Implemen-tation. Science And Technology. 2015.
9. Kern D.C., Kampf N, 1989. Antigos assentamentos indı´genas na formac¸ão de solos com Terra Preta Arqueolo´gica na região de Oriximina´, Para´, Revista Brasileira de Ciência do Solo, 13, 219–225. 10. Woods WI, McCann JM. The Anthropogenic Origin and Persistence of Amazonian Dark Earths. Yearb
Conf Lat Am Geogr. 1999;
11. Glaser B, Haumaier L, Guggenberger G, Zech W. The “Terra Preta” phenomenon: A model for sustain-able agriculture in the humid tropics. Naturwissenschaften. 2001;https://doi.org/10.1007/
s001140000193PMID:11302125
12. Jorio A, Ribeiro-Soares J, Canc¸ado LG, Falcão NPS, Dos Santos HF, Baptista DL, et al. Microscopy and spectroscopy analysis of carbon nanostructures in highly fertile Amazonian anthrosoils. Soil Tillage Res. 2012;https://doi.org/10.1016/j.still.2012.02.009
13. Puri B, Singh DD, Nath J, Sharma L. Chemisorption of Oxygen on Activated Charcoal and Sorption of Acids and Bases. Ind Eng Chem. 2005;https://doi.org/10.1021/ie50583a046
14. Cheng CH, Lehmann J, Thies JE, Burton SD, Engelhard MH. Oxidation of black carbon by biotic and abiotic processes. Org Geochem. 2006; 37: 1477–1488.https://doi.org/10.1016/j.orggeochem.2006. 06.022
15. Ascough PL, Bird MI, Wormald P, Snape CE, Apperley D. Influence of production variables and starting material on charcoal stable isotopic and molecular characteristics. Geochim Cosmochim Acta. 2008; 16. Ascough PL, Bird MI, Meredith W, Snape C, Large D, Tilston E, Dynamics of Charcoal Alteration in a Tropical Biome: A Biochar-Based Study. Front Earth Sci. 2018;https://doi.org/10.3389/feart.2018. 00061
17. Spokas KA. Review of the stability of biochar in soils: Predictability of O:C molar ratios. Carbon Manage-ment. 2010.https://doi.org/10.4155/cmt.10.32
18. Cheng CH, Lehmann J, Engelhard MH. Natural oxidation of black carbon in soils: Changes in molecular form and surface charge along a climosequence. Geochim Cosmochim Acta. 2008;
19. Francioso O, Sanchez-Cortes S, Bonora S, Rolda´ n ML, Certini G. Structural characterization of char-coal size-fractions from a burnt Pinus pinea forest by FT-IR, Raman and surface-enhanced Raman spectroscopies. J Mol Struct. 2011;https://doi.org/10.1016/j.molstruc.2011.03.011
20. Inoue J, Yoshie A, Tanaka T, Onji T, Inoue Y. Disappearance and alteration process of charcoal frag-ments in cumulative soils studied using Raman spectroscopy. Geoderma. 2017;https://doi.org/10. 1016/j.geoderma.2016.09.032
21. Gurwick NP, Moore LA, Kelly C, Elias P. A Systematic Review of Biochar Research, with a Focus on Its Stability in situ and Its Promise as a Climate Mitigation Strategy. PLoS One. 2013;https://doi.org/10. 1371/journal.pone.0075932PMID:24098746
22. Hockaday WC, Grannas AM, Kim S, Hatcher PG. Direct molecular evidence for the degradation and mobility of black carbon in soils from ultrahigh-resolution mass spectral analysis of dissolved organic matter from a fire-impacted forest soil. Org Geochem. 2006;https://doi.org/10.1016/j.orggeochem. 2005.11.003
23. Rumpel C, Chaplot V, Planchon O, Bernadou J, Valentin C, Mariotti A. Preferential erosion of black car-bon on steep slopes with slash and burn agriculture. Catena. 2006;https://doi.org/10.1016/j.catena. 2005.09.005
24. De Souza Falcão NP, Comerford N, Lehmann J. Determining Nutrient Bioavailability of Amazonian Dark Earth Solis—Methodological Challenges. Amazonian Dark Earths. 2006.https://doi.org/10.1007/ 1-4020-2597-1_14
25. Hammes K, Smernik RJ, Skjemstad JO, Schmidt MWI. Characterisation and evaluation of reference materials for black carbon analysis using elemental composition, colour, BET surface area and 13C NMR spectroscopy. Appl Geochemistry. 2008;https://doi.org/10.1016/j.apgeochem.2008.04.023 26. Nguyen BT, Lehmann J. Black carbon decomposition under varying water regimes. Org Geochem.
2009;
27. Haefele SM, Konboon Y, Wongboon W, Amarante S, Maarifat AA, Pfeiffer EM, et al. Effects and fate of biochar from rice residues in rice-based systems. F Crop Res. 2011;https://doi.org/10.1016/j.fcr.2011. 01.014
28. Schaefer CEGR, Lima HN, Gilkes RJ, Mello JWV. Micromorphology and electron microprobe analysis of phosphorus and potassium forms of an Indian Black Earth (IBE) Anthrosol from Western Amazonia. Aust J Soil Res. 2004;https://doi.org/10.1071/SR03106
29. Alon D, Mintz G, Cohen I, Weiner S, Boaretto E. The use of raman spectroscopy to monitor the removal of humic substances from charcoal: Quality control for14C dating of charcoal. Radiocarbon. 2002.
https://doi.org/10.1017/S0033822200064638
30. Chia CH, Munroe P, Joseph SD, Lin Y, Lehmann J, Muller DA, et al. Analytical electron microscopy of black carbon and microaggregated mineral matter in Amazonian dark Earth. J Microsc. 2012;https:// doi.org/10.1111/j.1365-2818.2011.03553.xPMID:21950566
31. Archanjo BS, Mendoza ME, Albu M, Mitchell DRG, Hagemann N, Mayrhofer C, et al. Geoderma Nano-scale analyses of the surface structure and composition of biochars extracted from field trials or after co-composting using advanced analytical electron microscopy. 2017; 294: 70–79.
32. Ribeiro-Soares J, Canc¸ado LG, Falcão NPS, Martins Ferreira EH, Achete CA, Jorio A. The use of Raman spectroscopy to characterize the carbon materials found in Amazonian anthrosoils. J Raman Spectrosc. 2013; 44: 283–289.https://doi.org/10.1002/jrs.4191
33. Oliveira NC, Paschoal AR, Paula RJ, Constantino IC, Bisinoti MC, Moreira AB, et al. Morphological analysis of soil particles at multiple length-scale reveals nutrient stocks of Amazonian Anthrosols. Geo-derma. 2018;https://doi.org/10.1016/j.geoderma.2017.09.034
34. Tuinstra F, Koenig JL. Raman Spectrum of Graphite. J Chem Phys. 1970;https://doi.org/10.1063/1. 1674108
35. Dresselhaus MS, Dresselhaus G, Saito R, Jorio A. Raman spectroscopy of carbon nanotubes. Physics Reports. 2005.https://doi.org/10.1016/j.physrep.2004.10.006
36. Ferrari AC. Raman spectroscopy of graphene and graphite: Disorder, electron-phonon coupling, doping and nonadiabatic effects. Solid State Commun. 2007;https://doi.org/10.1016/j.ssc.2007.03.052 37. Wang Y, Alsmeyer DC, McCreery RL. Raman Spectroscopy of Carbon Materials: Structural Basis of
Observed Spectra. Chem Mater. 1990; 2: 557–563.https://doi.org/10.1021/cm00011a018 38. Prous A. Arqueologia Brasileira. UnB, 1992.
39. Prous A, Fogac¸a E. Archaeology of the Pleistocene-Holocene boundary in Brazil. Quat Int. 1999; https://doi.org/10.1016/S1040-6182(98)00005-6
40. Sousa D.V., Ker J.C., Rodet M.J., Schaefer C.E.G.R., Teixeira W.G., 2015. Pedoarqueologia em Abrigo Quartizı´tico, Sı´tio Bibocas II, Jequitaı´, Ocupac¸ão Humana no Holoceno inicial na Bacia do São Francisco. Teoria e Sociedade. 23 (1), 167–197.
41. de Sousa DV, Ker JC, Schaefer CER, Rodet MJ, Guimarães LM, Felix JF. Magnetite originating from bonfires in a Brazilian prehistoric Anthrosol: A micro-Raman approach. CATENA. 2018; 171: 552–564. https://doi.org/10.1016/j.catena.2018.07.036
42. Maria C, Rodet J. Arqueologia nas planı´cies e afluentes do Alto-me´dio São Francisco Municı´pios de Jequitaı´ e Buritizeiro. 2010;
43. Penha, U.C., 2015. Prospecc¸ão de Jazidas Lı´ticas em Arqueologia: uma Proposta Metodolo´gica. Unpublished Master Dissertation. Universidade Federal de Minas Gerais, Belo Horizonte.
44. Belcher CM, New SL, Santı´n C, Doerr SH, Dewhirst RA, Grosvenor MJ, et al. What can charcoal reflec-tance tell us about energy release in wildfires and the properties of pyrogenic carbon? Front Earth Sci. 2018;https://doi.org/10.3389/feart.2018.00169
45. Bronk Ramsey C. Bayesian Analysis of Radiocarbon Dates. Radiocarbon. 2009;https://doi.org/10. 1017/s0033822200033865
46. Hogg AG, Hua Q, Blackwell PG, Niu M, Buck CE, Guilderson TP, et al. SHCal13 Southern Hemisphere Calibration, 0–50,000 Years cal BP. Radiocarbon. 2013;https://doi.org/10.2458/azu_js_rc.55.16783 47. Bullock P, Fedoroff N, Jongerius A, Stoops G, Tursina T. Advisory group on a thin section descriptive
system—a progress report. Soil micromorphology. Vol. 1. 1983.
48. Ferrari A, Robertson J. Interpretation of Raman spectra of disordered and amorphous carbon. Phys Rev B—Condens Matter Mater Phys. 2000;https://doi.org/10.1103/PhysRevB.61.14095
49. Jawhari T, Roid A, Casado J. Raman spectroscopic characterization of some commercially available car-bon black materials. Carcar-bon N Y. 1995; 33: 1561–1565.https://doi.org/10.1016/0008-6223(95)00117-V 50. Al-Jishi R, Dresselhaus G. Lattice-dynamical model for graphite. Phys Rev B. 1982; 26: 4514–4522.
https://doi.org/10.1103/PhysRevB.26.4514
51. Dippel B, Jander H, Heintzenberg J. NIR FT Raman spectroscopic study of flame soot. Phys Chem Chem Phys. 1999; 1: 4707–4712.https://doi.org/10.1039/a904529e
52. Cuesta A, Dhamelincourt P, Laureyns J, Martı´nez-Alonso A, Tasco´ n JMD. Comparative performance of X-ray diffraction and Raman microprobe techniques for the study of carbon materials. J Mater Chem. 1998; 8: 2875–2879.https://doi.org/10.1039/a805841e
53. Li R, Wang JJ, Gaston LA, Zhou B, Li M, Xiao R, et al. An overview of carbothermal synthesis of metal– biochar composites for the removal of oxyanion contaminants from aqueous solution. Carbon. 2018. https://doi.org/10.1016/j.carbon.2017.12.070
54. Tsaneva VN, Kwapinski W, Teng X, Glowacki BA. Assessment of the structural evolution of carbons from microwave plasma natural gas reforming and biomass pyrolysis using Raman spectroscopy. Car-bon N Y. 2014;https://doi.org/10.1016/j.carbon.2014.09.005
55. Sadezky A, Muckenhuber H, Grothe H, Niessner R, Po¨schl U. Raman microspectroscopy of soot and related carbonaceous materials: Spectral analysis and structural information. Carbon N Y. 2005;https:// doi.org/10.1016/j.carbon.2005.02.018
56. Ascough PL, Bird MI, Scott AC, Collinson ME, Cohen-Ofri I, Snape CE, et al. Charcoal reflectance mea-surements: Implications for structural characterization and assessment of diagenetic alteration. J Archaeol Sci. 2010;https://doi.org/10.1016/j.jas.2010.01.020
57. Yang H, Yan R, Chen H, Lee DH, Zheng C. Characteristics of hemicellulose, cellulose and lignin pyroly-sis. Fuel. 2007;https://doi.org/10.1016/j.fuel.2006.12.013
58. Conti R, RombolàAG, Modelli A, Torri C, Fabbri D. Evaluation of the thermal and environmental stability of switchgrass biochars by Py-GC-MS. J Anal Appl Pyrolysis. 2014;https://doi.org/10.1016/j.jaap.2014. 09.010
59. Shepherd JG, Joseph S, Sohi SP, Heal K V. Biochar and enhanced phosphate capture: Mapping mech-anisms to functional properties. Chemosphere. 2017;https://doi.org/10.1016/j.chemosphere.2017.02. 123PMID:28364649
60. Hagemann N, Joseph S, Schmidt HP, Kammann CI, Harter J, Borch T, et al. Organic coating on biochar explains its nutrient retention and stimulation of soil fertility. Nat Commun. 2017;https://doi.org/10. 1038/s41467-017-01123-0PMID:29057875
61. Sanchez-Cortes S, Corrado G, Trubetskaya OE, Trubetskoj OA, Hermosin B, Saiz-Jimenez C. Sur-face-enhanced Raman spectroscopy of chernozem humic acid and their fractions obtained by coupled size exclusion chromatography-polyacrylamide gel electrophoresis (SEC-PAGE). Appl Spectrosc. 2006;https://doi.org/10.1366/000370206775382695PMID:16454910
62. Vithanage M, Herath I, Joseph S, Bundschuh J, Bolan N, Ok YS, et al. Interaction of arsenic with bio-char in soil and water: A critical review. Carbon. 2017.https://doi.org/10.1016/j.carbon.2016.11.032 63. Pusceddu E, Montanaro A, Fioravanti G, Santilli SF, Foscolo PU, Criscuoli I, et al. Comparison between
Ancient and Fresh Biochar Samples, A Study on The Recalcitrance of Carbonaceous Structures During Soil Incubation. Int J New Technol Res. 2016;
64. Ishimaru K, Hata T, Bronsveld P, Nishizawa T, Imamura Y. Characterization of sp2- and sp3-bonded carbon in wood charcoal. J Wood Sci. 2007;https://doi.org/10.1007/s10086-007-0879-7
65. Limwikran T, Kheoruenromne I, Suddhiprakarn A, Prakongkep N, Gilkes RJ. Dissolution of K, Ca, and P from biochar grains in tropical soils. Geoderma. 2018;https://doi.org/10.1016/j.geoderma.2017.10. 022
66. Lehmann J. Bio-energy in the black. Frontiers in Ecology and the Environment. 2007.https://doi.org/10. 1890/1540-9295(2007)5[381:BITB]2.0.CO;2
67. Zhang P, Sun H, Ren C, Min L, Zhang H. Sorption mechanisms of neonicotinoids on biochars and the impact of deashing treatments on biochar structure and neonicotinoids sorption. Environ Pollut. 2018; https://doi.org/10.1016/j.envpol.2017.12.013PMID:29247944
68. Lonappan L, Rouissi T, Kaur Brar S, Verma M, Surampalli RY. An insight into the adsorption of diclofe-nac on different biochars: Mechanisms, surface chemistry, and thermodynamics. Bioresour Technol. 2018;https://doi.org/10.1016/j.biortech.2017.10.039PMID:29055215
69. Yin D, Wang X, Peng B, Tan C, Ma LQ. Effect of biochar and Fe-biochar on Cd and As mobility and transfer in soil-rice system. Chemosphere. 2017;https://doi.org/10.1016/j.chemosphere.2017.07.126 PMID:28830065