In vivo estimation of lamb carcass composition by
real-time ultrasonography
A. Teixeira
a,*, S. Matos
a, S. Rodrigues
a, R. Delfa
b, V. Cadavez
aaEscola Superior Agra´ria, Instituto Polite´cnico de Braganc¸a, Apartado 172. 5301-855 Braganc¸a, Portugal bUnidad de Tecnologı´a en Produccio´n Animal, SIA – DGA, Apto. 727, 50080 Zaragoza, Spain
Received 9 February 2006; received in revised form 22 February 2006; accepted 28 March 2006
Abstract
The objective of this study was to evaluate the accuracy of ultrasonography to measure fat thickness in live lambs and predict carcass composition to find a system that can assess carcass composition easily and accurately, without damage to the product and can improve carcass classification.
Fat thickness (FTh) between the 12th and 13th ribs and between the 3rd and 4th lumbar vertebrae, was measured in vivo using real-time ultrasound, in 67 Churra Galega Braganc¸ana males (mean weight 36.0 kg, range 21.5–47.0 kg), using an ALOKA SSD-500V equipped with two probes (5 and 7.5 MHz) in order to predict carcass composition. The most satisfactory correlation between carcass and ultrasound measurements was between the 3rd and 4th lumbar vertebrae fat thickness (FTh). The first variable admitted in the mod-els to predict carcass composition (live weight, LW) explained between 63% and 96% of the total variation of the weight of the compo-nents of the carcass. In fact, 96% of the variation in total amount of muscle was accounted for by live weight. The inclusion of the ultrasound measures with the 7.5 MHz probe improved, in all prediction equations, the coefficient of determination (R2) with a substan-tial reduction in the residual standard deviation (RSD). In relation to the subcutaneous fat of the carcass, 85% of the variation was explained by live weight and the FTh 12–13 7.5 measurement. In the prediction model for total carcass fat weight, live weight and ultra-sound fat thickness measurement explained 88% of the variation. The results indicate that in vivo ultraultra-sound fat thickness measures in association with live weight can be used to predict carcass composition in Churra Galega Braganc¸ana lambs.
Ó2006 Elsevier Ltd. All rights reserved.
Keywords: Lamb; Fat thickness; Carcass composition; Ultrasound
1. Introduction
The Braganc¸ano breed belongs to the Portuguese Churro group. It is a local breed reared in the NE part of Portugal mainly in Montesinho’s Natural Park, which is one of the largest protected areas in Portugal covering 75,000 ha at an altitude varying from 438 to 1481 m, in a succession of uplands and deep valleys. There are extensive areas of hill grazing, the weather is often harsh, there are wide variations in food supply, and animals are submitted to a wide variation of fat body reserves. So, the knowledge
of carcass composition and the attempts to estimate the body composition in live animals is essential for producers to programme the food supply needs and produce lambs according to consumer requests.
On the other hand, lamb consumers in Mediterranean area and particularly in Portugal require lightweight car-casses (6–10 kg) with more lean and less fat. In order to correspond to consumer demand it becomes more and more important to provide adequate information about carcass composition such as saleable meat or fat, muscle, and bone contents. Therefore, and not different from other species the need for a more accurate method to assess car-cass composition is increasing. Producers, slaughter-houses, processing industries and consumers require an
0309-1740/$ - see front matter Ó2006 Elsevier Ltd. All rights reserved.
doi:10.1016/j.meatsci.2006.03.023
* Corresponding author. Tel.: +351273303206; fax: +351273325405. E-mail address:[email protected](A. Teixeira).
www.elsevier.com/locate/meatsci
Meat Science 74 (2006) 289–295
accurate and practical model to predict carcass composi-tion which can be useful in a classificacomposi-tion and grading sys-tem of sheep.
The use of ultrasound technology to estimate carcass composition in sheep saw the early studies with several authors (Edwards et al., 1989; Fortin & Shrestha, 1986; Hamby, Stouffer, & Smith, 1986; Jones, Walton, Wilton, & Szkotnicki, 1982 & McLaren et al., 1991) with little expectation. The initial cost-effective of the equipment, the small size of fat thickness comparing with other species, the lack of variation in subcutaneous tissue, and the pres-ence of wool were the main limitations of the utility of ultrasound in sheep. In spite of that, subcutaneous fat thickness measured between the 3rd and 4th lumbar verte-brae is a useful predictor of lamb and mutton carcass com-position in a study conducted by Bruwer, Naude´, Toit, Cloete, and Vosloo (1987). AlsoYoung, Nsoso, and Beat-son (1996)studying the factors that affected the repeatabil-ity of tissue depth determination by real-time ultrasound in sheep concluded that the measurements could be accurately assessed from one ultrasound measurement. Analysing the subcutaneous fat distribution assessed by ultrasound in Border Leicester and Dorset Down ewe hoggets, Deaker and Young (1992)reported that their findings had implica-tions for carcass classification, breeding programmes, lean growth and comparison of fatness of different genotypes. Just as Clarke, Dobbie, Uljee, and Wrigglesworth (1997) used the ultrasonic fat and eye muscle dimensions to com-pare weight-selected Romney hoggets for growth. Stan-ford, Clark, and Jones (1995) found a good prediction of saleable meat yield using an ultrasound measurement of subcutaneous fat depth taken at the first lumbar vertebrae (R2= 0.64; RSD = 1.2). Subsequently, Stanford, Jones, and Price (1998)published a review of methods for predict-ing lamb carcass composition with reference to the use of ultrasound for predicting body/carcass composition in sheep.Simm, Lewis, Grundy, and Dingwall (2002)referred that in vivo measurements most widely used have been ultrasonic measures of fat and muscle depth or areas and found from their experimental results that substantial responses can be achieved by selecting sheep on an index of live weight and ultrasonic measurements of fat and mus-cle (Simm, 1992; Simm, Dingwall, & Lewis, 1993).
Previous studies with some sheep breeds from Spain have shown the usefulness of ultrasound to predict carcass composition and suggest that ultrasound fat thickness mea-surements with the live weight, can be good predictors of carcass composition (Delfa et al., 1996; Ferna´ndez, Garcı´a, Vergara, & Gallego, 1998; Mendizabal et al., 2003 & Teixe-ira & Delfa, 1997). Recently, working with the same breed of the present studyCadavez, Teixeira, Delfa, and Rodri-gues (2000) and Cadavez et al. (2001)have been evaluating of ultrasonic measurements of fat thickness to estimate the carcass composition.Silva, Gomes, Dias-da-Silva, Gil, and Azevedo (2005)working with Iˆle de France and the native Portuguese breed Churra da Terra Quente found that body chemical composition of growing lambs can be predicted
by the body weight and real time ultrasonography mea-surements associated with the image analysis. So the objec-tive of this study was to evaluate the accuracy of the ultrasound to measure fat thickness in live lambs and pre-dict the carcass composition and to contribute as to find a system that can assess the carcass composition easily and accurately, without depreciation of the product and improve the carcass classification giving more information to consumers.
2. Material and methods
A total of 67 Churra Galega Braganc¸ana males weighing 21.5–47.0 kg, were selected from the research herd of the Braganc¸a’s School of Agriculture (Escola Superior Agra´ria de Braganc¸a). Sheep were fed on pasture, supplemented with hay from natural grassland (ad libitum) and a supple-ment of commercial concentrates (250 g/animal). All ani-mals had free access to fresh water.
To obtain the measurements, the animals were immobi-lized and an acoustic gel was used to allow a better contact between the probe and the skin of the animal. Animals were held manually while the operator scanned the lumbar region. All procedures were made indoors at the slaughter-house at 15–18°C.
The measures were taken with the two probes in a per-pendicular position to the dorsal medium line, at the level of the largest depth of the musclelongissimus thoracis et lumborum(LTL).
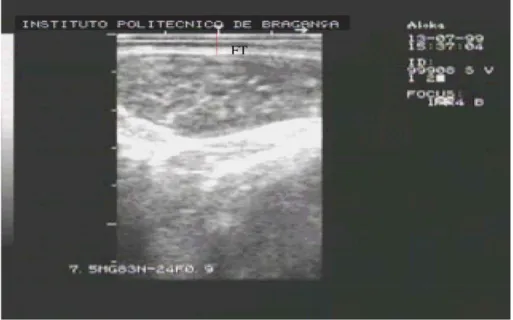
Twenty-four hours before slaughter, real time ultra-sound measurements of fat thickness over thelongissimus thoracis et lumborum muscle between the 12th and 13th rib (FTh 12–13 5 and FTh 12–13 7.5, with the 5 and 7.5 MHz probes, respectively) and between the 3rd and 4th lumbar vertebrae (FTh 3–4 5 and FTh 3–4 7.5, with the 5 and 7.5 MHz probes, respectively) were collected as shown inFig. 1. An ALOKA SSD-500V Real-Time Ultra-sound Scanner, with a 5 and 7.5 MHz probes, was used for all ultrasound measurements. The probes were placed per-pendicular to the backbone, using a gel as coupling med-ium. The fat depth was measured with skin. When an acceptable image of the anatomical points was obtained, it was recorded and video printed and the digitized (Fig. 2). After that the measurements were performed by image analysis with National Institute of Health 1.57 soft-ware(http://rsb.info.nih.gov/njh-image/)to help the oper-ator interpret the image and identify the anatomical points to take the measurements with the same technique in all scanned animals.
All lambs were slaughtered, under the same conditions and in accordance with the laws of ethics and welfare of animals, after 24 h fasting in the experimental slaughter-house at the Braganc¸a’s School of Agriculture. After slaughter, carcasses were cooled at 4°C for 24 h. Carcasses
with measuring calipers, between the 12th and 13th rib (C12–13) and between the 3rd and 4th lumbar vertebrae (C3–4).
The left side of each carcass was divided into eight stan-dardized commercial joints: leg, chump, loin, ribs, anterior ribs, shoulder, breast, and neck. The joint procedure was outlined byTeixeira (1984) according to the Zootechnique National Station cut (Estac¸a˜o Zoote´cnica Nacional - EZN cut) (Calheiros & Neves, 1968). Each joint was then dis-sected into muscle, subcutaneous fat, intermuscular fat, bone, and remainder (major blood vessels, ligaments, ten-dons, and thick connective tissue sheets associated with
muscles). In all 67, carcasses were evaluated and completely dissected.
The relationship between in vivo measurements of fat thickness and the same carcass measurements was analysed by linear correlation (Steel & Torrie, 1980). To estimate carcass composition, the data was analysed (SAS, 1998) by stepwise regression (Ott, 1993) using as independent variables live weight and the ultrasound fat thickness mea-surements in the sequence: untransformed variables; dependent variables on a logarithmic scale and indepen-dent variables on a logarithmic scale. The accuracy of the estimates was evaluated by the determination coefficient (R2) and by the residual standard deviation (RSD).
3. Results and discussion
The means, standard deviation, maximum, and mini-mum of the live weight, ultrasound measurements, and car-cass components are shown in Table 1. All characteristics have a substantial variation suggesting that we have worked with a large range of live weight, fat measurements, and carcass fat depots representative of Braganc¸ano lamb carcasses as normally slaughtered and marketed.
Simple correlation coefficients between ultrasound and carcass measurements, shown in Table 2 indicate that ultrasound and actual fat thickness were moderately corre-lated (r= 0.31–0.42). The best correlation was obtained at the level of the 3rd–4th lumbar vertebrae (r= 0.42;
P< 0.01, with the 5 MHz probe). This confirms the results of Bruwer et al. (1987) that the fat thickness measured between the 3rd and 4th lumbar vertebrae is a useful pre-dictor of carcass composition as well as the results ofDelfa, Teixeira, Blasco, and Colomer-Rocher (1991). The correla-tion coefficients found, for both probes, were also inferior to those obtained byCadavez, Teixeira, Delfa, and Pereira
Fig. 2. Example of a real time ultrasound measurement of fat thickness over thelongissimus thoracis et lumborum musclebetween 12th and 13th rib with 7.5 MHz probe.
(1999a) (r= 0.70 and 0.71 for the 5 and 7.5 MHz probes, respectively) and for Cadavez, Teixeira, and Delfa (1999b) (r= 0.68 and 0.57 for the 5 and 7.5 MHz probes, respectively). Nevertheless, Ferna´ndez et al. (1998) obtained lower correlation coefficients (r between 0.04 and 0.38 with no significance). The correlation coefficients between ultrasound and actual fat thickness measured between the 12th and 13th ribs were very similar
(r= 0.32 and 0.31, for 5 and 7.5 MHz probes, respectively;
P< 0.05). Cadavez et al. (1999a) found, for both probes, correlations of r= 0.73 and 0.81 and Cadavez et al. (1999b)also found significant correlations for both probes (r= 0.58 and 0.66, for the 5 and 7.5 MHz probes, respec-tively). The differences among the correlation coefficients observed in the articles can be due to the different experi-mental conditions, namely the type of animal and the live weight used, and if the animals were shorn or not.
Although the correlation coefficients obtained in this work were all significant, they were lower than expected. This can be due to the fact that we used a group of animals with a large range of live weight,in order to develop predic-tion models of carcass composipredic-tion that are as general as possible, and similar to the live weight variations found in practice. However, the dressing procedures, namely the skinning and the cutting, can lead to alterations of the tis-sues which can be responsible for the lower correlation coefficients observed in this work. The low correlations found can be explained by the light lambs we have worked with which have a very low subcutaneous fat layer and this limits the potential of ultrasound to provide accurate mea-sures as well as the high range in fat depths on the carcass (C 12–13 and C 3–4 measurements) than the ultrasonic fat measurements taken on the live animal (Table 1). Our coef-ficients are lower than those found by Silva et al. (2005) and this can be explained by the different ultrasonic mea-surement procedures. We did not shear and clip the wool as this not possible in a commercial slaughter house.
However, ultrasonic measurements could predict carcass fat thickness as we can see from Table 3, where the best regression equations for predicting carcass composition are shown. These equations were developed by multiple lin-ear regression using live weight and the ultrasound fat thickness measurements as independent variables. With the exception of muscle estimation all the other carcass component estimations were computed on logarithmic scales. This suggests that the fat depots have a logarithmic relationship with live weight as previously shown by Teixe-ira, Delfa, and Colomer-Rocher (1989) TeixeTeixe-ira, Delfa, Gonzalez, Gosalvez, and Tor (1995) working with sheep and goats, respectively. TheR2values were generally high and the results reported were all significant at the
P< 0.001 level.
Live weight was the first variable admitted in the mod-els. This variable accounted for 63–96% of the variation in carcass tissue weights. These results agree with those found byDelfa et al. (1996), Ferna´ndez et al. (1998), Hop-kins (1990), Mendizabal et al. (2003) and Silva et al. (2005) and Teixeira and Delfa (1997). On the other hand,Ramsey, Kirton, Hogg, and Dobbie (1991)were of the opinion that the improvements in accuracy of prediction due to live weight were not sufficient to warrant the use of this vari-able in multiple regression equations, which is not in agree-ment with the results obtained in the present work.
The better equations were obtained by the utilization of a high-frequency probe (7.5 MHz) as was reported bySilva Table 1
Means, maximum, minimum and standard deviation of the live weight, ultrasound measurements and carcass components
Mean Maximum Minimum Standard deviation
Live weight (kg) 36.0 47.0 21.5 8.3
Muscle (kg) 9.2 13.0 4.8 2.3
Subcutaneous fat (kg) 1.6 3.1 0.4 0.8
Intermuscular fat (kg) 2.4 4.2 1.0 0.9
Kidney and pelvic fat (kg) 0.6 3.4 0.1 0.3
Bone (kg) 2.7 3.8 1.6 0.6
Total carcass fat (kg) 4.6 8.6 1.6 1.8
FTh 12–13 5 (mm) 0.41 0.7 0.2 0.12
FTh 12–13 7.5 (mm) 0.36 0.6 0.2 0.11
FTh 3–4 5 (mm) 0.46 0.8 0.2 0.15
FTh 3–4 7.5 (mm) 0.42 0.7 0.1 0.13
C 12–13 (mm) 0.35 1.6 0.13 0.21
C 3–4 (mm) 0.56 1.5 0.2 0.25
FTh 12–13 5 – fat thickness over thelongissimus thoracis et lumborum muscle between the 12th and 13th rib with the 5 MHz probe.
FTh 12–13 7.5 – fat thickness over thelongissimus thoracis et lumborum muscle between the 12th and 13th rib with the 7.5 MHz probe.
FTh 3–4 5 – fat thickness over thelongissimus thoracis et lumborummuscle between the 3rd and 4th lumbar vertebrae with the 5 MHz probe. FTh 3–4 7.5 – fat thickness over thelongissimus thoracis et lumborum muscle between the 3rd and 4th lumbar vertebrae with the 7.5 MHz probe. C 12–13 – carcass fat thickness measurement C between the 12th and 13th rib.
C 3–4 – carcass fat thickness measurement C between the 3rd and 4th lumbar vertebrae.
Table 2
Correlation coefficients (r) between ultrasound and carcass fat thickness
Carcass measures
C12–13 C3–4
FTh 12–13 5 0.32*
FTh 3–4 5 0.42**
FTh 12–13 7.5 0.31*
FTh 3–4 7.5 0.35**
FTh 12–13 5 – fat thickness over thelongissimus thoracis et lumborum muscle between the 12th and 13th rib with the 5 MHz probe.
FTh 12–13 7.5 – fat thickness over thelongissimus thoracis et lumborum muscle between the 12th and 13th rib with the 7.5 MHz probe.
FTh 3–4 5 – fat thickness over thelongissimus thoracis et lumborummuscle between the 3rd and 4ptth lumbar vertebrae with the 5 MHz probe. FTh 3–4 7.5 – fat thickness over the longissimus thoracis et lumborum muscle between the 3rd and 4th lumbar vertebrae with the 7.5 MHz probe. C 12–13 – carcass fat thickness measurement C between the 12th and 13th rib.
C 3–4 – carcass fat thickness measurement C between the 3rd and 4th lumbar vertebrae.
et al. (2005). The FTh 12–13 7.5 measurement was included in the prediction models for subcutaneous, intermuscular, kidney and pelvic fat and total carcass fat. The inclusion of this measurement increased the determination coefficient between 2% and 4%, but more important, was the decrease in RSD of between 6% and 13%, increasing the accuracy of the estimation.
Although some authors have shown that the inclusion of ultrasound measurements in the multiple regression equa-tions for predicting carcass composition provided only a small improvement in the accuracy of the prediction ( Cut-hbertson, Croston, & Jones, 1984; Leymaster, Mersmann, & Jenkins,1985; Yates, Cuthbertson, & Owen, 1985; Yates et al., 1993) and expressed doubts about the usefulness of these measurements as predictors of carcass composition, in the present work we found the opposite as can seen from the results inTable 3. Nevertheless, the potential use of this technique to predict the weight of the different tissues of the carcass has been demonstrated by several authors (Delfa, Teixeira, Gonzalez, & Blasco, 1995, 1996; Ferna´ndez et al., 1998; Hopkins, 1990; Kempster, Arnall, Alliston, & Barker, 1982; Mendizabal et al., 2003; Teixeira & Delfa, 1997).
All relationships are highly significant as we can see in Table 3. In fact, 96% of the variation in the total amount of muscle was accounted for by live weight, and none of the ultrasound measurements admitted as independent variables in the model, as previously found by Teixeira and Delfa (1997) (R2= 0.94). Also, Delfa et al. (1995) found similar results for muscle prediction, however, they obtained smaller determination coefficients (R2= 0.21;
P< 0.01). For muscle content live weight alone accounted for 92% of the variation of total weight of carcass bone. Nevertheless,Delfa et al. (1995)found that live weight only accounted for 19% of the variation of the bone weight. The
inclusion of ultrasound fat thickness measurement at the 4th lumbar vertebra allowed a significant (P< 0.05) improvement in the accuracy of the prediction, providing an increase in the determination coefficient of 31% and a decrease in RSD of 20.4%. On the other hand, Delfa et al. (1996)found that none of the ultrasound fat thickness measurements was admitted in the model as a predictor of the weight of the bone, butTeixeira and Delfa (1997) work-ing with two probes and uswork-ing live weight and the ultra-sound fat thickness measurement as independent variables in a multiple regression equation, found that these two variables explained 84% of the variation of the weight of the bone in agreement with our findings.
In relation to the subcutaneous fat of the carcass we observed that 85% of the variation was explained (P< 0.001) by live weight and the FTh 12–13 7.5 measure-ment. The inclusion of the ultrasound measurement in the multiple regression equation increased by 4% the precision of the prediction, allowing a decrease in RSD of 10%. Sim-ilarly, Cadavez et al. (2000) used the same measure and explained 59.5% of the variation of the weight of this tis-sue. They found an improvement in the precision of the prediction when they used live weight in a multiple regres-sion with the fat thickness measurement, using a 5 MHz probe, agreeing with the work of Ferna´ndez et al. (1998). In the work of Delfa et al. (1995), live weight accounts for only 18% of the total variation of the carcass subcuta-neous fat weight. When fat thickness measured at the 4th lumbar vertebra was included in the model the variation explained was higher (R2= 0.54), however, this value is less than the value obtained in the present work.
Taking into account our results, it was also possible to predict the intermuscular fat of the carcass accurately. Live weight and fat thickness measurement explained 84% of the variation of the weight of this tissue. Live weight was again Table 3
Multiple regression equations using live weight and ultrasound fat thickness measurements for predicting carcass composition (g)
Dependent variables Independent variables a b sb R2 RSD
Muscle LW 296.85 135.92 3.47 0.96*** 214.6
Log SF Log LW 0.54 1.64 0.16 0.81 0.10
Log FTh 12–13 7.5 0.45 0.12 0.85*** 0.09
Log IF Log LW 1.34 1.18 0.11 0.82 0.069
Log FTh 12–13 7.5 0.24 0.08 0.84*** 0.066
Log KP Log LW 0.52 1.75 0.26 0.63 0.17
Log FTh 12–13 7.5 0.54 0.25 0.66*** 0.16
Log TF Log LW 1.35 1.38 0.10 0.85 0.08
Log FTh 12–13 7.5 0.33 0.09 0.88*** 0.07
Log B Log LW 1.68 0.93 0.04 0.92*** 0.03
log10(fat depots) =blog10(independent variable) +a.
a= intercept;b= regression coefficient; sb = standard deviation ofb.
SF – subcutaneous fat; IF – intermuscular fat; KP - kidney and pelvic fat; TF – total carcass fat; B – bone. LW – live weight.
the first variable used in the regression model, explaining, by itself, 82% of the variation of the weight of intermuscu-lar fat, a value higher than that obtained by Delfa et al. (1995) (R2= 0.47), Delfa et al. (1996) (R2= 0.47) and Teixeira and Delfa (1997)(R2= 0.50). The values obtained in our work were more accurate than those observed by Teixeira and Delfa (1997) (R2= 0.70) and Delfa et al. (1995)(R2= 0.60), although in this last paper, the predic-tor used was the fat thickness measured at the 4th lumbar vertebra.
The weight of the kidney and pelvic fat of the carcass was predicted with high significance (P< 0.001). Live weight was, once again, the first variable admitted in the prediction model, accounting for 63% of the variation of the weight of this tissue. These results are more accurate than the values found by Delfa et al. (1996) (R2= 0.48) and are not in agreement with the results of Delfa et al. (1995), who found that live weight was not a good predic-tor of the weight of this tissue. The inclusion of the FTh 12–13 7.5 measurement improved the accuracy of the pre-diction model of 3% and led to a decrease in RSD of 5.9%. These results are not in agreement withDelfa et al. (1995), which found that the inclusion of the ultrasound fat thick-ness measurements in the models did not improve the accu-racy of the prediction. The different accuaccu-racy for the kidney and pelvic fat prediction found in several studies could be explained by the development of this tissue. In fact, But-ler-Hogg (1982)reported that kidney and pelvic fat had a biphasic development and can vary between breeds.
In the prediction model for total carcass fat weight, live weight and the ultrasound fat thickness measurement explained 88% of the variation. Live weight, by itself, explained 85% of the variation. These results differ from those obtained by Delfa et al. (1995, 1996) in which live weight only accounted for 26% and 44%, respectively, of the total carcass fat weight. The differences between the studies are the results of the different experimental condi-tions. So, prediction equations should be determined for each breed, according to the production system and not generalized.
4. Conclusion
Ultrasound measurements allowed us to obtain, in vivo, good predictions of the fat thickness of the car-cass. Although the correlation coefficients obtained in this work were all significant they were lower than expected, however, from our point of view, ultrasound is an effec-tive technique to measure subcutaneous fat thickness. Under our experimental conditions with unshaven ani-mals, using portable equipment as our Real-Time Ultra-sound Scanner, it is possible to do the work at the slaughterhouse or in the field. Live weight was an impor-tant variable, since it explained the largest variance per-centage in the models and was the first variable admitted in the models for carcass composition. The in vivo ultrasound fat thickness measurements when they
were admitted in the models improved the determination coefficient, but more importantly, they allowed a consid-erable reduction in the residual standard deviation of the prediction, the ultrasound fat thickness measurement being taken between the 12th and 13th rib with the 7.5 MHz probe.
Acknowledgement
Financial support for this study by POCTI project of Ministe´rio de Cieˆncia e Tecnologia do Governo de Portu-gal is gratefully acknowledged.
References
Bruwer, G. G., Naude´, R. T., Toit, M. M. du, Cloete, A., & Vosloo, W. A. (1987). An evaluation of the lamb and mutton carcase grading system in the Republic of South Africa. 2. The use of fat measurements as predictors of carcase composition.South African Journal of Animal Science, 17(2), 85–89.
Butler-Hogg, B. W. (1982). Fat partitioning in Clun and Southdown lambs.Animal Production, 34, 377 (Abstract).
Cadavez, V., Rodrigues, S., Delfa, R., Pereira, E., Matos, S., & Teixeira, A. (2001). Estimacio´n de la composicio´n de la canal por ultrasonidos y por el modelo comunitario de la clasificacio´n de canales ligeras.ITEA, IX Jornadas sobre Produccio´n Animal, 22(II), 622–624.
Cadavez, V., Teixeira, A., & Delfa, R. (1999b). Utilizacio´n de ultrasonidos junto con el peso vivo y el peso de la canal caliente para la estimacio´n del peso de las piezas de carnicerı´a en corderos de la raza Churra Galega Braganc¸ana: comparacio´n de sondas de 5 e 7,5 MHz. Produccio´n ovina y caprina. SEOC, XXIV, 425–432.
Cadavez, V., Teixeira, A., Delfa, R., & Pereira, E. (1999a). Precision de los ultrasonidos (sondas de 5 y 7,5 MHz) en la determinacio´n del espesor de la grasa subcuta´nea y de la profundidad del M. longissimus dorsi in vivo y en la canal.ITEA, VIII Jornadas sobre Produccio´n Animal, 20(I), 119–121.
Cadavez, V., Teixeira, A., Delfa, R., & Rodrigues, S. (2000). Utilizacion de ultrasonidos y el peso vivo para la prediccio´n in vivo de la composicio´n de la canal en corderos. Produccio´n ovina y caprina. SEOC, XXV, 165–168.
Calheiros, F., & Neves, A. (1968). Rendimentos ponderais no borrego Merino Precoce. Carcac¸a e 5°Quarto.Separata do Boletim Pecua´rio, XXXVI, 117–126.
Clarke, J. N., Dobbie, K. R., Jones K. R., Uljee, A. E., & Wrigglesworth, A. L. (1997).New Zealand Society of Animal Production, Abstract 81. Cuthbertson, A., Croston, D., & Jones, D. W. (1984). In vivo estimation of lamb carcass composition and muscle tissue growth rate. In D. Lister (Ed.),In vivo measurement of body composition in meat animals (pp. 163–166). Amsterdam: Elsevier Applied Science.
Deaker, J. M., & Young, M. J. (1992). Subcutaneous fat distribution as assessed by ultrasound in Border Leicester and Dorset Down ewe hoggets.Proceedings of the New Zealand Society of Animal Production, 52, 45–48.
Delfa, R., Gonza´lez, C., Vijil, E., Teixeira, A., Tor, M., & Gosa´lvez, L. (1996). Ultrasonic measurements for predicting carcass quality and body fat depots in ternasco of Aragon–Spain. InProceedings EAAP, Sheep and Goot Production(pp. 3). Lillehammer. Session V. Wagen-ingen, The Netherlands: Wageningen Pers.
Delfa, R., Teixeira, A., Blasco, I., & Colomer-Rocher, F. (1991). Ultrasonic estimates of fat thickness, C measurement and longissimus dorsi depth in Rasa Aragonesa ewes with same body condition score. Options Me´diterrane´ennes, 13, 25–30.
predicting carcass composition of live Aragon lambs.Small Ruminant Research, 16, 159–164.
Edwards, J. W., Cannell, R. C., Garrett, R. P., Savell, J. W., Cross, H. R., & Longnecker, M. T. (1989). Using ultrasound, linear measurements and live fat thickness estimates to determine the carcass composition of market lambs.Journal of Animal Science, 67, 3322–3330.
Ferna´ndez, C., Garcı´a, A., Vergara, H., & Gallego, L. (1998). Using ultrasound to determine fat thickness and longissimus dorsi area on Manchego lambs of different live weight.Small Ruminant Research, 27, 159–165.
Fortin, A., & Shrestha, J. N. B. (1986). In vivo estimation of carcass meat by ultrasound in ram lambs slaughtered at an average live weight of 37 Kg.Animal Production, 43, 469–475.
Hamby, P. L., Stouffer, J. R., & Smith, S. B. (1986). Muscle metabolism and real time ultrasound measurement of muscle and subcutaneous adipose tissue growth in lambs fed diets containing a beta-agonist. Journal of Animal Science, 63, 1410–1417.
Hopkins, D. L. (1990). The use of ultrasound to predict fatness in lambs. Meat Science, 27, 275–281.
Jones, S. D. M., Walton, J. S., Wilton, J. W., & Szkotnicki, J. E. (1982). The use of urea dilution and ultrasonic backfat thickness to predict the carcass composition of live lambs and cattle. Canadian Journal of Animal Science, 69, 641–648.
Kempster, A. J., Arnall, D., Alliston, J. C., & Barker, J. D. (1982). An evaluation of two ultrasonic machines (Scanogram and Danscanner) for predicting the body composition of live sheep.Animal Production, 34, 249–255.
Leymaster, K. A., Mersmann, H. J., & Jenkins, T. G. (1985). Prediction of the chemical composition of sheep by use of ultrasound.Journal of Animal Science, 61(1), 165–172.
McLaren, D. G., Novakofski, J., Parrett, D. F., Lo, L. L., Singh, S. D., Neumann, K. R., & McKeith, F. K. (1991). A study of operator effects on ultrasonic measures of fat depth and longissimus muscle area in cattle, sheep and pigs.Journal of Animal Science, 69, 54–66. Mendizabal, J. A., Delfa, R., Arana, A., Eguinoa, P., Gonza´lez, C.,
Treacher, T., et al. (2003). Estimating fat reserves in Rasa Aragonesa ewes: a comparison of different methods.Canadian Journal of Animal Science, 83, 695–701.
Ott, R. L. (1993).An introduction to statistical methods and data analysis pp. 1051 (4th ed.). Belmont, Califo´rnia: Duxbury Press.
Pa´lsson, H. (1939). Meat qualities in the sheep with special reference to Scottish breeds and crosses. I.Journal of Agricultural Science, XXIX, 544–626.
Ramsey, C. B., Kirton, A. H., Hogg, B., & Dobbie, J. L. (1991). Ultrasonic, needle, and carcass measurements for predicting chemical composition of lamb carcasses.Journal Animal Science, 69, 3655–3664.
SAS (1998).SAS/SAT user’s guide, release 6.03 ednpp. 1028. Cary, NC: SAS Institute Inc..
Silva, S. R., Gomes, M. J., Dias-da-Silva, A., Gil, L. F., & Azevedo, J. M. T. (2005). Estimation in vivo of body and carcass chemical compo-sition of growing lambs by real-time ultrasonography. Journal of Animal Science, 83, 350–357.
Simm, G. (1992). Selection for lean meat production in sheep. In A. W. Speedy (Ed.), Progress in sheep and goat research (pp. 193–215). Wallingford, UK: Cab International.
Simm, G., Dingwall, W. S., & Lewis, R. M. (1993). Genetic improvement of meat production. In Proceedings of the third international sheep veterinary conference, Edinburgh, June 27–July 1. Sheep Veterinary Society, Division of the British Veterinary Association.
Simm, G., Lewis, R. M., Grundy, B., & Dingwall, W. S. (2002). Responses to selection for lean growth in sheep.Animal Science, 74, 39–50. Stanford, K., Clark, I., & Jones, S. D. M. (1995). Use of ultrasound in
prediction of carcass characteristics in lambs. Canadian Journal of Animal Science, 75, 185–189.
Stanford, K., Jones, S. D. M., & Price, M. A. (1998). Methods of predicting lamb carcass composition: a review. Small Ruminant Research, 29, 241–254.
Steel, R. G. D., & Torrie, J. H. (1980). Principles and procedures of statistics. a biometrical approach (pp. 633) (2nd ed.). New York: McGraw-Hill International Book Company.
Teixeira, A. (1984). Avaliac¸a˜o das carcac¸as de borregos do grupoe´tnico Churro Galego Braganc¸ano e seu cruzamento com a rac¸a Milchschaf. Relato´rio de esta´gio do curso de Engenharia Zoote´cnica da UTAD-Vila Real.
Teixeira, A., & Delfa, R. (1997). The use of ultrasonic measurements assessed with two probes in live lambs for prediction the carcass composition. InProceedings of the 48th annual meeting of the European association for animal production (No. 3, p. 295). Wageningen, The Netherlands: Wageningen Pers.
Teixeira, A., Delfa, R., & Colomer-Rocher, F. (1989). Relationships between fat depots and body condition score or tail fatness in the Rasa Aragonesa breed.Animal Production, 49, 275–280.
Teixeira, A., Delfa, R., Gonzalez, C., Gosalvez, L., & Tor, M. (1995). Use of three joints as predictors of carcass and body fat depots in Blanca Celtibe´rica goats.Options Me´diterrane´ennes, Se´rie A, 27, 121–131. Yates, C. M., Cuthbertson, A., & Owen, M. G. (1993). The role of cut
surface muscle area in the prediction of carcass composition on beef, lamb and pork.Animal Production, 56, 426 (Abstract).