Fountaine Pajot Valuation
Rui Pedro Mendes Roque – 22046
A Project carried out on the Master in Management Program,
under the supervision of:
Prof. António Nogueira Leite
Fountaine Pajot Valuation
Abstract
Fountaine Pajot is the second biggest player in the Catamaran market, a market that has been recovering from the European crisis recently. However, even with the large growth that the firm has experienced in the last years and the exceptional fundamentals it has, the stock market price seems not to fully reflect fundamentals. The purpose of the project was to find out why the market price does not follow the solid financial performance of the company in the last years, as well as expectations that it continues to grow. This project was addressed using the DCF method and relative valuation
Key words :
- Discounted Cash Flow - Multiples
- Recreational Craft - Catamaran
1. Introduction :
Established in 1976, Fountaine Pajot is a French company worldwide known as one of the main players in the Catamaran market, producing and selling these type of boats. Complementarily they offer as well maintenance and repair services after the sale.
Fountaine Pajot was chosen to be analysed from the financial point of view due :
- Being one key players in the catamaran industry, and industry that is growing, valued over $1.5 billion in 2017 and expected to represent in 2024, $2.2 billion dollars
- Is one of the companies quoted in the French stock market, Euronext Paris, with a market capitalization of €157 M
- Employees directly 600 people
- Analysing from a strategic and financial view what made the firm grow from a family business to the second biggest catamaran manufacturer in the world
The objective of this work is to analyse the company from a financial perspective, calculate the share price according to the methods chosen, and recommend a type of investment strategy for the stock, depending on the share price and the expectations of valuation or devaluation. With this, it is expected as well, to understand how the catamaran market is and will behave, as Fountaine Pajot is representative of the sector. In order to reach the objectives here established it is important to apply the concepts and methods used internationally and in the financial world, created by acclaimed authors. It is also fundamental to understand the dynamics of the market where the firm operates, and what are the perspectives for the future. This together with the strategy defined by the management team of the company, will allow us to know what are the objectives of the company and where they want to be positioned in the market.
This work will start with the literature review, where it will be exposed and analysed what are the methods commonly used and proposed by the relevant authors, that we will use to evaluate the company and it´s share price.
Then, there will be an analysis of the catamaran market, what are the trends for the future, and also a description of Fountaine Pajot business and strategy. Subsequently we provide an analysis of the financial performance of the company and a projection for the future. Lastly we present an evaluation of the company share price which will have attached a recommendation of investment according to the projected trend for the future.
2. Literature Review
According to Damodaran (2012) there are three different methods to assess the valuation of assets : Discounted Cash Flow (DCF), which measures the value of the asset through the expected future cash flows. The relative valuation, a comparison of different ratios between similar assets. Contingent claim valuation, uses option pricing models. Just the first two methods will be used to evaluate Fountain Pajot, as they were explored during the finance courses in the Masters.
2.1 – Discounted Cash Flow
DCF basis is that the value of an asset is equivalent to the sum of the present values of the future cash flows generated by this asset, reflected in this formula :
Asset Value = ∑ 𝐶𝐹(𝑡) (1+𝑟)^𝑡 𝑡=𝑛 𝑡=1
The DCF method is different from most of the other ways, relative methods, to estimate the value of the company, as is not relative, it has to be only with information of the company and the adequate interest rate defined by the analyst. The interest rate will reflect the risk of the cash flows, the higher it is, the riskier the asset is. It is expected to be calculated the intrinsic value of the company upon it´s fundamentals, assuming that the expected cash flows are right and the interest rate is the right one too (Damodaran
2012). According to Modigliani & Miller (1958) the value of the assets of a company is the capital invested in the company, which can be decomposed in equity and liabilities, being the total value of the company the sum of both debt and equity values. With this, it is recommended by Koller (2005) to evaluate the company value, to use the WACC for discounting to the present of the Free Cash Flow to Firm and sum the discounted FCF.
2.1.1 – Free Cash Flow to Firm
This method consists in the sum of the Free Cash Flows of the firm discounted for the present with the WACC. With this formula it can be calculated the enterprise value : Enterprise Value = ∑ 𝐹𝐶𝐹𝐹(𝑡)
(1+𝑊𝐴𝐶𝐶)^𝑡 𝑡=∞
𝑡=1
Not like an investment project or any type of equipment, which have a certain lifetime, a company has activity for an undefined time, meaning it is not possible to elaborate annual discounts forever. So the formula assumes a perpetuity basis, being
decomposed like this : ∑ 𝐹𝐶𝐹𝐹(𝑡)
(1+𝑊𝐴𝐶𝐶)^𝑡 𝑡=∞ 𝑡=1 + 𝐹𝐶𝐹𝐹(𝑁+1) 𝑊𝐴𝐶𝐶−𝑔 (1+𝑊𝐴𝐶𝐶)^𝑛
The value of the company is the sum of the projected discount cash flows, plus the perpetuity cash flows, assumed to grow at a constant rate “g” forever.
Free Cash Flow to Firm consists in the amount of cash flow from operations available for the shareholders and debtholders distribution, after depreciation expenses, taxes, working capital, and investments are paid. It can be represented in many ways, with this formula being the simplest one
FCFF(t) =EBIT(t)×(1−T)+Depreciations(t)−Capex(t)−Networking Capital(t)
2.1.2 - WACC - Weighted Average Cost of Capital is the interest rate used to discount the FCF to the present. It represents the opportunity cost that the company faces by
investing their capital in one asset instead of investing in others with the same level of risk (Koller 2005). WACC formula is composed by the weighted average of the return of equity (re) and the cost of debt (rd), with taxes deducted :
WACC= E/(D+E)×re+D/(D+E)×rd×(1−T)
The debt and equity weights correspond to the weights that the firm wants for his capital structure and not necessarily the capital structure it has at the moment. The return on equity and cost of debt are based on the market, as the WACC represents the risk that the company has by investing in that asset and not in others with similar risk in the market.
2.1.3 – Return on Equity – The most common method to calculate the return on equity is the CAPM – Capital Asset Pricing Model (Koller 2005). This model takes in account the risk of the asset regarding the market, in order to measure the return. The return of equity of an asset is equal to the sum of a riskless asset plus the risk of the market, represented by the market risk premium, multiplied per the correlation of the stock with the market : re= rf+β×(rm−rf)
In this model the risk free rate (rf) and the market risk premium (rm-rf) are the same for ever company in the market. What differs one company from the others is the
beta, which represents the risk of the stock compared to the market as a whole,
systematic risk of the stock. If beta is bigger than 1 it means that the stock has more risk, more volatility than the market, as if less than 1 meaning that the stock has less volatility than the market, less risk.
2.1.4 – Equity Value – After estimating the company value through the FCF and WACC, we can estimate the equity value with the formula :
Equity = Enterprise value – Debt and Debt Equivalents – Non Controlling Interest – Preferred Stock + Cash and Cash Equivalents
Then the share price is obtained through the ratio between the equity value and the number of shares : Share price : Equity/ # shares
2.2 – Relative valuation – Commonly known also as Multiples Approach, is a method based on the idea that similar assets are sold at similar price. This valuation method compares different ratios and financial indicators between similar firms or the market itself, normally from the same industry. It is assumed that a certain financial metric can be applied to measure the performance of a certain or several companies of the industry. The DCF method is clearly the most unanimous between the specialists and rigorous way to analyse the value of the company, according to Koller (2005) the comparison of the company with the industry is useful to identify the main drivers of the firm value, identify the firms strengths and weaknesses, explain the difference of performance between the firms and the competition and even test the consistency of the projections. According to Damodaran (2012) the multiples approach has some advantages and disadvantages relative to the DCF method. It is very simple to calculate and to understand, and also reflects how the market is working, reflecting what is the trend and which are the patterns of the industry. Still this method can lead to wrong conclusions if his flaws are not recognized. The selection of the companies to compare with is very important, as they have to be similar. Also if the market is over or undervaluing some companies, it can lead to inaccurate conclusions and interpretation of the effect of various factors.
For a solid multiple approach are necessary certain indicators and financial metrics than can be comparable between firms, with both Koller (2005) and Damodaran (2009) suggesting to use different types of multiples such as earnings multiples and book value multiples.
2.2.1- Earnings Multiples
Earnings multiples are the most common used measures of relative valuation, with the P/E ratio and Enterprise Value/ EBITDA ratio (EV/EBITDA) being unanimously, among the specialists, essential for a solid multiple approach.
P/E ratio is simple ratio between the share price and the earnings per share :
P/E Ratio = Share market price/ Earnings per Share
It also can be calculated with this formula :
P/E Ratio = Equity/ Total Earnings
The main advantage of this metric is that is easily composed by the information on an income statement and on a market database. Still it can be misleading as it depends on many factors as the capital structure of the company.
The Enterprise Value/ EBITDA relates the value of the enterprise with the results before taxes, depreciations and interest. According to Damodaran (2012), this is became a really popular and useful ratio as it minimize the risk of lack of conditions of comparison due to different depreciation criteria. Also there are less companies with negative EBITDA than negative cash flows, allowing for a bigger base of comparison. But the main advantage of this ratio relative the P/E ratio is that as EBITDA does not take in consideration debt costs, is independent of the company capital structure.
Multiple EV/EBITDA = EV = (Equity + Debt – Non-Operating Assets)/ EBITDA =( Net Income + Interest +Taxes + Depreciation + Amortization)
2.2.2 – Sales Multiples – Another popular type of indicators are the sales multiples. Damodaran (2012) states this has to do with the fact that sales are never negative and that normally do not present much volatility when compared to the results, that are more subject to other factors. Still it can mislead as there are cases where companies have big
volume of sales, but due small margins and anomalies on inventories, can have small or even negative cash flows. The two main sales metrics are :
Multiple Enterprise Value/ Sales = EV/ # Sales
Multiple Price value/ Sales = Price/ # Sales
The Price/Sales multiple has the limitation that it attributes less value to the companies that have more debt in their capital structure, which can lead to inconsistency in results.
2.2.3 – Book multiples
The main book multiple is the Price to book multiple :
Price to book multiple = market capitalization/ Total book value
Or P/B ratio = market price per share/ book value per share
It can be interpreted as the value that market actors give to the company´s equity relative to its book value equity. A higher ratio means that maybe you are paying too much for that stock, overvalued. Usually the market equity value is higher than the book value of a company, only in special situations like bankruptcy the P/B ratio can be less than one. The market equity is normally higher as the accounting equity does not recognize intangible asset, such as the R&D contributions or the brand value. The book value is intuitive and easy to compare with the market price, and it can be used to companies with negative earnings but with positive values, as there are not much firms with negative book values.
3. The Catamaran Industry
3.1 – Market
According to the European Commission, Naval industry is a sector that includes all the entities that perform on the construction and/or repair of boats and ships. So the main
activity related with this sector involves the various steps in the construction and development of a specific type of boat such as a Catamaran or a Ship.
Fountaine Pajot builds Catamarans, a type of boat that is considered a Recreational Craft. According to the European Commission, a Recreational Craft is defined as a boat with hull length between 2,5m and 24m, and are intended for sport or leisure use. “This sector includes manufacture of inflatable boats and rafts, building of sailboats with or without auxiliary motor, building of motor boats, building of recreation type
hovercraft, manufacture of personal watercraft, canoes, kayaks, rowing boats and skiffs, all between those hull lengths” (Eurostat)
Accounting all the services, charters, marina and other businesses directly related to the leisure boats, the market in Europe is valued today in €34 billion, and employees 1 million people, distributed in 100 thousand companies. There are around 25 million recreational boats registered in Europe, with 36 million Europeans participating regularly in boating activities, all this supported by 25 thousand marinas, which shows that the recreational boating market has a large dimension in Europe.
According with the NMMA, the U.S has even a bigger market, as they represent almost 75% of the entire world market for this type of products. In 2017 they had registered over 11.9 million new vessels, almost half of the total value of boats registered in Europe.
According to Statista data, when comparing Europe and the US, the two biggest markets of leisure boats, we can verify that the US has a bigger market, with around 87 million people participating in leisure boat activities, comparing to 36 million in Europe. Also, in 2016 it was spent in the US $36 billion in this sector, more than the €34 billion estimated for the European market. Regarding only the value of the boats manufactured per region, disregarding the other businesses related to the sector such as the charters
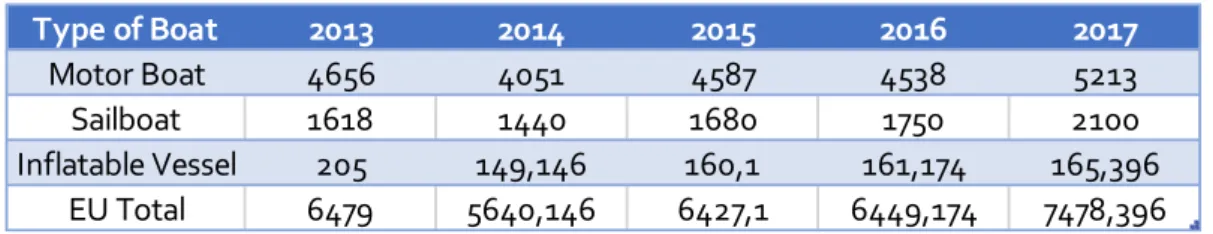
and marinas, Europe had a bigger manufacturing value than the US, producing around €6.5 billion in leisure boats, against $5.3 billion production in American soil. The manufacturing value has been stable in Europe in the last years, but below 2008 value €7,3 billion , suggesting that the industry has been recovering in the last years.
Still in 2017 was reported that the manufacturing value in recreational boats reached a value of €7.5 billions , which surpasses the values before the financial crisis of 2008. When comparing net exports, Europe is a bigger exporter than the US, exporting to the US in a ratio of 3:1 in Europe favour. Since 2015, with the strength of the dollar, the US became a net importer in this industry. In 2016, for example, they exported $1.6 billion in leisure marine craft, while in the same year Europe exported around €7 billion. The European balance of trade in this industry has been growing in the last years, with the exports increasing at a bigger rate than the imports, which shows an increasing demand for the leisure boat market outside of Europe.
In 2016 the biggest producers in Europe were: Italy, Netherlands, France, UK and Germany, by this order.
Type of Boat 2013 2014 2015 2016 2017 Motor Boat 4656 4051 4587 4538 5213 Sailboat 1618 1440 1680 1750 2100 Inflatable Vessel 205 149,146 160,1 161,174 165,396 EU Total 6479 5640,146 6427,1 6449,174 7478,396 Ex/Im 2013 2014 2015 2016 2017 Export 2968,7 3442,3 5397,2 7268,2 5587,9 Import 1178,8 2130,7 1445,4 4063,9 2029,4 Balance of Trade 1789,9 1311,6 3951,8 3204,3 3558,5
Figure 1 – Revenue per type of leisure boat in million €, EU-28 Source: Eurostat
Figure 2 – Balance of trade in million €, EU-28 Source : Eurostat
All Fountaine Pajot models have their hulls between 2,5m and 24m, so their catamarans are considered part of the Recreational Craft market. Catamaran is a very specific type of boat, easily identified by their unique design and their two hulls watercraft, that gives more stability to the boat. It is considered a luxurious boat. Another performance advantage of the Catamarans is that they have less water resistance compared to the monohull models, meaning that they need less power to increase their speed when comparing to the other models. Catamarans normally have more space and boarding capacity comparing to the mono-hull boats of similar size.
There are sailing catamarans and engine powered ones, both are manufactured by Fountaine Pajot. Originally used for sport or racing purposes, today Catamarans are used mostly for passenger transport, cruising and recreational purposes. Europe holds the largest share of the global catamarans market production industry, mostly by the advanced manufacture infrastructures we have. France by itself produces 60% of the catamarans in the market. The main players in the industry are the French companies Fountaine Pajot, Lagoon, Catana., but also the Germans Nautitech and South Africans Leopard.
Unfortunately, there is not much data regarding the catamaran industry specifically, as there is lack of representation and associations of this boat sector across the world. The only data available was found in independent studies of statistics and market insight companies. In 2017 the catamaran industry value was over $1,5 billion, involving not
Country Motor boats Inflatable Vessels Sailboats Total Market %
Italy 1821,23 73,61 258,27 2153,11 33%
Netherlands 990,28 0 86,1 1076,38 17%
France 273,74 8,1 624,77 906,61 14%
UK 407,34 40,8 359,28 807,42 12%
Germany 742,81 0 0 742,81 11%
Figure 3 – Revenues per country and per type of boat, in million € Source : Eurostat
only the building sector, but also the services and charters activities. In Europe it was valued around $800 million.
According to multiple studies, the Catamaran industry is expected to grow with a CAGR between 2,7% and 5,8% in the next 6 years. This has to do with the increase in the demand for this type of boat.
Catamarans are considered faster, safer, stable and more reliable when compared to most of the monohull boats. Tourism has been growing at bigger rates than the economy, and so increases the interest in marine and coastal tourism, in sailing, cruising and water sports. Most of the markets are recovering from the crisis, and markets like China and India have been experiencing an increase in their buying power. These developing economies do not have the infrastructures neither the capacity to supply their own demand, so they search for the American and European market. The “made in Europe” brand means quality and luxury, brands like Ferretti or Benetti are famous for their quality and beautifully designed boats, giving the perception that a boat made in Europe it is guarantee of quality product. The rapid economic development, the rise in disposable income with the increase High Network Individuals, make the demand for this type of luxurious boats to increase.
Still the demand for leisure boats is shifting, as people are spending less days in a boat, there is reduction in the number of ownerships, as renting is getting more and more popular. According to the study on competitiveness of the European recreational craft sector, less people are buying boats, instead charter companies are buying the boats and renting for a limited time, and more people are looking to rent from this companies, Most of the companies in recreational boat industry are SME´s, around 95%, as the high end of the market is dominated by a small group of big manufacturers. It will be very
important for the European industry that the SME´s, that do not have economies of scale and have very traditional production processes, adapt to this shifting in the demand. So for the next years it is expected a growth in recreational craft market, specially in Catamaran industry, much due the economic development in big emerging economies and the booming of Tourism. Exports are expected to continue to increase, as the biggest impact in the increase of the demand comes from the countries outside of Europe like the US, India, China or Japan.
4. Fountaine Pajot
Fountaine Pajot was founded in 1976, and it is a manufacturer of sailing and powered catamarans, recognized internationally as one of the main players in the catamaran industry. Besides production of boats, Fountaine Pajot offers as well maintenance and repair services after the sales of their catamarans.
The company has their headquarters in Aigrefeuille-d'Aunis, in the Western part of France. It is publicly traded at the French stock exchange, Euronext Paris. Their ownership structure is composed by around 20% of institutions, other 21% of general public, 5% of private equity firms and around 54% of a private company, and major shareholder, La Compagnie du Catamaran. Fountaine Pajot is considered subsidiary of this group which detains several companies related to the boat industry.
55% 20%
20%5%
Shareholders
La Compagnie du Catamaran Instituitions General Public Private Equity
The firm operates in 2 different production sites, two different shipyards, one located together with the headquarters, with 13000m², and the other in the city of La Rochelle, with 8000m². Each shipyard is specialized in different boat ranges. The Aigrefeuille-d'Aunis shipyard team takes care of the design and manufacture of the mid-size catamarans, while the La Rochelle site oversees the catamarans with over 15 meter of hull length, their Flagship range of catamarans. Divided by the two shipyards, Fountaine Pajot employees around 600 people.
The company is also present commercially in more than 40 countries worldwide through their network of dealers and local salespeople. They are present in countries like Australia, US and China. Around 87% of their net sales come from exports, so their network of dealers outside of France is of an extreme importance. It exports to more than 40 countries, still 28,4% of their exports are for Europe, 23,5% to the US, 17,1% for the Caribbean, 13,1% for the French market and the rest 18% for the rest of the world.
In May Fountaine Pajot acquired a major stake of a French monohull yacht manufacturer, Dufour Yachts, for €22,6 million . This acquisition allows Fountaine Pajot to enter in a new business area, the monohull yacht sector. Fountaine Pajot seems to be still looking for some stability in the business, as it keeps growing at increasing rates, leaving good perspectives for the future. Revenues grew from 2017 to 2018 around 72%, and comparing to 2014, around 172%, and it is believed that it will still continue to grow, much due the
28,40%
23,50% 17,10%
13,10% 18%
Revenues Per Location
Europe US Caribbean France Rest of the World
Figure 5 – Fountaine Pajot revenues geography Source : FP annual report
acquisition of a major stake of Dufour Yacht (Appendix 1.). Around 97% of the revenues comes from the sale of catamarans, while 2% from repair and maintenance services and 1% merchandising. 87% of the revenues come from exportation, while the other 13% coming from France. With the acquisition of Dufour Yacht it is expected the share of revenues coming from France increases, due they strong network of sales in France. The EBITDA adjusted margin grew too, from 6% in 2014 to 10% in 2018 much due the increasing efficiency in the production processes and the program of recruitment of new specialized workforce, Ocean 40.
4.2) Business areas
Fountaine Pajot is actually present in these business areas :
- Sailing Catamarans - Powered Catamarans - Monohull Yachts
- Repair and Maintenance services
Their main activities are the production of sailing and powered Catamarans, but with the recent acquisition of Dufour Yachts, Fountaine Pajot is entering in the very valuable market of the monohull yachts, which will represent in the future a good source of revenue. Monohull Yachts : Since Dufour Yacht got acquired by Fountaine Pajot until the end of the fiscal year, they had 4 months of activity. Taking in account that activity, they made around €31 million , representing already 23% of the total turnover. 58 % of this business volume was made in Europe and 26% in France.
4.3 Strategy: Fountaine Pajot strategy is set to keep growing and to solidify their position in the market, through their long-term development plan. This long-term plan involves reaching the market leader position as number one firm in producing Catamarans, detained
by Lagoon, and at the same time expanding their presence to new business areas such as monohull market. To maintain their number two position in the Catamaran market, the company is trying to keep increasing they yearly sales, at increasing rates. To accomplish that they are trying to improve their production process, by making it more efficient and faster, so that they can deliver more boats to the clients in less time. The program Ocean 40 started this year, and consists in hiring around 150 new highly skilled employees to the shipyards, in order to increase firm production capacity and fasten the process. In the first semester of this fiscal year, 70 new people were hired which made the production process to improve around 33%, making this internal development program a success. The company also keeps developing new models with exciting designs and the best technology, keep attracting new buyers. Models such as the Astrea 42, considered the “Multihull of the Year”, on the sail brand, and the MY 40 on the motor powered brand.
The acquisition of Dufour Yacht in May will allow Fountaine Pajot to enter a new market, as Dufour is already a very well established firm in the monohull market. This merger will allow Fountaine Pajot to increase their workforce by 500 new highly skilled employees, increase economies of scale and production capacity and also purchasing power over the suppliers. Another advantage of the merge is that Dufour Yacht sales are located mostly in Europe, on the other way Fountaine Pajot majority sales are outside of Europe, so both firm commercial network of dealers complement each other. Also the fact that both firms are geographically located in the city of La Rochelle allows the process and dynamic of the merge to be easier. This acquisition seems to be a very good move by Fountaine Pajot, gaining already considerable market share in a market where was not even present, being Dufour third biggest European sailing yacht producer. This merge will make the Groupe Fountaine Pajot the second biggest in Europe regarding the sailing and yacht market, with around 1100 employees and €140 million turnover per year, just behind the French group
Bénétau. In order to understand what are the strengths and advantages of the company that can make the firm to get chance to grab some opportunities that arise in the market, but also what are weaknesses and the things to improve that can hurt the company and decrease market share, a SWOT analysis was done :
Strengths : - solid financials that can permit the company to do new investments and enter
in new business areas easily
- Pioneer in the manufacture of sailing catamarans - Big network of dealers around the world
- Constant innovation – launching new models every year
- Standardized production allowing to reduce costs and manufacture faster - Their boats are luxury products, having higher margins than the market
- Attractive design which identifies the brand, making it recognizable around the world
Weaknesses : - Due 87% of their net sales are exports and 70% outside Europe, they should
consider to have a shipyard outside of France, in the Caribbean for example, allowing to serve the American and Caribbean market faster and easier.
- Exposed to competition with lower production and labour costs, that deliver cheaper catamarans and can steal sales
- Lower personalization of their items, when able to personalize according to the clients taste turns out to be very expensive relative to the competitors
- High delivery times
Opportunities : - Potential to grow the company with the access to new market, the
monohull yacht market
- They have the chance to diversify their type of boats, attracting different segment of people, diversifying their revenues
- Eco sailing Catamarans
- Get involved in the Charter market which is growing
Threats :
- Shifting demand for less ownership and more renting
- Industry dependent of tourism and global economic situation
- Very specific market can be damaged by a company that enters and is already recognized in other markets
- Tight and strong competition of Lagoon and Nautitech
- Competition of shipyards who do the production process close to the client, according to their choices and taste
5. Valuation
5.1 – Discounted Cash Flow method
For the Discounted Cash Flow methodology we use the same WACC for every period we are considering on the lifetime of the company. Still there is a risk in this option, as WACC assumes that the capital structure is constant throughout the time, which makes sense for mature companies, with stability in the business. Fountaine Pajot seems to be experiencing an intense growing period, with revenues and cash flows increasing at great rates. Also with the recent merger with Dufour Yachts, the capital structure changed and may change in the future. Still we expect to complement this analysis with the relative valuation, to have more robust results.
CAPM
The CAPM model was used to find the return on equity (re). It is assumed that the risk free rate (rf) is 0.04% and comes from the 5 year maturity French Government Bonds, 5 years maturity because it is the lifetime of the project before the perpetuity. Also
assumptions that the adjusted levered beta, taken from Bloomberg, is 1.12, and the market risk premium is 11.25%, based on the average annual return of the MSCI World index. The calculations lead to a return of equity of 12.64%.
WACC
As said before, the WACC will be the discount rate of the free cash flows, and it takes in account the capital structure of the company, the debt and equity weights. The equity weight is around 29% and the debt 71%, these weights are from last year annual report. The big % percentage debt probably has to due with the recent acquisition of Dufour Yachts. The cost of debt is the sum of the Euribor Tax plus the swap credit default of the company, being 5%. The tax rate is assumed to be 28%, as it will be the tax rate used for every company in France, starting in 2020. With every variable calculated, the WACC is around 6%.
Free Cash Flow
Cash-flows are calculated from 2018 until 2024 and then are discounted as a perpetuity. For a more realistic prediction different growth rates were defined for the different years. On the first year it is assumed that the growth rate (g) is 30%, which is the average growth of the company earnings on the last 4 years (Appendix.1). Until the year 4 the growth rate for the subsequent periods will be half of the growth rate of the previous period; for year 2 (g`) 15%, for year 3 (g``) 7,5% and year 4 (g```) 3,75%. This was defined to be more realistic, as the trend is that growth rate of the cash flows will diminish and then stabilize. The growth rate after year 5 is the expected growth of the advanced economies in the next years (IMF), (g````) is 2%, as the major income source comes from exports.It was assumed as well for matters of calculation that in the first 2 years there is a reduction of 10% in the cash flows due expenses of integration and restructuring of the merger between both firms. Calculating the free cash flows, the (g)
rate and (g`), the perpetuity with (g``) rate, and discounting both with the WACC, we reach the discounted cash flows and the terminal value. The sum between these two will be the enterprise value. Applying the formula : Equity = Enterprise value – Debt and
Debt Equivalents – Non Controlling Interest – Preferred Stock + Cash and Cash Equivalents, we reach the equity value. By dividing the Total Equity per the number of
shares we reach the value per share given the DCF method, which is around €258.
5.2 – Relative Valuation
In order to complement the DCF analysis above and also compare with industry and competitors, some specific firms were selected for matters of relative valuation. As the industry is dominated by just some key players, few are the companies listed on stock exchanges, so 2 companies were selected, both quoted as well in the French stock exchange and direct competitors of Fountaine Pajot, being key players in the catamaran industry and also representative of it. The companies selected to compare with are the Group Bénéteau and the Catana Group. Group Bénéteau detains the company Lagoon, the number one in the catamaran market.
P/E ratio – Fountaine Pajot P/E Ratio is the largest when looking for the ratios of the
direct competitors. This might be justified by the fact that the market is expecting big earnings growths in the future for Fountaine Pajot when benchmarking with the competition and that expectation is potentially already reflected in the price. This seems reasonable as Fountaine Pajot has presented in the last years a great growth and with the
Company P/E P/E (estimate) EV/EBITDA EPS P/S P/B
Fountaine Pajot 16,74 10,46 6,06 6,2 1,5 4,5
Bénéteau 13,97 6,61 0,77 0,7 1,52
Catana 14,73 17,14 10,64 0,12 1,07 3,2
Figure 6 – FP Relative Valuation Source : Bloomberg
acquisition of Dufour Yachts and the increasing in tourism and demand for catamarans, the trend is to keep growing in the next years, until it stabilizes. If we compare with Bloomberg estimate P/E, which is the ratio between the price now and the expected earnings for the future, the ratios are lower, which supports the argument that earnings are expected to grow strongly.
Price/Sales Ratio – Fountaine Pajot Price/Sales Ratio is larger than both competitors
ratios, still every value is pretty similar, meaning that this ratio value is common in this industry. A bigger PSR can suggest that the market is expecting a growth in the next years sales for the company, which again makes sense due the increasing demand for the catamarans, specially from the emerging markets. Fountaine Pajot PSR is above Bénéteau, probably because Bénéteau is already a very mature company with more stability and bigger market cap, while Fountaine Pajot seems to be now in a growth phase.
Price/Book ratio – Bénéteau Price/Book ratio is smaller than both Catana and
Fountaine Pajot. Meaning that the market may perceive that FP stocks may be overvalued, at least relative to the competition. Still this value can be distorted due the acquisition of Dufour Yachts, which accounts for the fundamentals of the company and can mean a change in the capital structure in the future. FP has the biggest ratio, this may be explained by the expectations of growth in the earnings compared to Catana, a quite similar company. As Bénéteau is already a more mature company there are no much expectations of growth, and so the market value is much more close to the book value than the other two companies.
Earnings per share – Fountaine Pajot earnings per share are bigger than the
competitors, meaning that this company is at the moment more profitable than the competitors from the industry.
EV/EBITDA – Comparing the 3 companies, seems that Fountaine Pajot has the lowest
ratio of the 3 firms. Bénéteau and Fountaine Pajot have a very similar ratio, but Catana that is more similar to Fountaine Pajot, due exclusivity of production of catamarans, has the ratio 4 points higher. This suggests that Fountaine Pajot EV may be slightly undervalued when compared to the industry, specially with Catana, a direct competitor. Also makes sense since according to the DCF methodology the FP stock should be valued €258 and not €87 . This ratio is not influenced by changes in the capital structure.
6. -Investment Recommendation
On the last 10 years Fountaine Pajot stock had an average value of €31.47, reaching the minimum value of €4,72 19/12/2011 after the sovereign debt crisis and maximum value of €148 on the 28/06/2018 this year, probably after the announcement of the buyout of Dufour Yachts and with the great semesterly results it had, announced in June. At the moment the share is being negotiated at €87.
2000 2500 3000 3500 4000 4500 5000 5500 6000 6500 0 20 40 60 80 100 120 140 2007 2008 2009 2010 2011 2012 2013 2014 2015 2016 2017 2018
Fountaine Pajot Stock Price (left axis) CAC40 (right axis)
Figure 7 – Fountaine Pajot vs CAC40 Source : Bloomberg
Comparing the evolution of the stock with French index CAC 40, we can see that FP stock is positively correlated with the index, with a 0,7 correlation coefficient.
Calculated by the DCF methodology the fair value for the share price is €258, which suggests that the market is potentially undervaluing the stock, being the market price €87. The undervaluation might be explained by the uncertainty of the market regarding the company, as it only started to have big growth in cash flows in 2014, 4 years ago. Also it is a small cap company, that may be more affected by any shock. The company operates as well in very specific market unknown for a majority of investors. All this uncertainty may be perceived as risk, partly limiting the upside for the stock price.
On the other hand, through the relative valuation, the results are not straightforward. While the Price to Earnings estimate ratio also suggest that the stock might be undervalued, other multiples signal that the stock can be overvalued. This might be explained by the fact that the stock price already reflects analysts’ expectations about strong earnings growth, leading the P/E ratio to be significantly larger than the P/E(estimate ratio). Conversely, other relative measures that do not link valuation with expectations, lead to higher multiples than the industry’s multiple, giving a “false sense” of overvaluation (Appendix 3.). According to both methodologies it is suggested that investors buy the stock at the current market price, in order to get exposure to a potential upside, that can be as much as 196% in the future, according to the DCF method and therefore subject to validation of all the assumptions. As the French economy is expected to increase by 1,6% in the next years (Appendix.6), Fountaine Pajot should also benefit from its positive correlation with CAC 40.
References :
Damodaran, A. 2012. Investment valuation: Tools and techniques for determining the value of any asset (3rd ed.) New Jersey: Wiley
Koller T., Goedhart M., Wessels, D., McKinsey & Company. 2005. Valuation: Measuring and managing the value of companies (4th ed.) New Jersey: Wiley.
Modigliani, F. & Miller, M. 1958. The cost of capital, corporation finance and the theory
of investment. The American Economic Review, 48: 261-297
ECSIP Consortium. 2015 Study on the competitiveness of the recreational boating sector
Fountaine Pajot. semesterly and annual reports
Database Bloomberg Yahoo Finance Eurostat Website https://www.gminsights.com/industry-analysis/catamarans-market http://www.nmma.org/assets/cabinets/Cabinet442/Pleasure%20Boat%20Resource%20Gui de%202018_Final2.pdf https://www.cen.eu/news/brief-news/Pages/NEWS-2018-024.aspx https://www.statista.com/topics/1138/recreational-boating/ http://www.europeanboatingindustry.eu/facts-and-figures https://ec.europa.eu/growth/sectors/maritime/recreational-crafts_en
Appendix :
Financial Indicators 2014 2015 2016 2017 2018
Revenues 50213611 62631414 71305178 79768930 136810000
% Growth Rate Revenue 23% 25% 14% 12% 72%
EBITDA 3 001 626 12 409 419 14 299 923 13 932 275 14 248 000
Margin EBITDA 6% 20% 20% 17% 10%
Appendix 1 : Financial Indicators Last 5 years Source : Fountaine Pajot Annual Reports
Appendix 3 : Excel with Multiples method
Appendix 4 : Facts and Figures Europe boating industry Source : European Boating Industry
Appendix 5 : IMF Data Mapper GDP growth in 2019 Source : IMF
Appendix 6 : IMF graph with GDP growth prediction Source : IMF