Alternative Methods of Reference Evapotranspiration
for Brazilian Climate Types
Bruno César Gurski
1, Daniela Jerszurki
2, Jorge Luiz Moretti de Souza
1 1Programa de Pós Graduação em Ciência do Solo, Universidade Federal do Paraná,
Curitiba, PR, Brazil.
2
Wyler Department for Dryland Agriculture, Jacob Blaustein Institute for Desert Research,
Ben-Gurion University of Negev, Beersheba, Israel.
Received in October 18, 2016 – Accepted in May 13, 2018
Abstract
The choice of consistent alternative methods is essential for the improvement of reference evapotranspiration (ETo) esti-mation for different climatic regions. Due to a critical gap in knowledge concerning the most adequate alternativeETo methods for the climatic conditions in Paraná, Brazil, this study aimed to test and to evaluate the main estimation alterna-tive methods (Thornthwaite -EToTH; Camargo -EToC; Hargreaves and Samani -EToHS; Linacre -EToL; and, Budyko
-EToB) for the subtropical (Cfb) and semi-arid (Bsh) climate types in Brazil. We compared our results with standard
EToPM(Penman-Monteith) estimated between 1970 and 2015, using the minimum and maximum air temperature (T),
sunshine hours (n), relative humidity (RH) and wind speed (U2). Least square regression analysis ofEToestimated by
al-ternative methods vsEToPMwere used to calibrate the methods for each analyzed climate type. The performance of
cali-brated and noncalicali-brated methods was evaluated by index of agreement“d”and performance“c”, root mean square error (RMSE) and mean error (ME). Our results showed the importance of calibration process of alternative methods for the improvement ofEToestimations in Brazil. The Hargreaves and Samani and Linacre calibrated methods showed better performance in the subtropical and semi-arid climates, respectively. Also, the Linacre and Budyko calibrated methods were particularly robust in subtropical and semi-arid climates, outlining the importance of continuous measure-ments ofTused in theEToLandEToBmodeling effort. The results presented here showed the importance to calibrate the
alternative methods onEToestimations and outlined the need for improvement and proposition of newETomethods based on a limited number of climatic variables commonly available in subtropical and semi-arid climates in Brazil.
Keywords:modeling, Penman Monteith ASCE, semi-arid, subtropical zones.
Métodos Alternativos de Evapotranspiração de Referência
para Tipos Climáticos Brasileiros
Resumo
A escolha de métodos alternativos consistentes é essencial para a melhoria das estimativas da evapotranspiração de referência (ETo) em diferentes zonas climáticas. Devido ao desconhecimento dos métodos alternativos mais adequados para as condições climáticas paranaenses, teve-se por objetivo no presente trabalho testar e avaliar os principais métodos alternativos de estimativa daETo(Thornthwaite -EToTH; Camargo -EToC; Hargreaves e Samani -EToHS; Linacre
-EToL; and, Budyko -EToB) para os tipos climáticos subtropical (Cfb) e semi-árido (Bsh) no Brasil. As estimativas
alternativas foram comparadas com aEToestimada como o método de Penman-Monteith ASCE (EToPM) entre 1970 e
2015, a partir da temperatura máxima e mínima do ar (T), horas de brilho solar (n), umidade relativa média (UR) e velocidade do vento a dois metros de altura (U2). Análises de regressão linear simples entre aEToestimada com os
métodos alternativos vsEToPMpara cada tipo climático analisado, foram utilizadas para a calibração dos métodos. O
desempenho dos métodos calibrados e não calibrados foi obtido a partir do índice “d”de concordância, “c”de desempenho, raiz quadrada do erro médio (RMSE) e erro médio (EM). Os resultados demonstraram a importância da calibração dos métodos alternativos para a melhoria das estimativas nas condições climáticas brasileiras. Os melhores
Revista Brasileira de Meteorologia,v. 33, n. 3, 567-578, 2018 rbmet.org.br
DOI: http://dx.doi.org/10.1590/0102-7786333015
Article
desempenhos foram observados para os métodos calibrados Hargreaves and Samani e Linacre para os tipos climáticos subtropical e semi-árido, respectivamente. Além disso, os métodos calibrados Linacre e Budyko mostraram-se parti-cularmente robustos nos tipos climáticos subtropical e semi-árido, respectivamente, destacando a importância de medidas contínuas da variávelT, utilizada na modelagem deEToLeEToB. Os resultados obtidos indicaram a necessidade
da melhoria das estimativas alternativas daETo, a partir da utilização de pequeno conjunto de variáveis disponíveis para os tipos climáticos subtropical e semi-árido no Brasil.
Palavras-chave:modelagem, Penman Monteith ASCE, semi-árido, zonas subtropicais.
1. Introduction
The reference evapotranspiration (ETo) has funda-mental role in the study and determination of water rela-tions in the activities of rural engineering. Besides that, it is one of the most important hydrological variables for crop evapotranspiration, estimation and interpretation of agri-cultural water balances and irrigation management (Blaney and Criddle, 1950; Xu and Singh, 2005). TheETocan be measured directly from lysimeters or evapotranspirometers (Doorenbos and Pruitt, 1977) or estimated from theoretical methods based on climate variables such as temperature (Thorthwaite, 1948; Doorenbos and Pruitt, 1977) and solar radiation (Hargreaves and Samani, 1985). Due to the dis-semination of weather stations and the high cost of direct measurement, the estimatedETohas been used with satis-factory performance around the world (Pandey et al., 2016). Traditionally, the combined method of Penman-Monteith parameterized by the Food and Agriculture Orga-nization of the United Nations - FAO (Allenet al., 1998) and the American Society of Civil Engineers - ASCE (ASCE-EWRI, 2005) is recognized as a standard method to estimateETo(Chauhan and Shrivastava, 2009). However, all the weather data needed to solve the method are often in-complete or not available in many of the Brazilian regions, which limits their use (Souzaet al., 2014; Alencaret al., 2015). Even considering the different climate database of meteorological data around world, as World Climate Data-base (Hijmanset al., 2005), the complete set of data needed to estimateEToby Penman-Monteith method is not avail-able, because key variables such as wind speed, solar radia-tion, daily insolation and relative humidity are still missing or not consistent.
Therefore, alternative methods developed to estimate the reference evapotranspiration, with a small number of climate variables of easy measurement, are promising for the alternative estimation of ETo(Chauhan and Shrivas-tava, 2009). Over the last 50 years, many alternative models have been developed (Penman 1948; Thornthwaite 1948; Campbell 1971; Budyko 1974; Linacre 1977; Hargreaves
and Samani, 1985), but the literature only reports a compar-ative performance to the Penman-Monteith standard method (Borges and Mediondo, 2007; Oliveiraet al., 2008; Trajkovic and Kolakovic, 2009), with few studies analyz-ing the adjustment ofETomethods under different climatic types (Todorovicet al., 2013.). Therefore, given the exist-ing climate variability in Brazil, such studies are important, because they allow to identify trends and limitations of the alternative methods and to choose the best suited method for each region.
Accordingly, here we test, adjust and evaluate the main alternative methods of reference evapotranspiration for different climate types in Brazil.
2. Material and Methods
Analyzes were carried out in a set of 45 years of daily historical data (January 1970 to December 2015) of maxi-mum, minimum and average air temperature (°C), relative humidity (%), daily sunshine hours (MJ m-2d-1) and wind speed at ten meters height (m s-1), available by the National Institute of Meteorology (INMET, 2016) from two auto-matic weather stations located in the cities of Petrolina and Curitiba (Table 1), under the climate types Bsh and Cfb, re-spectively. According to Koppen (1936), the Bsh climate is characterized as dry semi-arid, occurring in low latitude and altitude locations with high average annual tempera-tures above 26 °C and average precipitation of 522.3 mm year-1. The Cfb climate is characterized as a subtropical without dry season, with temperate summers and average precipitation of 1500 mm year-1(Alvareset al., 2013).
Daily reference evapotranspiration was estimated by Penman-Monteith method, parameterized by American So-ciety of Civil Engineers (ASCE) (ASCE EWRI, 2005).
ETo
R G C
T u e e
PM
n psy n
s a
p
=
× × - + ×
+ × ×
-×
0 408
273 2
. ( )
( ) ( )
D
D g
g sy× +(1 Cd×u2)
(1)
whereEToPM- reference evapotranspiration (mm d-1);D -slope of the saturated water-vapor-pressure curve
568 Gurskiet al.
Table 1- Climatic classification, location and assessed weather stations.
Climatic classification State Station Latitude (degrees) Longitude (degrees) Altitude (m)
Bsh Pernambuco Petrolina -9.38 -40.48 370.46
(kPa °C-1);
Rn- net radiation at the crop surface (MJ m-2 d-1);G- soil heat flux (MJ m-2d-1);gpsy- psychrometric con-stant (kPa °C-1);T- daily average air temperature (°C);U2 -wind speed at 2 m height (m s-1);es- saturation vapor pres-sure (kPa);ea- actual vapor pressure (kPa);Cn- constant re-lated to the reference type and calculation time step, considered equal to 900 for grass (dimensionless);Cd- con-stant related to the reference type and calculation time step, considered equal to 0.34 for grass (dimensionless).
Daily vapor pressure deficit (es-ea) was estimated by difference between saturated and actual vapor pressure. Saturated vapor pressure was calculated using air tempera-ture based on the Tetens formula. Actual vapor pressure was obtained by saturated vapor pressure multiplied by fractional humidity. Daily net radiation (Rn) was estimated by the difference between net longwave and shortwave ra-diation. The net longwave radiation (Rnl) was obtained by relative shortwave radiation (Rs/Rso), air temperature and actual vapor pressure. The net shortwave radiation (Rns) was obtained by solar radiation (Rs), which was estimated by relation between extraterrestrial radiation (Ra) and rela-tive sunshine duration (n/N) (Pereira, 2015). The soil heat flux (G) was calculated using air temperature (Pereiraet al., 1997). The wind speed measurements were transformed to wind speed at 2 m height by the wind profile relationship (Allenet al., 1998).
AlternativeETomethods consisted of the following empirical models: Thornthwaite (1948), Camargo (1971), Budyko (1974), Linacre (1977) and Hargreaves and Sa-mani (1985).
a) Thornthwaite (1948):
Thornthwaite (1948) method uses daily average air temperature (T), considering a month of 30 days and 12 hours of photoperiod:
ETo N T
I T C
THi i
= × × ×æ × è ç ö ø ÷ > 12 1 30 16 10 0
, for: º (2)
whereEToTHi- reference evapotranspiration by Thornth-waite (1948) method for the i-th day (mm day-1);
Ni -photoperiod in i-th day (h);T- daily average air tempera-ture (°C).
a I I
I
= × × - × ×
+ × × +
-
-675 10 771 10 17912 10 049239
7 3 5 2
2
. .
. .
(3)
wherea- cubic function of the heat index (I) of the region (dimensionless);I- heat index in the region (dimension-less).
I Ta Ta
i
= × >
=
å
( .02 )1 514. , 0 112
for (4)
whereTa- average normal temperature of the m-th month of the year (°C).
b) Camargo (1971):
EToCi =Qo F Ti× × (5)
where EToCi - reference evapotranspiration by Camargo (1971) method for the i-th day (mm day-1);
Qoi- extrater-restrial radiation of the i-th day, calculated as evaporation (mm day-1);
F- adjustment factor varying according to the site of the annual average temperature;T- daily average air temperature (°C).
The extraterrestrial radiation of the i-th day in equiva-lent evaporation (Qoi - mm day-1) was transformed from
the latent heat of evaporation (l= 2.45 MJ kg-1):
Qo R
i
a
(mm. day-1) = .
245 (6)
whereQoI(mm day-1) - extraterrestrial radiation of the i-th day
in equivalent of evaporation (mm day-1);
Ra- extraterres-trial radiation of the i-th day (MJ m-2day-1).
c) Hargreaves and Samani (1985):
EToHSi =00023×Qoi× T+178 × TMAXi -TMINi
0 5
. ( . ) ( ). (7)
whereEToHSi- reference evapotranspiration by Hargreaves and Samani (1985) method for the i-th day (mm day-1);
Qoi - extraterrestrial radiation of the i-th day, calculated as evaporation (mm day-1);
T- daily average air temperature (°C);TMAXi- maximum air temperature in the i-th day (°C); TMINi- minimum air temperature in the i-th day (°C).
The transformation of the extraterrestrial radiation of the i-th day in equivalent of evaporation (Qoi- mm day-1) was from the latent heat of evaporation (l= 2.45 MJ kg-1), as proposed by Camargo (1971).
d) Linacre (1977):
ETo T z T Td T Li i = × + - + × -700 0006 100 15 80 . ( ) j (8)
where EToLi - reference evapotranspiration by Linacre method for the i-th day (mm dia-1); T- daily average air
temperature (°C);z- local altitude (m);f- site latitude (de-grees);Tdi- dew point temperature in the i-th day (°C).
e) Budyko (1974):
EToBi =020. ×T (9)
where EToBi - reference evapotranspiration by Budyko (1985) method for the i-th day (mm day-1);T- daily average air temperature in the i-th day (°C).
The daily values of ETo estimated by alternative methods were adjusted from linear regression analyzes in a monthly and annual basis, between 01/01/1970 and 12/31/2005 (35 years). The linear regression analysis to verify the performance and association betweenEToPMand
calibratedEToalternativewere held for the last ten years of data
series (01/01/2006 to 12/31/2015). The calibratedETo alterna-tivevalues were obtained using the adjustment coefficients
“a” and “b” obtained from the relation EToalternative and
EToPM(1970 to 2005).
EToalternative i = + ×a b EToPMi (10)
where:EToalternative iis the reference evapotranspiration esti-mated by calibrated alternative methods at each i-day (mm d-1);
EToPMi - reference evapotranspiration by Pen-man-Monteith method in the i-th day (mm day-1);
ais the linear coefficient (mm d-1);
b is the angular coefficient (dimensionless).
Daily reference evapotranspiration obtained with al-ternative methods and standard Penman-Monteith method were compared by linear regression analysis usingR2as an index of precision, agreement index“d”(Willmottet al., 1985) as an index of accuracy and confidence index“c” (Camargo and Sentelhas, 1997) as a general index to evalu-ate both precision and accuracy. The agreement index is a measure of the effectiveness with which the alternative method estimates the Penman-Monteith reference evapo-transpiration, considering the dispersion of the relative data to the 1:1 line.
The interpretation criteria of“c”performance, was clas-sified by great (“c”> 0.85); very good (0.75 <“c”£0.85); good (0.65 <“c”£0.75); average (0.60 <“c”£0.65); tolerable (0.50 <“c”£0.60); bad (0.40 <“c”£0.50); and, very bad (“c”£0.40).
For further comparison, root mean squared error (RMSE) and mean error (ME) were used to evaluate the ref-erence evapotranspiration estimated by alternative meth-ods:
(
)
d
E O
E O O O
i i i
n
i i i i i n = -- + -é ë ê ê ê ê ù û ú ú ú ú = =
å
å
1 2 1 2 1 ( ) (9)c= ×R d (10)
RMSE
n i Ei Oi n = × -=
å
1 2 1( ) (11)
ME E O
O
i i i
= - ×100 (12)
whered - agreement index of Willmottet al. (1985) (di-mensionless);Ei-EToestimated by alternative methods in the i-th day (mm day-1);
Oi- EToestimated by Penman-Monteith method in the i-th day (mm day-1);
Oi- mean of the ETo estimated by Penman-Monteith method (mm day-1); n - number of observations (dimensionless);
R- cor-relation coefficient (dimensionless); RMSE - root mean square error (mm day-1);
ME- mean error (%).
3. Results and Discussion
Contrasting performances were observed between methods for all climate types (Tables 2 and 3). The calibra-tion process resulted in improved estimacalibra-tions in the annual
period for some methods, showing better performances in the monthly period.
Comparatively, several authors have been demon-strating the influence of climate type on the estimatedETo, as well as on the performance of alternative methods (Le-mos Filhoet al., 2010; Silvaet al., 2011). In this sense, the results showed that the evaluation of performance of alter-native methods estimatingETofor different climate types is essential when climatic data required forEToPMare un-available or unreliable.
TheEToHSmethod showed the best performance and lower estimation errors for the climate Cfb in the monthly and annual periods. The EToL showed similar trends to EToHSin a monthly period (Table 2). Similar results were obtained by Syperrecket al.(2008), when theEToHSwas a better suited method for subtropical climate (R= 0.86,d= 0.85,c= 0.73).
Camargo and Sentelhas (1997), comparing 20 alter-native methods with ET obtained by evapotranspirometers in different Brazilian climate types, observed better esti-mates forEToCandEToTHfor the subtropical and dry tropi-cal climate types, respectively. TheEToHS,EToCandEToTH use solar radiation or daily insolation as input variables of the model, which can improve the estimative of ETo, mainly under warm and dry climates (Gardiman et al., 2012).
The use of solar radiation in alternative methods to estimateETois well-recognized in the literature, providing good results in the analyzed regions (Irmaket al., 2006). According to Hupet and Vanclooster (2001), solar radiation has great influence onEToPMin extremely cold and wet mates, due to lower magnitude and influence of other cli-matic variables. According to Camargo and Sentelhas (1997), the easiest use ofEToCandEToTHstands out among other alternative methods. However,EToTHmethod pres-ents particularities in the estimative, as the need for the nor-mal monthly average temperature of the year, which is considered a difficult information to access because it is not provided by weather stations, which makes it even more difficult spreading the method.
According to Souzaet al.(2014), the use of solar radi-ation in alternative methods results in consistent estimates ofETofor both warm and dry as to cold and wet climates. For these authors,EToHStends to perform better estima-tions in warm climates with high average temperatures throughout the year, since the method was based on the av-erage temperature and maximum temperature of the day. Opposite trend was observed in this study, with the worst performance observed forEToHSin Bsh climate (Table 3). TheEToLmethod is a simplification of the Penman (1948) model, which uses air temperature functions, such as the difference between the average temperature and dew point temperature, being proposed in Africa and South America (Souzaet al., 2014). In this sense, the best perfor-mance of the method occurred for Bsh, given the similarity
Alternative
Methods
of
Reference
Evapotranspiration
for
Brazilian
Climate
Types
571
Table 2- Coefficient of determination (R2), correlation (R), root mean square error (RMSE), mean error (ME), indexes“d”and“c”and performance of alternative methods, calibrated (C) or not (NC), compared to
standard (EToPM) for climate type “Cfb”, in monthly and annual periods, between 1970 and 2005.
Month R2 R “d” “c” RMSE(mm day-1) ME(%) a(mm day-1) b(dimensionless)
NC C NC C NC C NC C NC C NC C NC C NC C
Thornthwaite (1948)
Annual 0.55 0.55 0.74 0.74 0.81 0.84 0.60 0.62 0.90 0.77 -14.60 9.99 0.79 1.34 0.87 0.55 January 0.20 0.32 0.45 0.56 0.79 0.88 0.35 0.50 0.93 0.90 -8.60 15.17 1.48 3.38 0.70 0.20 February 0.18 0.41 0.42 0.64 0.76 0.87 0.32 0.56 0.83 0.86 -5.32 12.87 1.22 3.09 0.73 0.24 March 0.21 0.35 0.46 0.59 0.64 0.73 0.29 0.43 0.71 0.82 -6.20 15.21 1.32 2.84 0.63 0.19 April 0.13 0.14 0.36 0.38 0.76 0.62 0.27 0.23 0.69 0.59 -7.23 15.13 1.63 2.41 0.37 0.10 May 0.10 0.07 0.31 0.26 0.93 0.94 0.29 0.24 0.62 0.52 -10.44 17.96 1.33 1.87 0.30 0.06 June 0.07 0.45 0.26 0.67 0.96 0.97 0.25 0.64 0.57 0.47 -9.38 13.68 1.23 1.62 0.23 0.04 July 0.23 0.22 0.48 0.47 0.94 0.93 0.45 0.43 0.67 0.53 -19.82 24.52 1.01 1.74 0.53 0.20 August 0.32 0.39 0.57 0.63 0.84 0.72 0.48 0.45 0.90 0.60 -27.71 16.05 1.18 1.96 0.66 0.29 September 0.29 0.33 0.54 0.57 0.72 0.61 0.39 0.35 1.01 0.80 -25.88 17.44 1.39 2.31 0.63 0.25 October 0.20 0.23 0.45 0.48 0.50 0.69 0.22 0.33 1.10 0.89 -21.81 16.29 1.77 2.88 0.56 0.17 November 0.17 0.13 0.41 0.36 0.50 0.78 0.21 0.28 1.29 1.03 -21.75 21.55 2.11 3.53 0.56 0.13 December 0.14 0.18 0.38 0.43 0.69 0.87 0.26 0.37 1.10 0.97 -13.83 15.80 2.05 3.63 0.57 0.15
Camargo (1971)
Annual 0.63 0.58 0.79 0.76 0.86 0.84 0.68 0.64 0.76 0.81 -8.96 -7.47 0.56 0.68 0.91 0.65 January 0.19 0.30 0.44 0.55 0.86 0.88 0.38 0.48 0.81 0.84 0.21 8.46 -0.13 3.09 1.08 0.22 February 0.17 0.42 0.42 0.65 0.81 0.86 0.34 0.56 0.76 0.81 1.02 5.18 -0.26 2.73 1.11 0.26 March 0.21 0.36 0.46 0.60 0.62 0.70 0.28 0.42 0.65 0.77 -2.99 6.17 0.47 2.49 0.91 0.22 April 0.15 0.17 0.39 0.41 0.79 0.77 0.31 0.32 0.63 0.54 -8.64 7.04 1.13 2.13 0.61 0.14 May 0.11 0.09 0.33 0.30 0.95 0.95 0.31 0.29 0.57 0.48 -13.53 7.45 1.05 1.66 0.50 0.08 June 0.05 0.03 0.23 0.18 0.97 0.97 0.22 0.17 0.53 0.47 -15.71 4.48 1.10 1.49 0.35 0.03 July 0.23 0.22 0.48 0.47 0.94 0.96 0.45 0.45 0.66 0.45 -20.74 4.81 0.60 1.37 0.88 0.22 August 0.31 0.40 0.56 0.63 0.85 0.82 0.47 0.52 0.82 0.59 -22.08 -1.01 0.67 1.54 0.94 0.31 September 0.26 0.26 0.51 0.51 0.73 0.61 0.37 0.31 0.81 0.81 -12.28 3.66 0.74 2.02 0.86 0.23 October 0.20 0.23 0.44 0.48 0.57 0.64 0.25 0.31 0.81 0.85 -5.96 6.94 0.97 2.55 0.77 0.19 November 0.18 0.13 0.42 0.36 0.71 0.77 0.30 0.28 0.97 0.95 -7.81 14.21 1.03 3.25 0.82 0.14 December 0.14 0.18 0.38 0.42 0.83 0.86 0.31 0.36 0.88 0.91 -2.77 10.11 0.82 3.39 0.85 0.16
Hargreaves and Samani (1985)
572
Gurski
et
al.
Month R2 R “d” “c” RMSE(mm day-1) ME(%) a(mm day-1) b(dimensionless)
NC C NC C NC C NC C NC C NC C NC C NC C
June 0.12 0.17 0.35 0.41 0.88 0.97 0.31 0.40 0.73 0.45 44.84 1.34 0.80 1.32 0.35 0.12 July 0.28 0.43 0.53 0.65 0.84 0.97 0.45 0.63 0.75 0.40 41.41 -1.19 0.37 0.99 0.59 0.39 August 0.36 0.46 0.60 0.68 0.62 0.85 0.37 0.57 0.94 0.59 39.22 -5.37 0.49 1.26 0.59 0.39 September 0.46 0.48 0.68 0.69 0.58 0.75 0.40 0.52 1.14 0.71 41.27 -2.00 0.53 1.50 0.58 0.38 October 0.47 0.44 0.69 0.66 0.70 0.78 0.48 0.52 1.30 0.73 40.25 1.88 0.57 1.77 0.60 0.41 November 0.40 0.46 0.63 0.68 0.84 0.87 0.53 0.59 1.32 0.73 34.16 5.11 0.52 2.03 0.67 0.42 December 0.42 0.40 0.65 0.63 0.86 0.90 0.56 0.57 1.37 0.77 34.20 3.11 0.46 2.32 0.68 0.39
Linacre (1977)
Annual 0.46 0.53 0.68 0.73 0.76 0.81 0.52 0.59 0.87 0.81 -3.67 0.84 0.29 1.19 1.02 0.51 January 0.35 0.47 0.59 0.69 0.62 0.92 0.37 0.63 1.12 0.74 -20.13 9.37 1.08 2.37 0.93 0.43 February 0.30 0.53 0.55 0.72 0.64 0.91 0.35 0.66 0.94 0.72 -15.08 6.59 1.04 2.23 0.86 0.42 March 0.28 0.48 0.53 0.70 0.61 0.82 0.32 0.57 0.71 0.68 -9.27 9.06 0.97 2.09 0.78 0.38 April 0.26 0.31 0.51 0.55 0.80 0.81 0.41 0.45 0.54 0.50 3.83 7.61 1.06 1.90 0.57 0.24 May 0.25 0.38 0.50 0.62 0.92 0.97 0.46 0.60 0.57 0.41 19.30 8.63 0.91 1.36 0.43 0.27 June 0.28 0.36 0.53 0.60 0.92 0.98 0.49 0.59 0.64 0.39 31.10 5.47 0.82 1.15 0.36 0.27 July 0.48 0.52 0.69 0.72 0.93 0.98 0.65 0.71 0.60 0.35 21.87 4.47 0.65 0.90 0.53 0.50 August 0.52 0.53 0.72 0.73 0.90 0.88 0.64 0.64 0.63 0.51 3.06 -0.93 0.95 1.04 0.56 0.53 September 0.44 0.51 0.66 0.72 0.82 0.81 0.54 0.58 0.74 0.65 -9.09 3.46 1.16 1.38 0.61 0.47 October 0.29 0.35 0.53 0.59 0.60 0.73 0.32 0.43 0.95 0.78 -17.07 5.84 1.46 2.15 0.65 0.31 November 0.33 0.41 0.58 0.64 0.56 0.86 0.32 0.55 1.21 0.79 -22.81 12.06 1.50 2.49 0.79 0.35 December 0.24 0.42 0.49 0.65 0.54 0.91 0.26 0.59 1.25 0.79 -22.21 10.67 1.70 2.59 0.75 0.38
Budyko (1974)
Annual 0.44 0.46 0.67 0.68 0.71 0.70 0.47 0.47 1.08 1.14 39.81 42.06 -0.58 2.38 0.96 0.44 January 0.19 0.31 0.44 0.56 0.89 0.88 0.39 0.49 0.88 0.84 15.49 8.38 -0.08 3.08 0.93 0.22 February 0.17 0.39 0.41 0.62 0.84 0.86 0.35 0.53 0.99 0.83 24.04 5.38 -0.39 2.82 0.94 0.24 March 0.19 0.31 0.44 0.55 0.67 0.68 0.29 0.37 1.11 0.79 35.51 6.39 0.12 2.59 0.74 0.19 April 0.11 0.13 0.33 0.36 0.21 0.76 0.07 0.27 1.31 0.55 54.18 7.19 1.15 2.23 0.36 0.10 May 0.08 0.05 0.28 0.22 0.26 0.95 0.07 0.21 1.36 0.49 78.17 7.64 1.09 1.71 0.23 0.05 June 0.05 0.03 0.23 0.18 0.39 0.97 0.09 0.17 1.42 0.47 94.34 4.50 1.10 1.49 0.15 0.03 July 0.20 0.18 0.44 0.42 0.52 0.96 0.23 0.41 1.21 0.46 73.62 5.19 0.65 1.43 0.38 0.19 August 0.27 0.34 0.52 0.59 0.56 0.81 0.29 0.47 0.99 0.61 42.60 -0.49 0.64 1.61 0.53 0.28 September 0.26 0.29 0.51 0.54 0.58 0.63 0.30 0.34 0.92 0.79 31.32 3.91 0.65 1.97 0.60 0.25 October 0.18 0.21 0.43 0.46 0.71 0.63 0.30 0.29 0.87 0.86 20.43 7.27 0.92 2.61 0.61 0.17 November 0.17 0.13 0.41 0.36 0.85 0.77 0.35 0.28 0.87 0.95 8.20 14.29 1.05 3.26 0.70 0.14 December 0.14 0.18 0.38 0.42 0.89 0.86 0.34 0.36 0.86 0.91 10.46 10.14 0.80 3.40 0.75 0.16
Alternative
Methods
of
Reference
Evapotranspiration
for
Brazilian
Climate
Types
573
Table 3- Coefficient of determination (R2), correlation (R), root mean square error (RMSE), mean error (ME), indexes“d”and“c”and performance of alternative methods, calibrated (C) or not (NC), compared to
standard (EToPM) for climate type “Bsh”, in monthly and annual periods, between 1970 and 2005.
Month R2 R “d” “c” RMSE(mm day-1) ME(%) a(mm day-1) b(dimensionless)
NC C NC C NC C NC C NC C NC C NC C NC C
Thornthwaite (1948)
Annual 0.45 0.49 0.67 0.70 0.72 0.79 0.48 0.55 1.55 1.28 -17.46 -10.13 2.75 0.14 0.65 0.87 January 0.49 0.32 0.70 0.56 0.79 0.84 0.55 0.48 1.15 1.04 -6.60 9.41 1.31 3.38 0.86 0.20 February 0.57 0.41 0.75 0.64 0.81 0.88 0.61 0.57 1.05 0.90 -8.26 10.98 1.29 3.09 0.87 0.24 March 0.61 0.35 0.78 0.59 0.88 0.84 0.69 0.49 0.90 0.92 -5.53 9.62 1.03 2.84 0.88 0.19 April 0.50 0.14 0.71 0.38 0.88 0.80 0.62 0.30 0.94 0.90 -9.67 11.56 1.21 2.41 0.86 0.10 May 0.44 0.07 0.67 0.26 0.88 0.88 0.59 0.23 1.14 0.71 -15.97 9.02 1.92 1.87 0.73 0.06 June 0.36 0.45 0.60 0.67 0.83 0.88 0.50 0.59 1.56 0.77 -28.78 11.95 2.01 1.62 0.82 0.04 July 0.22 0.22 0.47 0.47 0.75 0.86 0.35 0.40 1.97 0.72 -36.23 10.67 2.78 1.74 0.68 0.20 August 0.24 0.39 0.49 0.63 0.38 0.51 0.19 0.32 2.46 0.76 -39.69 9.76 3.66 1.96 0.62 0.29 September 0.19 0.33 0.43 0.57 0.22 0.87 0.10 0.50 2.30 0.74 -30.95 6.66 4.75 2.31 0.41 0.25 October 0.26 0.23 0.51 0.48 0.56 0.89 0.28 0.42 1.64 0.92 -16.72 7.24 4.08 2.88 0.50 0.17 November 0.44 0.13 0.67 0.36 0.77 0.84 0.52 0.31 1.33 1.20 -8.31 9.78 2.08 3.53 0.77 0.13 December 0.44 0.18 0.66 0.43 0.78 0.84 0.52 0.36 1.17 1.06 -6.61 12.96 2.41 3.63 0.68 0.15
Camargo (1971)
Annual 0.45 0.47 0.67 0.69 0.52 0.56 0.35 0.38 2.18 1.92 -29.60 -27.29 2.75 1.99 0.65 0.35 January 0.49 0.37 0.70 0.61 0.46 0.20 0.33 0.13 1.99 1.49 -21.45 -13.21 1.31 4.67 0.86 0.09 February 0.57 0.70 0.75 0.84 0.50 0.44 0.37 0.37 1.85 1.29 -21.17 -6.71 1.29 4.26 0.87 0.16 March 0.61 0.59 0.78 0.77 0.66 0.54 0.51 0.42 1.65 1.32 -18.72 -10.56 1.03 3.97 0.88 0.15 April 0.50 0.44 0.71 0.66 0.73 0.76 0.52 0.50 1.64 1.08 -23.66 -6.27 1.21 3.84 0.86 0.14 May 0.44 0.30 0.67 0.55 0.78 0.90 0.52 0.49 1.75 0.77 -28.45 -3.38 1.92 3.89 0.73 0.10 June 0.36 0.30 0.60 0.55 0.77 0.92 0.46 0.51 1.92 0.68 -35.46 3.80 2.01 4.09 0.82 0.09 July 0.22 0.30 0.47 0.55 0.73 0.88 0.34 0.48 2.05 0.69 -37.07 8.46 2.78 4.49 0.68 0.08 August 0.24 0.30 0.49 0.55 0.35 0.26 0.17 0.14 2.55 0.73 -40.92 8.55 3.66 5.18 0.62 0.11 September 0.19 0.31 0.43 0.56 0.13 0.83 0.05 0.46 2.77 0.72 -38.87 2.28 4.75 5.83 0.41 0.09 October 0.26 0.20 0.51 0.45 0.12 0.77 0.06 0.34 2.71 0.97 -34.59 -2.80 4.08 5.92 0.50 0.06 November 0.44 0.26 0.67 0.51 0.27 0.23 0.18 0.12 2.50 1.39 -28.22 -12.10 2.08 5.02 0.77 0.09 December 0.44 0.59 0.66 0.77 0.30 0.28 0.20 0.22 2.20 1.36 -26.50 -4.34 2.41 4.86 0.68 0.10
Hargreaves and Samani (1985)
574
Gurski
et
al.
Month R2 R “d” “c” RMSE(mm day-1) ME(%) a(mm day-1) b(dimensionless)
NC C NC C NC C NC C NC C NC C NC C NC C
June 0.36 0.45 0.60 0.67 0.86 0.88 0.51 0.59 1.32 0.74 -22.99 14.00 2.01 1.62 0.82 0.04 July 0.22 0.22 0.47 0.47 0.83 0.67 0.39 0.31 1.36 0.92 -22.87 18.73 2.78 1.74 0.68 0.20 August 0.24 0.39 0.49 0.63 0.51 0.34 0.25 0.21 1.58 1.11 -24.37 19.56 3.66 1.96 0.62 0.29 September 0.19 0.33 0.43 0.57 0.22 0.86 0.10 0.49 1.68 0.84 -21.59 10.07 4.75 2.31 0.41 0.25 October 0.26 0.23 0.51 0.48 0.34 0.90 0.17 0.43 1.60 0.81 -18.45 5.91 4.08 2.88 0.50 0.17 November 0.44 0.13 0.67 0.36 0.53 0.86 0.35 0.31 1.53 0.86 -12.87 0.66 2.08 3.53 0.77 0.13 December 0.44 0.18 0.66 0.43 0.53 0.75 0.35 0.32 1.32 1.00 -12.05 5.24 2.41 3.63 0.68 0.15
Linacre (1977)
Annual 0.36 0.21 0.60 0.46 0.31 0.32 0.19 0.15 4.09 3.80 -61.09 -59.05 10.18 2.89 -2.12 -0.13 January 0.56 0.39 0.75 0.62 0.28 0.82 0.21 0.51 4.13 1.03 -58.62 -1.90 12.33 2.24 -2.85 0.61 February 0.51 0.47 0.71 0.69 0.29 0.80 0.21 0.55 3.88 0.94 -56.99 2.65 12.32 3.03 -2.80 0.48 March 0.54 0.47 0.74 0.68 0.43 0.80 0.32 0.55 3.43 0.93 -52.14 -2.25 12.42 2.24 -2.94 0.56 April 0.51 0.34 0.71 0.59 0.53 0.82 0.38 0.48 3.10 0.88 -51.55 1.28 10.56 2.90 -2.32 0.41 May 0.46 0.26 0.68 0.51 0.63 0.91 0.43 0.46 2.93 0.72 -51.73 1.43 9.75 2.70 -2.27 0.41 June 0.40 0.33 0.63 0.57 0.65 0.93 0.41 0.53 2.92 0.64 -55.61 5.89 8.65 2.87 -1.93 0.40 July 0.40 0.29 0.63 0.54 0.60 0.92 0.38 0.50 3.17 0.61 -59.27 4.95 8.49 2.95 -1.92 0.39 August 0.33 0.23 0.57 0.48 0.23 0.59 0.13 0.28 4.17 0.68 -68.28 6.39 8.78 4.19 -1.67 0.27 September 0.42 0.17 0.65 0.42 0.07 0.85 0.04 0.35 4.94 0.74 -71.85 2.99 10.17 4.63 -2.03 0.29 October 0.42 0.40 0.65 0.63 0.06 0.92 0.04 0.58 5.27 0.74 -71.96 1.74 10.91 3.52 -2.17 0.47 November 0.58 0.42 0.76 0.65 0.15 0.88 0.11 0.57 5.00 0.93 -66.64 -2.16 12.27 1.96 -2.84 0.67 December 0.48 0.41 0.69 0.64 0.17 0.81 0.12 0.52 4.55 1.05 -64.08 1.13 11.67 2.94 -2.51 0.49
Budyko (1974)
Annual 0.36 0.21 0.60 0.46 0.33 0.35 0.20 0.16 2.88 2.55 -33.56 -30.32 10.91 4.74 -1.44 -0.20 January 0.56 0.38 0.75 0.62 0.27 0.82 0.20 0.51 2.88 1.02 -30.19 -1.75 13.57 2.27 -2.01 0.60 February 0.50 0.48 0.71 0.69 0.31 0.80 0.22 0.55 2.57 0.94 -27.72 2.66 13.71 3.04 -2.02 0.47 March 0.54 0.47 0.74 0.68 0.46 0.80 0.34 0.55 2.18 0.93 -19.97 -2.17 14.00 2.25 -2.14 0.56 April 0.51 0.35 0.71 0.59 0.61 0.82 0.43 0.48 1.84 0.88 -18.64 1.37 11.71 2.91 -1.67 0.41 May 0.45 0.27 0.67 0.52 0.72 0.91 0.49 0.47 1.74 0.71 -17.91 1.43 10.68 2.73 -1.58 0.41 June 0.40 0.33 0.63 0.57 0.77 0.93 0.48 0.54 1.69 0.63 -23.46 5.93 9.27 2.89 -1.30 0.39 July 0.39 0.29 0.63 0.54 0.70 0.92 0.44 0.50 1.96 0.61 -29.24 4.96 8.99 2.99 -1.25 0.38 August 0.32 0.23 0.57 0.48 0.27 0.59 0.15 0.28 2.94 0.67 -44.51 6.32 9.13 4.22 -1.07 0.27 September 0.41 0.17 0.64 0.41 0.07 0.85 0.04 0.35 3.69 0.74 -50.81 2.90 10.65 4.65 -1.31 0.28 October 0.41 0.39 0.64 0.62 0.06 0.91 0.04 0.57 4.01 0.75 -51.28 1.83 11.44 3.67 -1.41 0.45 November 0.57 0.41 0.76 0.64 0.13 0.88 0.10 0.56 3.79 0.94 -42.88 -2.10 13.14 2.07 -1.90 0.65 December 0.48 0.39 0.69 0.62 0.16 0.80 0.11 0.50 3.25 1.08 -38.81 1.71 12.67 2.96 -1.74 0.50
with the climatic characteristics of the regions where the method was adjusted and validated (Irmaket al., 2006). Compared to our results, Mendonçaet al.(2003), Choi Ju-nioret al.(2011) and Todorovicet al.(2013) also observed better adjustment of methods based only on air temperature in warm and dry climates, justifying its use when there is unavailability of climate data.
Thus, it is observed the link between the performance of each alternative method with climatic conditions of the region where it is being used, highlighting the importance of detailed study of tendency ofEToand input variables in climate models.
Furthermore, the best performance of the calibrated alternative methods emphasizes the importance of calibra-tion of models to the region of interest (Garciaet al., 2007; Pandeyet al., 2016).
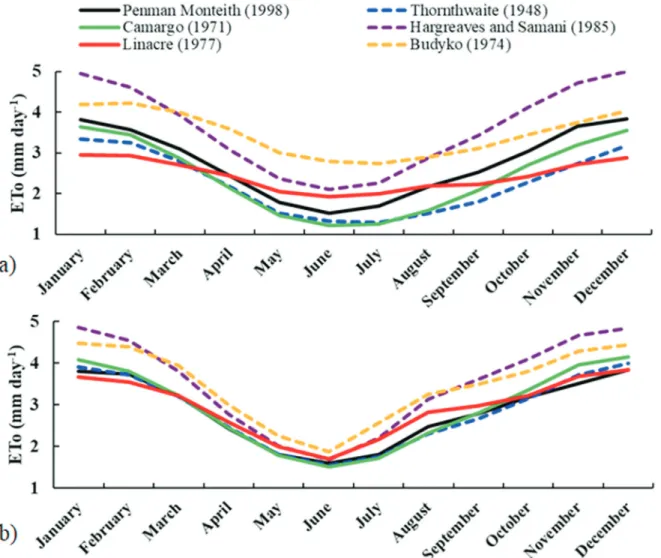
It was found similar trend of estimatedEToby alter-native methods in relation to the standard method of Pen-man-Monteith for Cfb climate (Fig. 1a), especially after the calibration of the methods (Fig. 1b). The highest values
ob-served occurred in the summer, reflecting the greater avail-ability of energy in the soil-plant-atmosphere system at this period (Syperrecket al., 2008).
Similar results were observed for the Bsh climate type (Fig. 2), but with less seasonality ofETothroughout the year, characteristic of this climate type. However, the smaller values ofEToremained in the winter period. Prior to calibration, all alternative methods underestimated EToPM, and it was observed great variation between estima-tions (Fig. 2a). The same trend was observed by Caiet al. (2007) in warm and dry regions, due to overestimation of actual vapor pressure, resulting in inconsistent estimations of some alternative methods.
Although confirmed the possibility of using alterna-tive methods to estimateEToin conditions where climatic variables required for the standard method are not avail-able, the results obtained in this study demonstrate the need for obtaining alternative consistent estimations for all Bra-zilian climatic conditions, from the simplified generation of alternative methods. In this sense, it stands out the
under-Alternative Methods of Reference Evapotranspiration for Brazilian Climate Types 575
Figure 1- Monthly average reference evapotranspiration (ETo) estimated by the standard method (EToPM) for climate type “Cfb” between 1970 and
standing of the real influence of climate variables on the trend ofETo, which will form the basis for the simplifica-tion of the estimasimplifica-tion. Therefore, given the territorial exten-sion of Brazil and the great variability of latitude and altitude over regions, which result in different climate types, the sensitivity study ofETois interesting and neces-sary. The study enables trends identification, constraints, to develop simplifications of the standard method and to pro-pose alternative methods with a possible decrease of the number of input variables needed for an accurate estima-tion.
4. Conclusions
1. In order of importance, the Hargreaves and Sa-mani, and Linacre methods showed a strong linear associa-tion with standardEToPMin the subtropical and semi-arid climate, respectively.
2. The Linacre and Budyko methods were particu-larly robust in subtropical and semi-arid climates, outlining
the importance of continuous measurements of the air tem-perature used in theEToLandEToBmodeling effort.
3. The results presented here showed the importance to calibrate the alternative methods on evapotranspiration estimative and outlined the need for improvement and pro-position of newETomethods based on a limited number of climatic variables commonly available in subtropical and semi-arid climates in Brazil.
References
ALENCAR, L.P.; SEDIYAMA, G.C.; MANTOVANI, E.C. Esti-mation of reference evapotranspiration (ETo) under FAO standards with missing climatic data in Minas Gerais, Brazil.Engenharia Agrícola, v. 35, n. 1, p. 39-50, 2015. ALLEN, R.G.; PEREIRA, L.S.; RAES, D.; SMITH. M.Crop
evapotranspiration: guidelines for computing crop wa-ter requirements. Rome: FAO, 1998.
ÁLVARES, C.A.; STAPE, J.L.; SENTELHAS, P.J.; GONÇAL-VES, J.L.M.; SPAROVEK, G. Koppen’s climate
classifica-576 Gurskiet al.
Figure 2- Monthly average reference evapotranspiration (ETo) estimated by the standard method (EToPM) for climate type “Bsh” between 1970 and
tion map for Brazil. Meteorologische Zeitschrift, v. 2, p. 711-728, 2013.
ASCE-EWRI. The ASCE Standardized Reference Evapo-transpiration Equation. Reston: Institute of the American Society of Civil Engineers, 171 p., 2005.
BLANEY, H.F.; CRIDDLE, W.D.Determining water require-ments in irrigated area from climatological irrigation data. Washington: US Department of Agriculture, 1950.
BORGES, A.C.; MENDIONDO, E.M. Comparison of empirical equations to estimate reference evapotranspiration in Jacupiranga River Basin. Revista Brasileira de Enge-nharia Agrícola e Ambiental, v. 11, p. 293-300, 2007.
BUDYKO, M. I.Climate and life. New York: Academic Press,
1974.
CAI, J.; LIU, Y.; LEI, T.; PEREIRA, L.S. Estimating reference evapotranspiration with the FAO Penman-Monteith equa-tion using daily weather forecast messages.Agricultural and Forest Meteorology, v. 145, n. 1-2, p. 22-35, 2007.
CAMARGO, A.P.Balanço hídrico no estado de São Paulo. Campinas: IAC, 1971.
CAMARGO, A.P.; SENTELHAS, P.C. Performance evaluation of different methods of estimation of potential evapotranspi-ration in State of São Paulo.Revista Brasileira de Agro-metereologia, v. 5, n. 1, p. 89-97, 1997.
CAVALCANTE JUNIOR, E.G.; OLIVEIRA A.D.; ALMEIDA B.M.; SOBRINHO, J.E. Methods of estimation of reference crop evapotranspiration for the conditions of northeastern semiarid, Brazil.Semina, v. 32, p. 1699-1708, 2011.
CHAUHAN, S.; SHRIVASTAVA, R.K. Performance evaluation of reference evapotranspiration estimation using climate based methods and artificial neural networks.Water Re-source Management, v. 23, n. 5, p. 825-837, 2009.
DOORENBOS, J.; PRUITT, W. O.Crop water requirements.
Rome: FAO, 1977.
GARCIA, M.; VILLAGARCIA L.; CONTRERAS, S.; DOMIN-GO, F.; PUIG, F.J. Comparison of three operative models for estimating the surface water deficit using ASTER reflec-tive and thermal data.Sensors, v. 7, p. 860-883, 2007.
GARDIMAN JUNIOR, B.S.; MAGALHÃES, I.A.L.; CECILIO, R.A. Comparison between different methods of estimating reference evapotranspiration (ETo) for Linhares, ES. Nu-cleus, v. 9, n. 2, p. 103-112, 2012.
HARGREAVES, G.H.; SAMANI, Z.A. Reference crop evapo-transpiration from temperature. Applied Engineering Agriculture, v. 1, n. 2, p. 96-99, 1985.
HUPET, F.; VANCLOOSTER, M. Effect of the sampling fre-quency of meteorological variables on the estimation of ref-erence evapotranspiration.Journal of Hydrology, v. 243,
p. 192-204, 2001.
INMET - Instituto Nacional de Meteorologia.Meteorological
database for education and research - BDMEP. 2016.
Access in 22 jan. 2016. Available in: http://www.bdmpe.inmet.br/ .
IRMAK, S.; PAYERO, J.O.; MARTIN, D.L.; IRMAK, A.; HO-WELL, T.A. Sensitivity analyses and sensitivity coeffi-cients of standardized daily ASCE-Penman-Monteith equa-tion. Journal of Irrigation and Drainage Engineering, v. 132, p. 564-578, 2006.
KOPPEN, W. Das geographische system der klimate. In: KOP-PEN W, GIEGER R. (Eds.). Handbuch der klimatologie.
Gebruder Borntrager, v. 1, p. 1-44, 1936.
LEMOS FILHO, L.C.A.; MELLO C.R.; FARIA, M.A.; CARVA-LHO, L.G. Spatial-temporal analysis of water requirements of coffee crop in Minas Gerais State, Brazil.Revista
Bra-sileira de Engenharia Agrícola e Ambiental, v. 14,
p. 165-172, 2010.
LINACRE, E.T. A simple formula for estimating evapotrans-piration rates in various climates, using temperature data alone.Agricultural Meteorology, v. 18, p. 409-424, 1977.
MENDONÇA, J.C.; SOUSA, E.F.; BERNARDO, S.; DIAS, G.P.; GRIPPA, S. Comparison of estimation methods of ref-erence crop evapotranspiration (ETo) for Northeren Region of Rio de Janeiro State, Brazil.Revista Brasileira de En-genharia Agrícola e Ambiental, v. 7, p. 276-279, 2003.
OLIVEIRA, R.A.; TAGLIAFERRE, C.; SEDIYAMA, G.C.; MATERAM, F.J.V.; CECON, P.R. Performance of the “Irrigâmetro” in the estimation of reference evapotrans-piration. Revista Brasileira de Engenharia Agrícola e Ambiental, v. 12, p. 166-173, 2008.
PANDEY, K.P.; DABRAL, P.P.; PANDEY, V. Evaluation of ref-erence evapotranspiration methods for the northeastern re-gion of India.International Soil and Water Conservation Research, v. 4, p. 56-67, 2016.
PENMAN, H.L. Natural evaporation from open water, bare soil and grass. Proceedings of the Royal Society, v. 193, p. 120-145, 1948.
PEREIRA, A.R.; VILA NOVA, N.A.; SEDYAMA, G.C.
Evapo(transpi)ração. Piracicaba: ESALQ; 1997.
SILVA, A.O.; MOURA, G.B.A.; SILVA, E.F.F.; LOPES, P.M.O.; SILVA, A.P.N. Spatio-temporal analysis of the ref-erence evapotranspiration under differents regimes of the precipitation in Pernambuco.Caatinga, v. 24, p. 135-142,
2011.
SOUZA, J.M.; PEREIRA, L.R.; RAFAEL, A.M.; SILVA, L.D.; REIS, E.F.; BONOMO, R. Comparison of methods for esti-mating reference evapotranspiration in two locations of Es-pírito Santo.Revista Brasileira de Agricultura Irrigada, v. 8, n. 2, p. 114-126, 2014.
SYPERRECK, V.L.G.; KLOSOWSKI, E.S.; GRECO, M.; FUR-LANETTO, C. Models of performance evaluation for esti-mates of reference evapotranspiration for the region of Palo-tina, State of Parana.Acta Scientiarum Agronomy, v. 30, p. 603-609, 2008.
THORNTHWAITE, C.W. An approach toward a rational classifi-cation of climate. Geographical Review, v. 38, n. 1,
p. 55-94, 1948.
TODOROVIC, M.; KARIC B.; PEREIRA L.S. Reference evapo-transpiration estimate with limited weather data across a range of Mediterranean climates. Journal of Hydrology, v. 481, p. 166-176, 2013.
TRAJKOVIC, S.; KOLAKOVIC, S. Evaluation of reference eva-potranspiration equations under wet conditions.Water Re-sources Management, v. 23, p. 3057-3067, 2009.
XU, C.Y.; SINGH, V.P. Evaluation of three complementary rela-tionship evapotranspiration models by water balance ap-proach to estimate actual regional evapotranspiration in dif-ferent climatic regions. Journal of Hydrology, v. 308, p. 105-121, 2005.
WILLMOTT, C.J.; ROWE, C.M.; MINTZ, Y. Climatology of ter-restrial seasonal water cycle.Journal of Climatology, v. 5,
p. 589-606, 1985.
This is an Open Access article distributed under the terms of the Creative Commons Attribution Non-Commercial License which permits unrestricted non-commercial use, distribution, and reproduction in any medium provided the original work is properly cited.