Universidade do Minho Escola de Engenharia Departamento de Inform´atica
Nuno Miguel Vilela Carvalho
A Data Analysis approach to study
events’ influence in Social Networks
Escola de Engenharia Departamento de Inform´atica
Nuno Miguel Vilela Carvalho
A Data Analysis approach to study
events’ influence in Social Networks
Master dissertation
Master Degree in Computer Science
Dissertation supervised by
Paulo Jorge Freitas de Oliveira Novais
A C K N O W L E D G E M E N T S
This thesis is the end result of almost one year of work, for which many people contributed. Some had a direct impact, while many others influenced me in a more indirect way.
First and foremost, I would like to thank my supervisor Professor Paulo Novais for moti-vating me into this work and accompanying me till its end. In the beginning several were available and, through a healthy discussion, we figured what the most interesting work was possible. When developing a thesis, it is of the uttermost importance being interested in it. Also, a major thanks to Marco Gomes for the continuous support he provided me during the work on this research project. I thank him for the understanding showed for the various problems that I have encountered at certain times and for his help in solving them.
Both meant a great deal and showed a great availability to discuss many of the doubts that I had throughout this thesis. For that, they have my utmost respect and gratitude.
A special thanks to my entire family, specially to my parents Armindo and Paula, and my brother Jos´e, who rode with me in this journey that now culminates with this thesis. They were right there, with me, the whole time.
Thank you for a lot of good advice and guidance, you are the reason I’m here today.
Nowadays, the assimilation of web content, by each individual, has a considerable impact on our’ everyday life.
With the undeniable success of online social networks and microblogs, such as Facebook, Instagram and Twitter, the phenomenon of influence exerted by users of such platforms on other users, and how it propagates in the network, has been attracting, for some years computer scientists, information technicians, and marketing specialists.
Increased connectivity, multi-model access and the rise of social media shortened the distance between almost every person in the world, more and more content is generated. Extracting and analyzing a significant amount of data is not a trivial task, Big Data tech-niques are essential.
Through the analysis of this interaction, an exchange of information and feelings, it is entirely imaginable its usefulness in understanding complex human behaviours and so, help diverse organization’s decision-making. Influence maximization and viral marketing are among the possibilities.
This work is intended to study what is the impact and role that an event’s social influence has and how does it propagate, particularly on its surrounding territory. This influence is inferred by analysis of the online platform’s data, by applying intelligent techniques, right after its extraction. The final step is to validate the results with data from different sources. Helping businesses through actionable and valuable knowledge is the ultimate goal.
This document contemplates an introductory section where the study subject and its State of the Art are addressed. Next, the problem and what direction to take to solve it are discussed.
Keywords: Social networks, Intelligent Techniques, Social Influence.
R E S U M O
Atualmente, a assimilac¸˜ao de conte ´udo Web, por cada indiv´ıduo, tem um impacto con-sider´avel no nosso quotidiano.
Com o ineg´avel sucesso de redes sociais e microblogs, como por exemplo Facebook, Insta-gram e Twitter, o fen ˆomeno de influˆencia exercida, por utilizadores de tais plataformas, em outros utilizadores e como se propaga na rede tem atra´ıdo, por alguns anos, inform´aticos, tecnicos de informac¸˜ao e especialistas em marketing.
O aumento da conectividade, o acesso multi-modal e a proliferac¸˜ao dos meios de comunicac¸˜ao social reduziram a distˆancia entre quase todas as pessoas do mundo, mais e mais conte ´udo
´e gerado. Extrair e analisar uma grande quantidade de dados n˜ao ´e uma tarefa trivial, s˜ao essenciais t´ecnicas de Big Data.
Atrav´es da an´alise desta interac¸˜ao, troca de informac¸ ˜oes e emoc¸ ˜oes, ´e perfeitamente ima-gin´avel a sua utilidade na compreens˜ao de complexos comportamentos humanos e, por-tanto, ajudar na tomada de decis˜ao de diversas organizac¸ ˜oes. A maximizac¸˜ao da influˆencia e o marketing viral est˜ao entre as possibilidades.
Este trabalho destina-se a estudar qual ´e o impacto e o papel que a influˆencia social de um evento tem e como se propaga, particularmente no territ ´orio envolvente. Esta influˆencia ´e inferida pela an´alise dos dados de plataformas online, aplicando t´ecnicas inteligentes, logo ap ´os a sua extrac¸˜ao . O passo final ´e validar os resultados com dados de diferentes fontes. Ajudar empresas atrav´es do conhecimento valioso e atu´avel ´e o objetivo final.
Este documento contempla uma sec¸˜ao introdut ´oria, onde o assunto de estudo e o seu estado da arte s˜ao abordados. De seguida, ´e discutido o problema e a direc¸˜ao a seguir para o solucionar.
Palavras-chave: Redes sociais, T´ecnicas Inteligentes, Influˆencia social.
1 i n t r o d u c t i o n 1
1.1 Context and motivation 1
1.2 Objectives and hypothesis 2
1.3 Organization of the Thesis 2
2 l i t e r at u r e r e v i e w 4 2.1 Introduction 4 2.2 Background 5 2.2.1 Big Data 5 2.2.2 Data Extraction 8 2.2.3 Intelligent Techniques 9
2.2.4 Social Media and Web Content 11
2.2.5 Social influence analysis 14
2.3 State of the Art 16
2.4 Summary 19
3 t h e p r o b l e m a n d i t s c h a l l e n g e s 20
3.1 Introduction 20
3.2 Research Methodology 20
3.3 Proposed Approach - solution 21
3.3.1 System Architecture 23 3.4 Challenges 24 3.5 Summary 24 4 s o c i a l m e d i a a n d w e b c o n t e n t 25 4.1 Introduction 25 4.2 Social Media 28 4.3 Web Activity 31 4.4 News Aggregators 32
4.5 Tourism Related Activity 33
4.6 Data Preparation 35
4.7 Summary 39
5 d ata a na ly s i s 41
5.1 Introduction 41
5.2 Exploratory Data Analysis 42
5.3 Text analysis 43
Contents v
5.4 Time Series Analysis and Forecasting 43
5.5 Social Networks Analysis 45
5.5.1 Statistical Analysis 46
5.5.2 Community Detection 46
5.5.3 Evolution in Social Networks 47
5.6 Summary 47 6 c a s e s t u d y 49 6.1 Introduction 49 6.2 Experiment setup 51 6.3 Results 53 6.4 Discussion 71 6.5 Summary 72 7 c o n c l u s i o n 73 7.1 Work Summary 73
Figure 1 Taxonomy for big data sources fromDemunter(2017). 6
Figure 2 Big Data pipeline and its main challengesAgrawal et al.(2016). 7
Figure 3 Distinction between web scraping and crawlingAnonymous(c). 8
Figure 4 Data science terms fromAnonymous(b). 9
Figure 5 Types of machine learning algorithms. 10
Figure 6 Periods of access to social networking sites, byMarktest Consulting
(2017) 11
Figure 7 Social network websites the Portuguese have an account, from
Mark-test Consulting(2017) 12
Figure 8 Natural network of close friendships among 105 college students,
each circle represents a student, and each line a mutual friendship
Christakis and Fowler(2009). 13
Figure 9 Schematic view of the research process. 21
Figure 10 Proposed solution with its integrating components. 23
Figure 11 Scrapy framework architecture,Scrapy. 26
Figure 12 Python logo,Vin´ıcius Damaceno(2016). 36
Figure 13 Data Analysis,Anonymous(a). 41
Figure 14 Obvious rise of WRC Rally de Portugal’s impact over the years (light
blue - indirect economic impact; dark blue - direct economic impact),
de Portugal. 50
Figure 15 Search volume over time from Google Trends scraper. 52
Figure 16 Distribution of numeric attributes in tweets. 55
Figure 17 User followers count against tweets favorites,reply and retweet count
(Twitter). 55
Figure 18 User statuses count against tweets favorites, reply and retweet count
(Twitter). 56
Figure 19 Distribution of numeric attributes in Instagram posts. 56
Figure 20 User followers count against post view, favorite and reply count
(In-stagram). 57
Figure 21 Video upload date versus rank on the searches (Youtube). 58
Figure 22 Distribution of values in Flickr. 58
Figure 23 Wordcloud from Youtube, Twitter, Instagram and Flickr. 60
List of Figures vii
Figure 24 Trends from two of the social networks analyzed, Instagram and
Flickr. 61
Figure 25 Trends from another two of the social networks analyzed, Twitter
and Youtube. 62
Figure 26 Comparison between metric of influence 1 and 2. 63
Figure 27 Comparison between estimated influence and distinct sources, news
aggregators and web activity. 64
Figure 28 Comparison between estimated influence and tourism related
activ-ity. 64
Figure 29 Decomposition of the time series into trend, seasonal and residual
data with frequency parameter of 365 days. 66
Figure 30 Train, test and forecast series plotted together. 67
Figure 31 Evolution of the Instagram network, from before to after the event. 69
Table 1 Data extracted from Twitter. 29
Table 2 Data extracted from Instagram. 29
Table 3 Data extracted from Flickr. 30
Table 4 Data extracted from Youtube. 30
Table 5 Data extracted from Google Trends. 31
Table 6 Data extracted from Wikipedia. 32
Table 7 Data extracted from news websites. 32
Table 8 Data extracted from Tripadvisor. 33
Table 9 Data extracted from Booking. 34
Table 10 Data extracted from Airbnb. 34
Table 11 Data extracted from Expedia. 35
Table 12 Polarity classification on text from social networks text. 60
Table 13 Dynamic Time Warping calculation among estimated influence and
other pertaining trends. 65
Table 14 Dynamic Time Warping calculation among estimated influence and
other pertaining trends, focusing just in 2018. 65
Table 15 Mean values for the original time series plus the forecasted one. 68
Table 16 Distribution of nodes and edges. 68
Table 17 Top 10 users comparison between 3 different aproaches in
Insta-gram. 70
Table 18 Top 10 users comparison between 3 different aproaches in Twitter. 71
1
I N T R O D U C T I O N1.1 c o n t e x t a n d m o t i vat i o n
In an increasingly complex and connected world, the demand by business organizations for processes that help them make accurate and rapid decision-making, based on real data, has never been higher. At the same time, the growth of data available for study does not slow down, and we live in the Big Data era.
Currently, daily access to the web is facilitated, accompanied by the evolution of devices, and is already a formality. There is a deep and frequent interaction between individuals, to the point that there is no filter on what it is decided to be shared, resulting in a digital footprint that people leave in their day-to-day communication, actively or passively. This is the perfect stage for the study of social behaviours.
Through the knowledge extraction of web content, both social media, where there is a network of users sharing all kinds of information, as web activity, traces left by people when using search engines or when visiting websites, many purposes are possible. This dissertation’s focus is the study of social influence on the Web, applied to an event (intrinsic to a region).
Earlier works related to the diffusion of information or influence state that it is possible to trace and measure the evolution of this interference, on how to act or think, with success. Comparing to these, three of the points that are gone after, seeking improvement, are the use of few and similar data sources, the appropriateness of simple metrics and the closed world concept. The idea is to enrich the collected datasets with external resources or results, mixed-sources, so that the implemented metrics are precise, representative of the real world. The result´s validation by analyzing patterns of influence around the event location is also of concern.
These referred sources represent a relevant and reliable source of information, and there are objects of analysis at different spatial and temporal points, but also some difficulties, such as computational problems, heterogeneity, and data privacy. Of the set of several utili-ties, we must highlight the discovery of new trends and patterns, using explanatory models, characterization of groups that are of interest and the know-how and to whom redirect
1.2. Objectives and hypothesis 2
vestment through ads, for example. The prediction of inflows and other phenomena for subsequent years and the study of the role that influence holds in specific highlight events or commemorative dates are also relevant points of interest.
In the absence of any data, it is be necessary to elaborate information capture mecha-nisms, to pre-process and clean (if the data does not fit into the analysis universe), followed by a transformation process, so that later on, using tools and techniques of Data Science and learning systems, Machine Learning, useful and actionable knowledge can be achieved.
1.2 o b j e c t i v e s a n d h y p o t h e s i s
The primary purpose of this dissertation is to generate useful knowledge, associated with a physical event, through the analysis of information extracted from web content. This analysis is performed after the extraction of data from multiple online platforms, of varied typologies and content.
The objectives of this dissertation are therefore:
1. Implementation of all necessary infrastructure for information extraction; 2. Validation of information capture methods and models;
3. Specification of a computational system for the analysis of the objects of study of this work;
4. Validation of the computational system’s results.
The ultimate goal is to answer the question - Is it feasible, through a social networks’ data extraction and analysis methodology, to quantify and validate an event’s influence, on a specific region?
From the refereed goal, several questions can be formulated: How does the diffusion of an event’s influence evolve? In this diffusion, is there a correlation between different social media platforms? Is it possible to correlate estimated influence with other sources’ patterns of data surrounding the event? Or even with real-world phenomenon, such as an impact on the regional economy?
To answer this questions, specific methods and steps should be taken in order to investi-gate and retrieve the intended knowledge.
1.3 o r g a n i z at i o n o f t h e t h e s i s
After presenting and contextualizing the problem in question and the objectives to resolve it (chapter one), the definitions of this work’s related terms are given. Descriptions, which
are essential to fully understand the next ones, along with some literature review and associated works that certainly helped to find what the best direction is to achieve the desired results. In these studies are specified what problems other authors excelled.
In chapter three, is suggested an approach to the problem, how to tackle it. This includes giving an explanation on the chosen methodology and the issues that may arise trying to reach the solution.
Chapter four and five present how the data is collected, processed and what insights can be inferred with which techniques.
Chapter six demonstrates the solution previously studied through a case study, where the procedure followed, and the analysis’s results are detailed and discussed.
Finally, in chapter seven, conclusions are formed and discussed, what is already done, some limitations and possible directions that can be followed in the future.
Some references that helped to substantiate the problem are given on the last pages of the document.
2
L I T E R AT U R E R E V I E W2.1 i n t r o d u c t i o n
Over the last decade, the online world has been expanding exponentially, generating more and more content. AsMoniz(2017) states, such development may, mainly, be justified by:
1. Increased connectivity - The age of information in which we currently live has been defined by the appearance, and exponential growth of Internet users
2. Multi-modal access - The number of Internet users has risen at an accelerated pace, accompanied by the evolution of devices. Today, these provide near full-time access to the Internet. The main contributor to this new reality is the rise of mobile technology, both concerning the devices themselves and mobile data connectivity
3. The rise of Social Media - Social media platforms have greatly influenced the In-ternet due to their ability to not only connect users but mainly for allowing users to generate content of various types. These platforms continue to expand at a great pace, increasing their number of users, and the amount of content generated by them. Additionally, with the growing connectivity between users, these platforms form pow-erful mechanisms that are highly important for both information dissemination and information search.
The combination of these three factors caused a severe shortening of the distance between every other person in the world. This phenomenon plays an essential role in shaping users’ behaviors.
In this chapter, the work described is framed, by presenting a thorough literature review on social media, web content, social influence, and information propagation.
Firstly it is clarified the definition of frequent and relevant terms in this work, and sec-ondly exposed the current state of the art, where tasks have been extensively studied and analyzed, revealing distinct approaches. A discussion on their strengths and shortcomings is also introduced.
2.2 b a c k g r o u n d
In a field of study, such as computer science, that never stops evolving, a flood of new terms and definitions arise with new technologies or techniques, and consequentially caus-ing conflict with existcaus-ing ones. To resolve this doubt sometimes is better to relax some denominations and explain the processes and purposes.
2.2.1 Big Data
The definition of Big Data has changed and evolved several times. The easiest way to understand what it means is by explaining the famous reference to the three core V’s: volume, velocity and variety, along with the ones who entered the debate in recent years: veracity, validity, volatility and value (Demunter,2017).
Briefly, volume refers to the exploding quantity of data concerning observations — in orders of magnitude of gigabytes, terabytes, petabytes (and soon exabytes or zettabytes?) — and to the variables observed; velocity refers to how quickly this data is generated and
their resolution in time.
Varietyrefers to the many different types of data, such as natural language textual data (e.g., social media posts), photos (posted on, say, Instagram or Facebook), website logs, videos (e.g., camera surveillance), recordings or geo-coded data.
Veracityand validity touch upon the quality, reliability and usefulness of big data. The sheer volume of data and observations does not guarantee quality. On the contrary, the unwanted bias and noise in most big data sources are without a doubt some of the more complicated challenges for statisticians.
Volatilityrefers to how long the data remains relevant and how long it should be kept, bearing in mind the billions of impulses registered every second or the legal framework on retaining personal data
The value of big data is twofold: firstly, for statisticians as a potentially richer or timelier data source; and secondly, for businesses and policy-makers in an era of data-driven deci-sions. Those businesses or organizations holding the data are a particular case. Data is a valuable, marketable asset and can make these stakeholders reluctant to grant access to the data they contain.
The same referred author organizes big data sources into a taxonomy. The diagram below outlines the most common ones.
2.2. Background 6
Figure 1: Taxonomy for big data sources fromDemunter(2017).
Some of these sources are of particular interest in this work. The next paragraphs describe them.
Whether or not they intend to do so, people leave their digital footprint when using social media. Social media posts can be an information source on people’s movements and behaviour. Gomes et al.(2014) uses knowledge about social interactions as a basis for
informed decision support in situations of conflict.
Traces left by people while using search engines (e.g., Google Trends data) and visiting websites (e.g., Wikipedia page views), web activity can give an indication of which topics interest people at each moment in time.
A derived source such as page views of Wikipedia articles can be a proxy for visits to a destination, measured through the traveller’s web activity.
Traveler’s web activity, usually, dynamic websites feature structured data and an inter-face to access and consult a (dynamic) database. Typical examples include tripadvisor.com, booking.com or airbnb.com. In general, the data is obtained via web scraping, where pieces of relevant data are extracted from the web pages returned by dynamic website.
Static websites are composed of a limited amount of web pages which do not change frequently. Data is obtained by extracting the contents from the HTML source code and transforming them, clustering them into meaningful information for further analysis.
Taking tourist accommodation as an example, websites can give information on the ac-tivity status of establishments and their location, on the number of rooms and bed places available, and on standard prices.
Wikipedia contentsare also relevant. Both web activity and its underlying web contents can be relevant.
For a decade now, people have been sharing pictures online, picture collections rather than in printed photo albums. The smart devices used to take the images typically log the location and time stamp.
Solutions to big data problems will not come from incremental improvements to business. Instead, they require rethinking how data analysis is managedAgrawal et al.(2016). From
data, the ambition is to get insights.
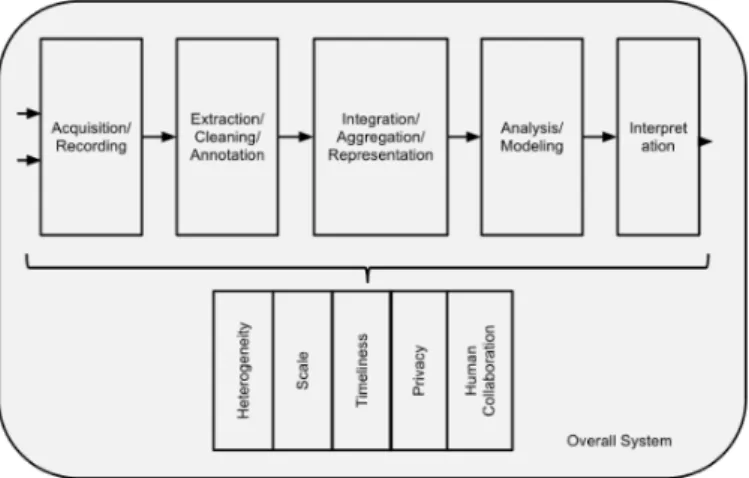
Therefore Big data analysis involves multiple distinct phases as shown in the figure below, each of which introduces challenges. Fortunately, existing computational techniques can be applied, either as is or with some extensions, to at least some aspects of the Big Data problems.
Figure 2: Big Data pipeline and its main challengesAgrawal et al.(2016).
Data Acquisition and Recordingis the first step, big data does not arise out of a vacuum: it is recorded from some data generating source. Much of this data is of no interest, and it can be filtered and compressed by orders of magnitude. One challenge is to define these filters in such a way that they do not discard useful information.
Frequently, the information collected will not be in a format ready for analysis, Informa-tion ExtracInforma-tion and Cleaning is essential. We cannot leave the data in this form and still effectively analyze it. Instead we require an information extraction process that pulls out the required information from the underlying sources and expresses it in a structured form suitable for analysis.
Given the heterogeneity of the flood of data, it is not enough merely to record it and throw it into a repository, Data Integration, Aggregation, and Representation is needed. Data analysis is considerably more challenging than only locating, identifying, understanding, and citing data. For useful large-scale analysis all of this has to happen in a completely automated manner.
Methods for querying and mining Big Data, Query Processing, Data Modeling, and Analysis, are fundamentally different from the traditional statistical analysis of small sam-ples. Big Data is often noisy, dynamic, heterogeneous, inter-related and untrustworthy. Nevertheless, even noisy Big Data could be more valuable than tiny samples. Mining
re-2.2. Background 8
quires integrated, cleaned, trustworthy, and efficiently accessible data, declarative query, and mining interfaces, scalable mining algorithms, and big-data computing environments.
Having the ability to analyze Big Data is of limited value if users cannot understand the analysis. Ultimately, a decision-maker, provided with the result of analysis, has to interpret these results. Interpretation cannot happen in a vacuum. Usually, it involves examining all the assumptions made and retracing the analysis. In short, it is rarely enough to provide just the results.
The challenges include not just the obvious issues of scale, but also heterogeneity, lack of structure, error-handling, privacy, timeliness, provenance, and visualization, at all stages of the analysis pipeline from data acquisition to result in interpretation. These technical challenges are common across a large variety of application domains, and therefore not cost-effective to address in the context of one domain alone.
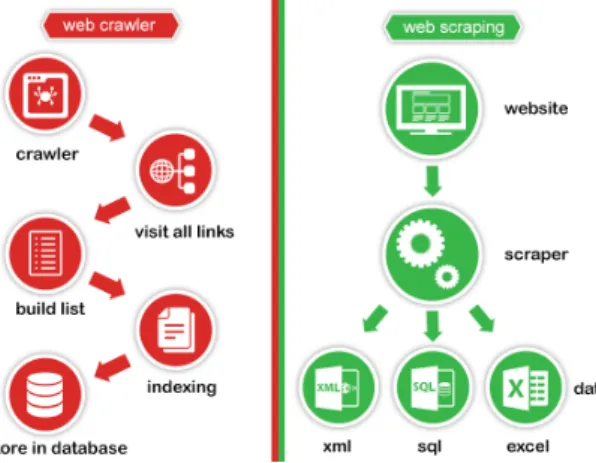
2.2.2 Data Extraction
As it is normal in such an evolving field, there are terms constantly emerging with similar definitions. In the specific case of data extraction, web scraping and web crawling are the most dominant ones.
Web crawling is used to index the information on the page using different kinds of bots. Basically it is used by major search engines, such as Google. In other terms they are the major web crawlers. Here we get generic information, where as scraping we get specific information.
In simple terms, Web scraping is the process of automatically requesting a web document and collecting information from it.
Figure 3: Distinction between web scraping and crawlingAnonymous(c).
Information is one of the most valuable item in the whole world. This means that those who have the information take all possible precautions to protect them against copying,
which in their eys is like stealing. Web scrapers are simply the algorithms that can automate the information extraction from publicly available sources.
It is easy to reach an abusive state to the websites’ servers. For example, web scrapers can send far more requests per second than a human would do. Having this in mind when scraping, not one legal issue may rise.
Some rules in order to respect who is on the other side of the problem, are common sense in this field. It is always a good practise having a little common sense and respect the entity from which the data is extracted. Having regard to robots.txt protocol and also to a minimal submission of forms and javascript execution is a good start.
2.2.3 Intelligent Techniques
As data is growing at a faster pace, new terms associated with processing and handling data are coming up. Data science, data analysis, data analytics, data mining and machine learning, for example, are considered intelligent techniques.
Commercial organizations have realized that there is enormous value hiding in the data and are employing the techniques related to these to achieve that value. Ultimately what they all intend to produce is insights, things that may not have been known otherwise, such asCarneiro et al.(2015b), in which a stress estimation is performed.
Figure 4: Data science terms fromAnonymous(b).
Insight on these terms and how they differentiate is presented byHeiler(2017).
Data scientists are responsible for coming up with data-centric products and applications that handle data in a way which conventional systems cannot. The process of data science is much more focused on the technical abilities to manage any type of data. Unlike others, it is responsible for assessing the impact of data in a specific product or organization.
While data science focuses on the science of data, data mining is concerned with the process. It deals with the process of discovering newer patterns in big data sets. It might be apparently similar to machine learning because it categorizes algorithms. However, unlike machine learning, algorithms are just a part of data mining. In machine learning algorithms
2.2. Background 10
are used for gaining knowledge from data sets. However, in data mining algorithms are only combined as the part of a process. Unlike machine learning, it does not completely focus on algorithms.
Data science is the denomination that includes all the other ones, comprising everything that has to do with preparation, cleansing, and analysis, dealing with both structured and unstructured data. There are also two more specializations between the broadest and most confined terms someone can have, data analysis and data analytics.The analysis is a heuris-tic activity, where scanning through all the data the analyst gains some insight. Analyheuris-tics is about applying a mechanical or algorithmic process to derive the insights, for example, running through various data sets looking for meaningful correlations between them.
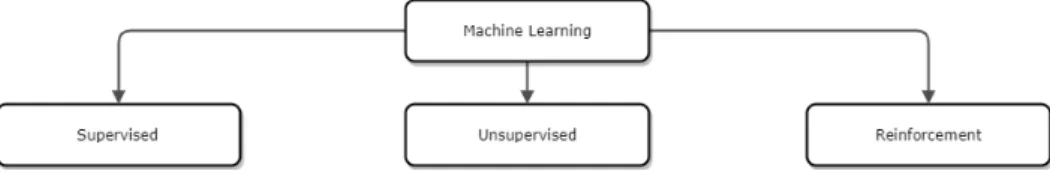
One of the difficulty lies on how to get all the information that matters from data. Each technique has one purpose: discovering knowledge, distilling knowledge in form of rules or discovering optimal solutions.
Figure 5: Types of machine learning algorithms.
The three types of machine learning algorithms are now elucidatedJain(2015).
Supervised Learning / Predictive model, as the name suggests, is used to predict the future outcome based on the historical data. Predictive models are normally given clear instructions right from the beginning as in what and how it needs to be learned.
For example: Supervised Learning is used when a marketing company is trying to find out which customers are likely to churn. We can also use it to predict the likelihood of occurrence of perils like earthquakes, tornadoes, etc. with an aim to determine the Total Insurance Value.
Some examples of algorithms used are: Nearest neighbour, Naive Bayes, Decision Trees, Regression, etc.
Unsupervised learning / Descriptive model is used to train models where no target is set and no single feature is important than the other.
The case of unsupervised learning can be: When a retailer wishes to find out what is the combination of products, customers tends to buy more frequently. Furthermore, in the pharmaceutical industry, unsupervised learning may be used to predict which diseases are likely to occur along with diabetes.
Example of algorithm used here is: K- means Clustering Algorithm.
Reinforcement learningis an example of machine learning where the machine is trained to take specific decisions based on the business requirement with the sole motto to
max-imize efficiency (performance). The idea involved in reinforcement learning is: The ma-chine/ software agent trains itself on a constant basis based on the environment it is ex-posed to, and applies it’s enriched knowledge to solve business problems. This continual learning process ensures less involvement of human expertise which in turn saves a lot of time!
An example of algorithm used is the Markov Decision Process.
There is a subtle difference between Supervised Learning and Reinforcement Learning. The last one essentially involves learning by interacting with an environment. Learns from its experience, preferably from its continual trial and error learning process whereas in supervised learning an external supervisor provides examples.
2.2.4 Social Media and Web Content
A Portuguese study, realized between 19 of July and 7 of August (2017), seemed to know the habits of users of social networks, the sites they know and use the most, the features they value most, the personalities and brands they follow, how often they access the sites and with which they publish information on those sites, as well as the time they devote to them or the equipment they use to access them. 818 interviews were done, a sample stratified by Marktest Consulting (2017), being proportional to the population that constitutes the
universe, according to the variables gender and age.
2.2. Background 12
Figure 7: Social network websites the Portuguese have an account, fromMarktest Consulting(2017)
From the figures above is quite perceptible that, along with Facebook, Instagram, What-sApp and YouTube are the social network websites with more accounts and consequentially more impact in Portugal. This study also states that Monday, Saturday and Sunday, between 20 and 24 o’clock, are the periods with the highest peak of activity.
These stats are of great interest on understanding which online platforms are more rele-vant and so, the ones that should be selected to study.
One mission of this work is to extract and mix several sources, content from different types of online platforms, resulting in a expanded spectrum and more richness to the data. From professional or image online platforms to options for bloggers and social video networks, it is easy to find something that matches everyone needs. There are all kinds of online platforms, it is possible to have it all, and can be divided by the user’s intention on using or the network content. Social network websites, such as Facebook and Google+, are social media channels that don’t tend to focus on any one specific topic and instead aim to attract a broad spectrum of users. Users communicate, click, and share different content types that reflect their interests, making the themes on such social networks just as diverse as the users themselves.
Image networks websites, like Pinterest and Instagram, are image sharing platforms, visual aspects are put at the forefront: the focus here lies on publishing photos and videos; comments play a smaller role. What counts the most is entertaining posts that leave a strong and lasting visual impression on target groups.
The origins of Blogging networks websites, Twitter and Tumblr, can be traced back to the blogging scenes. Users of both networks share different types of content (news, links, images, videos). Those who chose to follow a particular timeline are then presented with
news regarding this profile in their timeline. Users who aren’t registered with the account also can view all the content that is posted.
Professional networks websites, like LinkedIn, have created themselves a niche market by catering explicitly to a more professional environment. This platform model facilitates an exchange between business partners, employees as well as applicants and companies to occur.
YouTube is by far the most widely used channel of its kind, video networks websites, and innovative ideas are awarded on this channel, allowing some individuals to turn their hobby into a career.
At this point there might be some confusion related to social networks and online social networking site. The former is a mobile or web-based software platform that allows users to interact with their social connections.
While a network, like a group, is a collection of people, a social network includes some-thing more: a specific set of connections between people in the group. These ties and the particular pattern of these, are often more important than the individual people themselves
Christakis and Fowler(2009).
Other authors, such asChen et al. (2013), classify a social network as a possibly directed
graph. It may be homogeneous, where all nodes are of the same type, or heterogeneous, in which case the nodes fall into more than one kind.
Examples of homogeneous networks include the underlying graphs representing friend-ships in basically all of the social networking platforms (e.g., the list of “friends” in Face-book), as well as the graphs representing co-authorship or co-worker relationships in col-laboration networks.
Examples of heterogeneous networks include rating networks consisting of people and objects such as songs, movies, books, etc. Here, people may be connected to one another via friendship or acquaintance, whereas objects (songs, movies, etc.) may be linked with one another using of similarity of their metadata.
Figure 8: Natural network of close friendships among 105 college students, each circle represents a student, and each line a mutual friendshipChristakis and Fowler(2009).
2.2. Background 14
A social network is formally represented by a graph, where nodes are users and edges are relationships that can be either directed or not depending on how relationships are managed by the system. More precisely, it depends on whether it allows connecting in a unilateral (e.g., Twitter social model of following) or bilateral (e.g., Facebook social model of friendship) manner.
An influence graph is often represented as a weighted, directed graph with edge weights indicating how much influence a particular source node has on its destination.
2.2.5 Social influence analysis
Milgram’s experiment, conducted in the 1960s, involved giving a few hundred people who lived in Nebraska a letter addressed to a businessman in Boston, more than a thousand miles away. They were asked to send the letter to somebody they knew personally. The goal was to get it to someone they thought would be more likely than they to have a personal relationship with the Boston businessman. And the number of hops from person to person that the letter took to reach the target was tracked. On average, six hops were required (a friend is one degree away, a friend’s friend is two degrees, and so on). This amazing fact initiated a whole set of investigations into the small-world effect.
However, just because we are connected to everyone else by six degrees of separation does not mean that we hold sway over all of these people at any social distance away from us. Christakis and Fowler(2009) research has shown that the spread of influence in social
networks obeys the Three Degrees of Influence Rule. Everything we do or say tends to ripple through our network.
The term social influence analysis or just influence analysis has the same meaning as the analysis of the diffusion of information or influence through a social media platform. In this area there are several terms subject to confusion and the next paragraphs try to enlighten them.
But firstly, when and how can we say that there is influence between users? There are at least two different phenomena surrounding users’ behavior that are different from in-fluence, but may appear to be as such. Causes of correlation in social networks can be categorized into roughly three typesAnagnostopoulos et al.(2008).
The first is influence (also known as induction), where the action of a user is triggered by one of his/her friend’s recent actions. An example of this scenario is when a user buys a product because one of his/her friends has recently bought the same product.
The second is homophily, which means that individuals often befriend others who are similar to them and hence perform similar actions. For example, two individuals who own Xboxes are more likely to become friends due to the common interest.
The third is environment (also known as confounding factors or external influence), where external factors are correlated both with the event that two individuals become friends and also with their actions. For example, two friends are likely to live in the same city, and therefore to post pictures of the same landmarks in an online photo sharing sys-tem.
Developing accurate propagation models, predictive or explanatory, is crucial in effec-tively taking business actions in the social networking space, marketing.
Although there has been some interesting work in this direction, this is by far the area of which we know the least: it is mostly unclear why specific information propagates while other information does not, measuring influence remains a difficult task (in large part because all social network data is partial), and successful application of models depends on a number of external factors that are difficult to quantify.
Having influence is not just about the numbers of followers or friends, it is about the reaction. It is possible to follow the traces to see what happens to that content and where it ends up.
Eventually, the ingredients of an information diffusion process taking place in an social network can be summarized as followsBonchi et al.(2011): (i) a piece of information carried
by messages, (ii) spreads along the edges of the network according to particular mechanics, (iii) depending on specific properties of the edges and nodes.
The stream, produced by the members of the network, can be viewed as a sequence of decisions (i.e., whether to adopt a certain topic or not), with later people watching the actions of earlier people Guille et al. (2013). Therefore, individuals are influenced by the
actions taken by others. This effect is known as social influence, and is defined as follows: Social Influence, a social phenomenon that individuals can undergo or exert, also called imitation, translating the fact that actions of a user can induce his connections to behave similarly. Influence appears explicitly when someone “retweets” someone else for example. Based on the social influence effect, information can spread across the network through the principles of herd behavior and informational cascade which Guille et al. (2013) also
defines.
Herd behavior, a social behavior occurring when a sequence of individuals make an identical action, not necessarily ignoring their private information signals.
Information Cascade, a behavior of information adoption by people in a social network resulting from the fact that people ignore their information signals and make decisions from inferences based on earlier people’s actions.
Bonchi et al.(2011) as a similar idea of influence in social networks: when users see their
social contacts performing an action, they may decide to perform the action themselves (e.g., people buy items their friends buy). Influence for performing an action, may come
2.3. State of the Art 16
(i) from outside the social network, (ii) because the action is popular, or (iii) by the social contacts in the network.
Some authors also refer this the diffusion as contagion and for Christakis and Fowler
(2009) there are two fundamental aspects of social networks. First, there is a connection,
which has to do with who is connected to whom. Second, there is contagion, which pertains to what, if anything, flows across the ties. It could be buckets of water, of course, but it also could be germs, money, violence, fashions, kidneys, happiness, or obesity.
The usual way contagion is thought is if one person has something and comes into contact with another person, that contact is enough for the second person to get it. The spread of health behaviors such as vaccination is often modeled as a simple contagion process, similar to biological contagion, where each exposure event contributes equally to the probability of adoption of the behavior. However, there is increasing evidence that the process of social transmission of behaviors is governed by the process of complex contagion, where social reinforcement - i.e., multiple exposures from different peers - are necessary for adoption
Campbella and Salath´e(2013).
2.3 s tat e o f t h e a r t
Seeing ourselves as part of a superorganism allows us to understand our actions, choices, and experiences in a new light. If we are affected by our embeddedness in social networks and influenced by others who are closely or distantly tied to us, we necessarily lose some power over our own decisions. Christakis and Fowler(2009) believe that our connections
to other people matter the most, and that by linking the study of individuals to the study of groups, the science of social networks can explain a lot about human experience.
And, as referred to in the last section, our connections do not end with known people. People we may not even recognize can start chain reactions that eventually reach us.
On Christakis and Fowler(2013) a review of previous work, with several years, is done
and the authors explicitly state they stand behind it. Referring to an offline study, in which the medical records of about 12,000 patients were analyzed, they show stimulating evidence regarding social contagion. It is suggested that obesity may spread in social networks in a quantifiable and discernable pattern that depends on the nature of social ties. Social distance appears to be more important than geographic distance within these networks. There was not focus on causation but instead on correlation, but frequent exposure to local environmental factors were ruled out as an explanation for their observations. There was also account for sources of confounding.
Separating correlation and causation is a difficult task. Some researchers have tackled the problem of homophily vs influence has been tackled by some researchers.Anagnostopoulos et al.(2008) used two techniques in order to do this, shuffle test and edge reversal test. The
conclusion was that while it is true that influence does not play an essential role in users’ tagging behavior in Flickr, there is some limited effect by looking at the difference between similar tags, some propagation of the misspelled versions was identified.
Aral et al. (2009) describe a statistical method for distinguishing these two phenomena.
By analyzing the day-by-day mobile service adoption behavior of over 27 million Yahoo! users in Yahoo! instant messaging network, they show that homophily explains >50% of the perceived behavioral contagion in mobile service adoption. These findings demonstrate that homophily can account for a great deal of what appears at first to be a contagious process. It was found that different subsets of the population, characterized by distributions of individual and relational characteristics, such as the strength of ties and local clustering, display various susceptibilities to potential influence.
An experimental approach on Facebook to measure the spread of information sharing be-haviors was madeBakshy et al.(2012). A random sample of all Facebook users who visited
the site was acquired, comparing situations where both influences via the feed and external correlations exist (the feed condition), to circumstances in which only external correlations exist (the no feed condition). By balancing the behavior of individuals within these two conditions, is possible to determine the causal effect of the medium on information sharing. Weak ties are argued to have access to more diverse information because they are expected to have fewer mutual contacts. Although stronger ties are individually more influential, it is the more abundant weak ties who are responsible for the propagation of novel information. The majority of influence results from exposure to individual weak ties, which indicates that most information diffusion on Facebook is driven by pure contagion.
As for the speed and types of diffusion, the study of Zhao et al. (2012) on Facebook
networks, whose ties are within five American universities, find that information pushing speeds up the information exchange within an online social network. For the networks with very high clustering coefficients, selecting weak ties preferentially can speed up the information propagation.
Lerman and Ghosh(2010) tries to understand how information spreads through the social
network by measuring how the number of in-network votes a story receives. Posting a link on Twitter is analogous to submitting a new story on Digg, and retweeting the post is analogous to voting for it. Digg networks are dense and highly interconnected. A story posted on Digg initially spreads quickly through the network slowing down after the story is promoted to Digg’s front page. The Twitter social network is less dense than Digg’s, and stories spread through the network slower, but they continue spreading at this rate as the story ages and generally penetrate the network farther.
Another aproach is made byStieglitz and Dang-Xuan(2013). In this paper, it is explicitly
examined whether the affective dimensions of Twitter messages (positive and negative sen-timent) occurring in social media content are associated with a user’s information sharing
2.3. State of the Art 18
behavior. They found that emotionally charged Twitter messages tend to be retweeted more often and more quickly compared to neutral ones. Regarding the tweeting behavior of influ-ential users in the Twitter network, they tend to post more emotionally charged tweets. In doing so, their influence may increase even more because their emotionally charged content would be more likely to be disseminated.
Furthermore, do topics play a key role? Analyzing how tokens known as hashtags spread on a network defined by the interactions among Twitter users, such asRomero et al.(2011)
helps to answer this question. They found that tags of different types and topics spread in different mechanics. Along with it, some of the most significant differences in hashtag adoption provide intriguing confirmation of sociological theories developed in the off-line world. In particular, the adoption of politically controversial hashtags is primarily affected by multiple repeated exposures, while such repeated exposures have a much less critical marginal effect on the adoption of conversational idioms. They provide a large-scale vali-dation of the complex contagion.
While the existence of influence can be difficult to detect, some investigators do not altogether dismiss the role played by influence.
On the other hand, there have been other studies revealing the genuine and certain exis-tence of social contagion and influence. Huang et al.(2012) show that even after removing
the effects of homophily, there is clear evidence of influence. For instance, they find that people rate items recommended by their friends higher than they otherwise would.
With the rise of autonomous bots all around social networks, should they be taken in account? InBrachten et al. (2017) the strategies and influence of social bots were analyzed
based on relevant features and network visualization on a German state election in 2017, via Twitter. Possibly due to the concentration on the German language as well as the elections regionality, identified bots showed no signs of collective political strategies and low to none influence. This away, it is expected they do not interfere on the influence estimation.
Regarding the usefulness of the sources discussed in chapter 2, Demunter (2017)
ap-proaches this subject having in mind their application to tourism. Thus it can be related to this work, validating the impact of an event influence with data from a regional economy, for example. He starts by explaining a methodological barrier on social media posts, in particular related to the selectivity bias: the inclusion probability or likelihood that an indi-vidual or event will be observed is highly correlated with the intensity of activity (namely the frequency of posting on social media). This limits its usefulness to detecting short-term trends rather than volume information or longitudinal trends.
He continues by saying Web activity can indicate of which topics interest people at each moment in time. Searching for information on tourism destinations or page views of Wikipedia articles related to destinations can do much to help predict tourism flows. Interest via search queries or visiting websites does not always lead to a physical visit or a
purchase, but a correlation has been found several timesSharpe et al.(2016). A refined
anal-ysis (e.g., destination names in combination with search terms such as ‘hotel’ or ‘metro’) could increase the correlation with tourism visits.
A decade ago,Girardin et al.(2008) examined the potential of digital pictures to uncover
the presence and movement of people in a city. In their study they highlighted the relevance of this data for tourism (and urban) planning: ‘information about who populates different parts of the city at different times can lead to the provision of customized services (or advertising), accurate timing of service provision based on demand, and, in general, more synchronous management of service infrastructures’.
2.4 s u m m a r y
Most of the works concerning information and influence propagation in online or offline social networks regard one of next three areas: i) Detecting interesting, bursty, topics; ii) modeling diffussion processes, explanatory and predictive models; iii) identifying influen-tial spreaders.
Some limitations were found. A few authors use techniques with poor quantitative indi-cation of the existence of influence, and others do not consider topics. Furthermore, it is not easy to provide formal verification of results. Can we pinpoint social networks and behav-iors, where influence is indeed prevalent, and verify our tests? Also, what happens when different sources of social correlation are present, as is usually the case? Only some works inspected had in consideration several social networks sources. What if at least one source from every type of social network, by content, is taken into account? An event estimated influence could be correlated with an impact on the regional economy?
As made clear by the previous descriptions, the potential of social media and web activity data is immense. Also, its broad definition concerns a very diverse set of data types besides text, where each type contains particular properties.
All these important questions might be tricky to answer and probably require the design of controlled user experiments.
Relaxing the closed world assumption and scalability are additional adversities when researching influence propagation on social networks.
To summarize, the existence of influence and its effectiveness for applications such as enu-merated above depend on the datasets and what the goal is to do with them. There is both evidence supporting and challenging it, found from different datasets by researchers. For a given situation, careful analysis of evidence should first be undertaken before deciding whether to adopt a it. There is still much to be done in this area of investigation.
3
T H E P R O B L E M A N D I T S C H A L L E N G E S3.1 i n t r o d u c t i o n
The abundance of big data sources capable of capturing facets of the social influence phe-nomenon makes it abundantly clear that this is not an outdated area, it still is on the frontline.
In this chapter is suggested an approach to the problem, how to tackle it. This includes explaining on the chosen research and development methodologies, along with the prob-lems that may arise trying to reach the solution. Considering possible courses of action and selecting the best one are crucial tasks.
3.2 r e s e a r c h m e t h o d o l o g y
Similar research goals can be sought in completely different ways depending on the ac-cessibility and proximity of experts, synergies with ongoing research projects and so forth. Because of this research context, the chosen research strategy, represented in Figure 9, is
based on the following activities:
1. Update the acquired knowledge by reviewing recent and state-of-the-art publications; 2. Design and develop the different parts of the proposed models enlarging the scope
gradually in an iterative process;
3. Experiment on and evaluate the system;
4. Attend conferences and workshops to present partial results and to learn of existing state-of-the-art advancements;
5. Redesign the system with the feedback obtained from all the above means;
6. Develop and deploy the final system for context and behavioural analysis in real-world-like scenarios to gather results;
7. Disseminate the obtained knowledge and experiences to the research community.
Solution Design Update
Knowledge Experimentation Validation
Review of state-of-art Feedback from expert Feedback from experimentation Publications and Prototypes Publications
Figure 9: Schematic view of the research process.
This research process is the action-research methodology composed of five different phases:
• Diagnosing: identifying the problem;
• Action planning: considering possible courses of action; • Taking action: selecting a course of action;
• Evaluating: analyzing the consequences of the course of action; • Specifying results: identifying general findings.
These phases were applied to all the outlined research activities with the aim of providing rigour, reflexive critiques, and continuous challenges.
3.3 p r o p o s e d a p p r oa c h - solution
An event has sereval stages subjectable to analysis, before, during and after. To fully under-stand the role of social influence, it would be ideal to study the three moments. To perform this task, the system data acquisition component would have to be running when the event is not yet influential, weeks or months before its start. Given the potential amount of data and consequent difficult analysis, the pipeline methodology in figure 2 will be followed.
This pipeline emerged in 2012, almost a decade after CRISP–DM (Cross Industry Standard Process for Data Mining) Process.
Usually, models developed in the context of online social networks assume that people are only influenced by actions taken by their connections, such as liking or sharing. To put
3.3. Proposed Approach - solution 22
it differently, it is considered a closed world and assumed that information spreads because of informational cascades. That is why the path followed by a piece of information in the network, the diffusion or influence graph, is often referred to as the spreading cascade.
This provides knowledge about where and when a piece of information propagated but not how and why did it spread. Therefore, there is a need for models that can capture and predict the hidden mechanisms. In this scope, there are explanatory models and predictive models.
Explanatory models, static or dynamic, as the name suggests, make it possible to retrace the path taken by a piece of information and are very useful to understand how information propagated.
Predictive models aim at predicting how a specific diffusion process would unfold in a given network, from temporal and/or spatial points of view by learning from past diffu-sion traces. We classify existing models into two development axes, graph (Independent Cascades and Linear Threshold) and non-graph based approaches. While the first focus on network structure, the former do not assume the existence of a specific graph structure and have been mainly developed to model epidemiological processes. Nodes are classified into several classes or states.
Both models typologies are of interest, generating different analysis on the data previ-ously extracted from social networks and social media, but in this work there is a focus on explanatory models. From one point of view, it is useful to an organization to prepare or manage the event while it still is in progress, on the other hand, understanding how to tackle the next edition with more valuable knowledge is also essential.
What good does this work intend to bring to society? Essentially, from data analysis the main idea is to provide actionable knowledge to companies, helping in their decision making. It is intended to study the following applications: viral marketing, exploiting the word-of-mouth effect in a social network to achieve marketing objectives through self-replicating viral processes, and influence maximization, an NP-hard optimization problem. Having a more significant impact through maximizing and improving social influence an event is a obvious matter of preoccupation. More influence usually results in more profits a business has.
In a more objective application’s description, the planned computational system opti-mally results in the know-how to:
• Identify communities and infer its type and specific roles played by different users in the community;
• Customize services advertising;
• Provide accurate timing of service, based on demand;
• Identify the impact on the collaborative economy.
Of course that before being taken as ready to act on the real world it would have to be validated against data extracted from web activity and content, particularly from tourism related websites and distinct online networks. This way it is perceived if the estimated influence and, consequentially, its conclusions are precise.
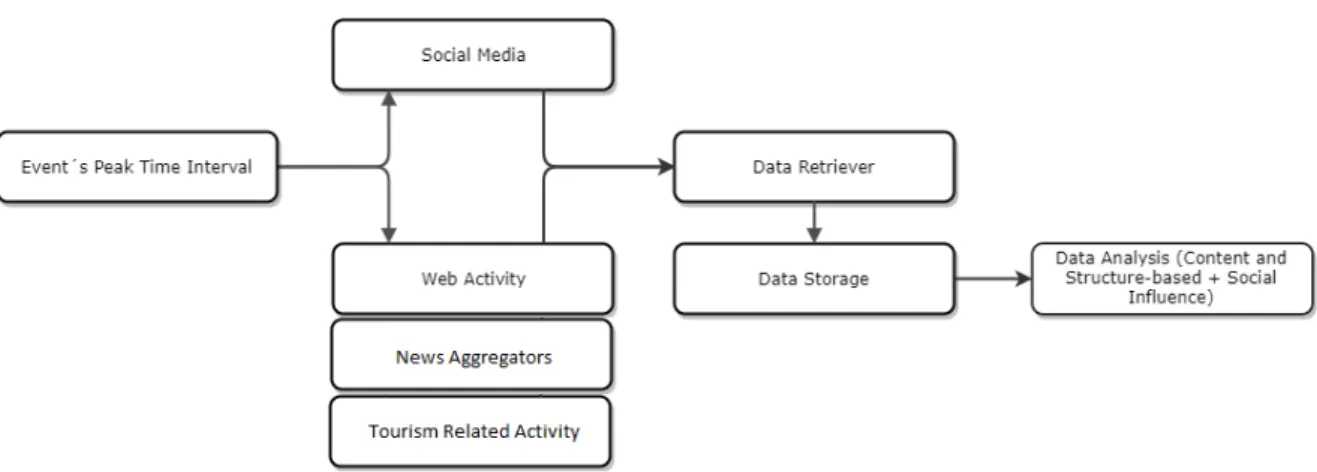
3.3.1 System Architecture
Figure 10: Proposed solution with its integrating components.
The above solution components and interaction were idealized having the following steps in consideration:
1. Determine the event’s peak time interval, searching on Google Trends by its designa-tion, in which data from online platforms will be extracted;
2. Visits to specific Wikipedia pages visits also measured, to increase the accuracy; 3. Collect information from top news aggregators (Google news and Sapo) and other
possible popular news websites: title, headline, publication date, the news outlet and its position in the ranking;
4. Analyze pattern of visits and reviews on a sample of Portuguese tourism websites, such as TripAdvisor, Expedia, Airbnb, and Booking, regarding accommodations, ac-tivities, and restaurants. Possible search by event’s location;
5. Collect patterns and numbers of searches by the event on video networks, like YouTube; 6. Extract posts geo-data, temporal data, user details, content, visualizations, reactions,
3.4. Challenges 24
and Instagram) using specific event #’s to model and measure the evolution of influ-ence in the network. This data is exported to an influinflu-ence graph representing user’s details and relations, as well as the diffusion of influence;
7. Analyze correlations between the evolution of influence on online social networks the analysis on data extracted from the other sources. It is also studied the impact on the collaborative economy;
8. From the extracted data and through its analysis discover relevant insights, conform-ing with the applications discussed in the previous section.
3.4 c h a l l e n g e s
The main challenges with the development of this work regard the data, its extractio, npro-cessing, and analysis.
Privacy preserving methods, data quality, scalability, overfitting, models’ accuracy, and assertive results are the difficulties expected to be faced and overcome.
Because of technical API limitations, there is a data acquisition bottleneck potentially responsible for missing data. To overcome this issue, if possible, one approach is to scrape data as efficiently as possible. Sampling methods that consider both network topology and users’ attributes, such as activity and localization, allows capturing information diffusion with lower error in comparison to random or activity-only based sampling.
3.5 s u m m a r y
To summarize, the most critical factor to consider is the data, every process is related to it, from extracting to analysis. Not being trivial tasks, it is mandatory to follow one or a handful of proven methodologies, as the ones presented. Thereby, some steps are always essential to adopt: acquisition, cleaning, integration, analysis and interpretation.
The objectives and hypothesis proposed in section 1.2 are feasible, quantifiable and pos-sible to conquer. If it is thoroughly followed a rethought management of data and studied works, in which their authors excelled, plus the concept this work tries to prove.
4
S O C I A L M E D I A A N D W E B C O N T E N T4.1 i n t r o d u c t i o n
Analysis refers to breaking a whole into its separate components for individual examination, therefore an interdisciplinary field. Data analysis is a process for obtaining raw data and converting it into information in an understandable manner, a structured one.
To get there, data retrieval is essential, and data is collected from a variety of distinct sources.
There has been increasing concern about privacy of individuals when it comes to social networks and general web activity. Disclosing information on the web is a voluntary act of an individual and in most cases users are unaware of who can access their data and how potentially their data will be used. Now, more than ever, personal information is requested in many daily life activities on the web. While some of this sharing is not considered dangerous, risk and many interested entities are searching to gain on its exploitation.
Because of these and in light of recent scandals regarding privacy rights, there has been a growing sensibility to the matter. Data privacy means freedom from unauthorized intru-sion, which implies techniques such as data anonymization and security against privacy breaches, from who owns the data.
That was not the case earlier this year when it was revealed Cambridge Analytica, a company that had worked on Donald Trump’s US presidential election campaign, had harvested the personal data of millions of people’s Facebook profiles without their consent and used it for political purposes. It has been described as a watershed moment in the public understanding of personal data and precipitated a massive fall in Facebook’s stock price and calls for tighter regulation of tech companies’ use of data. The scandal was significant for inciting public discussion on ethical standards for social media companies. Consumer advocates called for greater consumer protection in online media and right to privacy.
As for what scraping is concerned, from my excursions into this subject, it is a slightly grey area. Though realistically speaking, as long as ethical scraping is considered (such as not overloading the web servers with constant rapid scrape requests) or otherwise
4.1. Introduction 26
ing undue harm or business loss, that might be a low risk in general. It’s not like the information is privileged and not already out in public.
Many scrapers are written in Python language to facilitate the step of further processing the collected data. Scrapers can be written using frameworks and libraries for web crawling, such as Scrapy or Selenium. BeautifulSoup and lxml, libraries for parsing HTML(and XML) style documents and extract certain bits wanted, were also considered. All are free, but the choice fell mainly on Scrapy and occasionally the last ones. Selenium has the advantage of handling JavaScript, but it lacks speed and multifunctionality.
Scrapy is a rather big framework, it’s not necessarily hard or complicated, but sometimes a whole framework is not necessary to scrape some data. That’s where the alternative comes in, sticking with requests library to retrieve the pages and BeautifulSoup to parse those pages for bits of data needed.
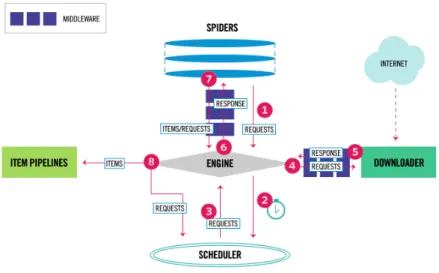
Scrapy is an open-source web-crawling framework written in Python. Initially designed for web scraping, it can also be used to extract data using APIs or as a general-purpose web crawler. Scrapy project architecture is built around ”spiders”, which are self-contained crawlers that are given a set of instructions. Following the spirit of other don’t repeat yourself frameworks, it makes it easier to build and scale large crawling projects by allowing developers to reuse their code.
Figure 11: Scrapy framework architecture,Scrapy.
It has the tools to manage every stage of a web crawl, to name a few:
• Requests manager - which is in charge of downloading pages and the great bit about it is that it does it all concurrently behind the scenes, so the user gets the speeds of concurrency without needing to invest a lot of time in concurrent architecture.
• Selectors - which is used to parse the html document to find the specific bits wanted. BeautifulSoup does the same thing, and its usage is possible instead of scrapy Selec-tors if preferred.
• Pipelines - after retrieving the data it may be passed through various pipelines which are basically bunch of functions to modify the data.
In a project created with this framework, it is also easy to define, in a settings file, user-agents, identification is a good practise, obedience to robots.txt and requests download delays (usually 5 seconds and above), to esteem the connection established.
An example of what a simple Scrapy spider looks like is presented right next:
i m p o r t s c r a p y f r o m m y p r o j e c t . i t e m s i m p o r t M y I t e m c l a s s M y S p i d e r ( s c r a p y . S p i d e r ) : n a m e = ’ e x a m p l e . com ’ a l l o w e d _ d o m a i n s = [ ’ e x a m p l e . com ’ ] def s t a r t _ r e q u e s t s ( s e l f ) : y i e l d s c r a p y . R e q u e s t ( ’ h t t p :// www . e x a m p l e . com /1. h t m l ’ , s e l f . p a r s e ) y i e l d s c r a p y . R e q u e s t ( ’ h t t p :// www . e x a m p l e . com /2. h t m l ’ , s e l f . p a r s e ) y i e l d s c r a p y . R e q u e s t ( ’ h t t p :// www . e x a m p l e . com /3. h t m l ’ , s e l f . p a r s e ) def p a r s e ( self , r e s p o n s e ) : for h3 in r e s p o n s e . x p a t h ( ’ // h3 ’ ) . e x t r a c t () : y i e l d M y I t e m ( t i t l e = h3 ) for url in r e s p o n s e . x p a t h ( ’ // a / @ h r e f ’ ) . e x t r a c t () : y i e l d s c r a p y . R e q u e s t ( url , c a l l b a c k = s e l f . p a r s e )
Right away comes to attention its ability to scrape specific pages and parse the response as conveniently as catching the content needed by XPath or CSS selectors and follow links to the next page, for example.
On the next sections each project coded or reused to extract raw data will be summarized, as well as underlying strategies adopted since there is a methodology defined for every type of data (subsection 3.3.1). There was the effort of using only free tools and trying to escape highly restricted APIs, which in few cases was not trivial.
According to the solution proposed in the previous chapters, we defined a couple of data extraction occasions, before and after the studied physical event. This away is possible a comparison of the same searches separated by distance in time. Needless to say that these processes have to be identical.