MASTERS
IN
FINANCE
M
ASTERS
’
F
INAL
W
ORK
D
ISSERTATION
HIGH
-
GROWTH FIRMS AND THEIR PROFILE CHARACTERISTICS:
E
VIDENCE FROMP
ORTUGALG
ONÇALO DED
EUSMASTERS
IN
FINANCE
M
ASTERS
’
F
INAL
W
ORK
D
ISSERTATION
HIGH
-
GROWTH FIRMS AND THEIR PROFILE CHARACTERISTICS:
E
VIDENCE FROMP
ORTUGALG
ONÇALO DED
EUSS
UPERVISION:
P
ROFESSORF
ERNANDOF
ÉLIXC
ARDOSO ISEG-
UNIVERSIDADE DE LISBOAI
ABSTRACT
The purpose of this work is to analyze the growth persistence of high-growth firms and their profile characteristics, by collecting data of all the Portuguese firms present on
Amadeus database for a ten-year period (i.e. from 2006 to 2015), We divided the
growth concept in two versions (‘employment growth firms’ and ‘turnover
high-growth firms’) to answer the question if firms that were qualified as high-high-growth firm in a
certain period of time, would be able to maintain the high growth rates for multiple periods and whether their profile characteristics would remain stable over time.
The analysis period was divided into seven sub-periods. It was noted that most companies that were classified as of high growth firms in the first period were not able to maintain this level in the following period.
II
RESUMO
O presente trabalho pretende estudar a persistência das empresas de alto crescimento e as suas características, através da recolha de todas as empresas portuguesas presentes na base de dados Amadeus, durante um período de dez anos, dividimos o conceito de empresas de elevado crescimento em empresas de elevado crescimento de volume de negócios e empresas de elevado crescimento de empregados, para responder à pergunta se as empresas assim classificadas num determinado período do tempo, seriam capazes de manter taxas de crescimento elevado para vários períodos e se as suas características permaneceriam estáveis ao longo do tempo.
O período de análise foi dividido em sete subperíodos. Notou-se que, a maioria das empresas que foram classificadas como de empresas de alto crescimento no primeiro período não foram capazes de manter este estatuto no período seguinte.
Palavras – chave: Empresas de alto crescimento; Alto crescimento; Crescimento
III
ACKNOWLEDGMENTS
I am grateful to many people for all the support, both direct and indirectly, while writing this dissertation.
First of all, I would like to thank my supervisor, Prof. Fernando Cardoso, for all the support, advice and guidance. His contributions to the development of this research, both in terms of intellectual insight and comments were essentials for the success of this paper.
Secondly, my warmest thanks to my family and closest friends for all the support, love and encouragement.
My most sincere thanks are directed to my parents and grandmother for all her help and patience since ever.
IV
LIST OF CONTENTS
ABSTRAT... I RESUMO ... II ACKNOWLEDGMENTS ... III 1. INTRODUCTION ... 1 2. LITERATURE REVIEW ... 32.1 Firm life cycle ... 5
2.2 Minimum Efficient Size ... 6
2.3 Competitive advantage and its sustainability ... 6
2.4 Gibrat’s Law ... 8
2.5 Investigation and Development ... 9
3. DATA AND RESEARCH METHOD ... 9
4. DATA ANALYSIS ... 13
4.1 Profile Characteristics ... 18
5. CONCLUSION ... 27
5.1 Future research and limitations ... 30
6. BIBLIOGRAPHY ... 32
7. APPENDIX 1 ... 34
LIST OF FIGURES
Figure 1 - Five phases of growth ... 5V
LIST OF TABLES
Table 1 - Composition of the fourteen HGF-subsets ... 13
Table 2 - Firms qualified as a HGF for one or more than three-year periods ... 14
Table 3 - Number of consecutive ‘employment HGFs’ and ‘turnover HGFs’ ... 16
Table 4 - Number of ‘fleeting HGFs’ in the subsets of ‘employment HGFs’ ... 16
Table 5 - Number of 'fleeting HGFs' in the subsets of 'turnover HGFs' ... 17
Table 6 - HGF's that returned after losing that status ... 17
Table 7 - Average age of the HGFs ... 19
Table 8 - Average size of HGFs ... 20
Table 9 - Average solvency of HGFs ... 21
Table 10 - Total average assets (in EUR)... 22
Table 11 – ‘Fleeting HGFs’ vs ‘Persistent HGFs’ ... 23
Table 12 – ‘Fleeting HGFs’ vs ‘Persistent HGFs’ ... 23
Table 13 - Sectorial distribution of 'employment HGFs' over the seven periods ... 25
1
1. INTRODUCTION
In the past years, the awareness of the importance of the high-growth firms is increasing due to their significant contribute to job creation and employment growth. High-growth firms also have a strong impact on the region or economy in which they are present. (European Commission, 2011).
Some studies have pointed that being a high-growth firm is no easy task. It appears to be quite a temporary phenomenon, something that is ephemeral. The underlying high growth rates of these firms are difficult to sustain. Garnsey et al, (2006) and Parker et al (2010) noticed that firms may show fast growth for short periods of time. However, very few are able to maintain this growth pace into the medium or long term.
This study will focus on the capability of firms to maintain their high growth rates through a medium-long period of time. Since there isn’t a perfect way to compute the growth rate of a certain firm and taking into consideration that a positive rate of growth implies a net creation of new jobs (Teruel, 2007), we will not only focus on firm’s turnover change, but also on the change in the number of employees.
Focusing on Portuguese firms and establishing a 10 year period of analysis, we will try to understand if the high-growth firms analyzed throughout this period, are able to maintain their positive high growth pace without putting aside the consistency of their profile
2
characteristics (e.g. firm size, firm age, industry, total assets, solvency). Therefore, we will try to gain a deeper insight of how long their high growth rates subsist and also, learn more about the robustness of their profile characteristics.
The definition of high-growth firms vary in many terms, from the choice of the growth indicator (sales, profits, employment), time period or the measure of the growth itself. Birch (1989) has defined the high-growth firms as firms who achieved a minimum of 20% sales growth per year over the period of analysis, starting from a base-year revenue of at least $100,000. This minimum star-size of $100,000 was established in order to avoid arithmetic errors that could result when computing the growth from a very small base. This definition includes also the growth rate and the sales as a measure of growth as mentioned before. Storey (1987), has an alternative approach. He defines HGFs1 as either the N fastest growing (new) firms or the X% fastest growing (new) firms. Regarding Gazelles - the subset of high-growth firms, with a life-time up to five years old, - the definition consists on all enterprises up to 5 years old with average annualized growth greater than 20% per annum, over a three year period. (OECD, 2011).
As mentioned before, only a very small number of high-growth firms are able to hold their strong growth rates for a long time period, therefore, this type of firms, classified as HGFs should be aware of the fact that their majority can only remain with such classification for a relatively short period.
3
This study will proceed as following: in first place; we will take a look on the length of the high-growth period. Secondly, we will provide, analyze and describe the database and the research method. Thirdly, we will be analyzing the persistence of the high-growth singularity for the HGFs analyzed with conclusions being exposed. Fourthly, the different profile characteristics of the firms are compared throughout the seven periods.
2. LITERATURE REVIEW
There are many concepts that can be linked to the persistence of high business growth. For now, we will discuss the life cycle theory of firms, taking into consideration the following concepts: life cycle, minimum efficient size (MES2), competitive advantage, sustained
competitive advantage and Gibrat’s law.
Penrose (1959), provides a few principles regarding the growth of firms and the rate at which firms can grow efficiently. However, we will now focus on his contribution to the theory of the process of firm growth. He provides also a theory of effective management of firm’s resources, productive opportunities, and diversification strategy. Thus, providing an explanatory logic to unravel causal links among resources, capabilities, and competitive advantage, resulting in a resource-based theory of competitive advantage. According to Yasemin & Mahoney (2004), Penrose (1959) has at least three key arguments concerning linkages among firm’s resources, productive opportunities, and profitable firm growth.
4
I. ‘Penrose (1959) maintains that firms can create economic value not due to mere
possession of resources, but due to effective and innovative management of resources’
In Yasemin & Mahoney (2004), p.184.
II. Penrose (1959) provides links between resources and the creation of productive opportunities for growth, innovation and job creation.
‘The experience of managers with each other and other resources in the firm affects their image of the unique productive opportunities available for their firms. Managers function as a catalyst in the conversion of firm’s resources into firm capabilities and new product applications. In the spirit of dynamic capabilities, new combinations of resources lead to innovation and economic value creation’.
In Yasemin & Mahoney (2004), p.184.
III. ‘Penrose (1959) explains the drivers of the rate and direction of firm growth. The
availability of top managerial and technical talent serves as the bottleneck for a firm’s growth rate in a particular period of time. The current knowledge bases and underutilized resources of the firm determine the direction of firm growth. Penrose (1959) not only articulates why and how these drivers shape the rate and direction of growth, but also argues that ignorance of these limiting factors results in inefficiencies and loss of competitive advantage’.
5
2.1 Firm life cycle
Regarding the life cycle theory of a company, business growth is a concept that can be considered a natural process where every company will have to pass through (Greiner, 1972). The firm’s growth starts with the birth and it could be prolonged to maturity. Each phase can be characterized by priorities, configuration issues and strategies.
A firm goes through five phases of growth, (Greiner, 1972) different stages of evolution and revolution and where each phase is at once a result of the previous phase and a cause for the next phase.
Figure 1 - Five phases of growth
Source: Greiner (1972), p. 05.
‘For each phase, managers are limited in what they can do if growth is to occur. For example, a company experiencing an autonomy crisis in Phase 2 cannot return to directive management for a solution; it must adopt a new style – delegation - in order to move forward.’
6
2.2 Minimum Efficient Size
According to Lipczynski et al (2005), the firm’s ability to live longer depends on their aptitude to achieve the minimum efficient scale or minimum efficient size (MES). Almus (2002) defined the minimum efficient size as a certain threshold that newly founded firms should reach if they pretend to live longer in their sector.
Small firms that are not able to achieve the minimum efficient size tend to exit, therefore, that higher growth may occur among the surviving firms when they are determined to reach the minimum efficient size (Lipczynski et al, 2005). The minimum efficient scale varies strongly per sector, if the minimum efficient size is small compared to total market size many firms are able to coexist in the same space. On the other hand if the minimum efficient size is large due to the high ratio of fixed and variable costs, only few major firms will be able to dominate the space in these types of industries.
Firms that are active in sectors characterized by a high minimum efficient size will have a higher tendency to grow faster (Almus, 2002).
2.3 Competitive advantage and its sustainability
From Ansoff (1965) to Michael Porter (1985), sustained competitive advantages have been a great area of research in the field of strategic management.
7
‘Firms obtain sustained competitive advantage by implementing strategies that exploit
their internal strengths, through responding to environmental opportunities, while neutralizing external threats and avoiding internal weaknesses’.
In Barney (1991), p. 283. A firm has a sustained competitive advantage when it is able to implement a value creating strategy that is not implemented simultaneously by any other potential competitor and when these competitors are unable to copy the benefits of such strategy. Therefore, in order to obtain sustained competitive advantage a firm has to be valuable and rare among the competitors and the resources should be hard to imitate and substitute. A strategically equivalent resource could contribute for a potential sustained competitive advantage. Competitive advantage’s sustainability success depends upon the possibility of competitor duplication. Even though that the sustained competitive advantage may last a long period of calendar time, is the inability of strategy recreation by the competitors that makes a competitive advantage sustained.
The extreme growth rates that identify a high-growth firm can be linked to a certain competitive advantage that favors this growth.
The difference between these two concepts (i.e. competitive advantage and sustained competitive advantage) is easily identified by a single word - persistence – it is the persistence of a high-growth firm that will turn a competitive advantage into a sustained competitive advantage. Thus, the longer the HGF-status is kept, more likely they are to have a sustained competitive advantage that will not fade away by possible duplication
8
efforts of competing firms. Achieving a sustained competitive advantage is far more difficult than achieving a competitive advantage, as mentioned before; the resources that are at the basis of the sustained competitive advantage must be valuable, rare, imperfectly imitable and not easily substitutable by the competitor and potential competitors (Barney, 1991). Maintaining the high-growth status for a long time is a difficult task for a large part of the high-growth firms, consequently, we can assume that, the number of ‘fleeting
HGFs’, (firms that are only a high-growth firm for a short period of time) is much higher
than the number of firms that retain high growth rates for a long period of time, since moving from a competitive advantage to a sustained competitive advantage is something that is only achievable by a very small group of companies.
2.4 Gibrat’s Law
According to Gibrat (1931), in one of the first studies regarding firm’s size, the firm’s growth rate is independent of its absolute size. As expected, after the publication of Gibrat’s book, different studies tried to test the law empirically, Sutton (1997) reviewed Gibrat’s law and raise some questions related with the way in which the size distribution of surviving firms evolve: Could there be any tendency for the bigger firms to converge in size? Do the larger firms shrink proportionally faster, so that the firm size distribution becomes less skew? (Sutton, 1997)
Throughout the years, many studies of this kind casted a doubt regarding Gibrat’s law -growth rates were independent of firms size - Kumar (1985) stated that smaller firms seem to grow faster than large firms, on the other hand some earlier studies reported that larger firms tend to grow faster (Samuels 1965; Prais 1976).
9
‘This latter tendency in part reflects the greater role played by growth through acquisition
among larger firms.’
In John Sutton (1997), p. 44.
2.5 Investigation and Development
Veloso (2014) stated that the growth of HGF has to be reinforced by more financial support than the other companies, in a conjuncture that closes the door to financing, maintaining the high growth rates become more difficult.
The HGFs, in the business community, are the ones that invest more in investigation and development (I&D3). According to Ana Silva (2014), Portuguese HGFs spent in 2012 around 25.000 euros per firm, while the non HFG spent 2.500 euros. Veloso (2014) subscribed that the high growth firms have a far more interesting level of investigation and development than other firms. High-growth firms showed a level of investment in innovation and development way above the total of the business community, having spent more than 25 thousand euros, in contrast, gazelles presented an investment far reduced.
3. DATA AND RESEARCH METHOD
To make this research, all the data obtained in Amadeus - a database composed by public and private companies across the Europe - was computed for all the firms that were active in Portugal in the period of 2006-2015. Hence, comparable financial information over a
10
decade is available for almost 6000 firms, making a longitudinal approach possible. With this database we were able to obtain many items such as industry sector, number of employees and turnover. In our study we’ve selected only those firms for which all of the necessary data was available. The OECD-definition of high-growth firm will be used as a guideline, and according to it, a high-growth firm is a firm:
‘That experiences annualized growth rates in employees or turnover greater than 20 percent per annum over a three year period with a minimum of 10 employees at the beginning of the study period’.
In Eurostat – OECD (2007), p. 61.
With the above definition, and in order to reduce the weight of small firms in the high-growth firms group - avoiding their dominance - a minimum employee size is imposed of ten employees in the first year of the analyzed period. The average growth rate is set on 20% and has to be reviewed along the entire period of time. This implies that the business must grow at least 20% in each of the three years.
According to the OECD-definition, a high-growth firm could be identified between two growth measures, (i.e. employment and turnover), in this study we will use both of them, and compare how many firms could fit in both subsets.
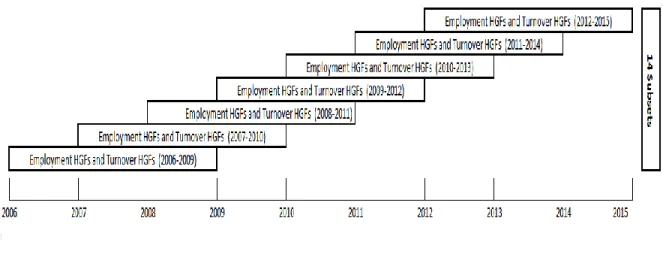
The firm’s data obtain was used for a ten-year period (i.e. from 2006 to 2015), seven overlapping three-year periods can be identified (i.e. Figure 2). Furthermore, and as mentioned before, two types of HGFs will be analyzed for each period, namely
11
‘employment HGFs’ and ‘Turnover HGFs’. ‘Employment HGFs’ are the firms that have realized an annual employee growth of at least 20 percent for a three-year period, whereas ‘Turnover HGFs’ are those who have obtained an annual growth in their turnover of at least 20 percent for a three-year period, respecting the OECD definition. A total of 14 HGF-subsets were created (i.e. seven HGF-subsets of ‘employment HGFs’ and seven HGF-subsets of ‘turnover HGFs’). The schematic overview is presented in figure 2.
Figure 2 - Schematic overview of the adopted approach
Source: Author
Regarding the research topics, we will be analyzing at the first place the overlap between the seven different high growth subsets for those related with the employment and the turnover, which, will provide a deeper insight of the singularity of HGF’s growth persistence. Secondly, we will be analyzing their profile characteristics namely, firm age, size and its industry for the fourteen high-growth subsets and a comparison will be made between them, in order to know if these characteristics are stable over time. We will also
12
compare ‘employment HGFs’ and ‘Turnover HGFs’ with the intention to find differences or similarities between them.
In Table 1, we are able to identify the absolute and relative number of HGFs in the pre-defined 14 subsets. After obtaining approximately 6 000 Portuguese firms without excluding any NACE-sections but setting the minimum employee size of ten employees in the first year of the analyzed period, an absolute number of firms ranging from 1 133 (in the period 2006-2009) to 1 378 (in the period 2012-2015) is obtained. Taking into consideration the OECD-definition for high-growth firm for the seven overlapping three-year periods, approximately 2% were ‘employment HGFs’, if we consider all the periods, the relative number ranged from 1,85% in the period 2006-2009 to 1.23% for the period 2012-2015 was found after the application after the OCDE definition. Regarding to the ‘Turnover HGFs’, a minimum percentage of 3.88% (for the period 2006-2009) and a maximum percentage of 4.29% (for the period 2009-2012) was encountered. Hence, it appears that the number of ‘turnover HGFs’ is approximately twice as high as the number of ‘employment HGFs’ with the exception of the two overlapping periods from 2010-2014 and also 2007-2008. A possible explanation for the lower number in this period may be related with the fact that this period was more affected by the financial and economic crisis. The overlap between the two HGF-categories is represented in the column six ‘Absolute
number of firms that are in both HGF-subsets’. Here, we can see that only few firms were
able to fit in the ‘employment HGFs’ and ‘turnover HGFs’ in the same period, reaching the maximum of 3 firms, for instance, in the last period analyzed (i.e. 2006-2009) only 3 of the 44 ‘turnover HGFs’ were also ‘employment HGFs’.
13 Table 1 - Composition of the fourteen HGF-subsets
Source: Author
4. DATA ANALYSIS
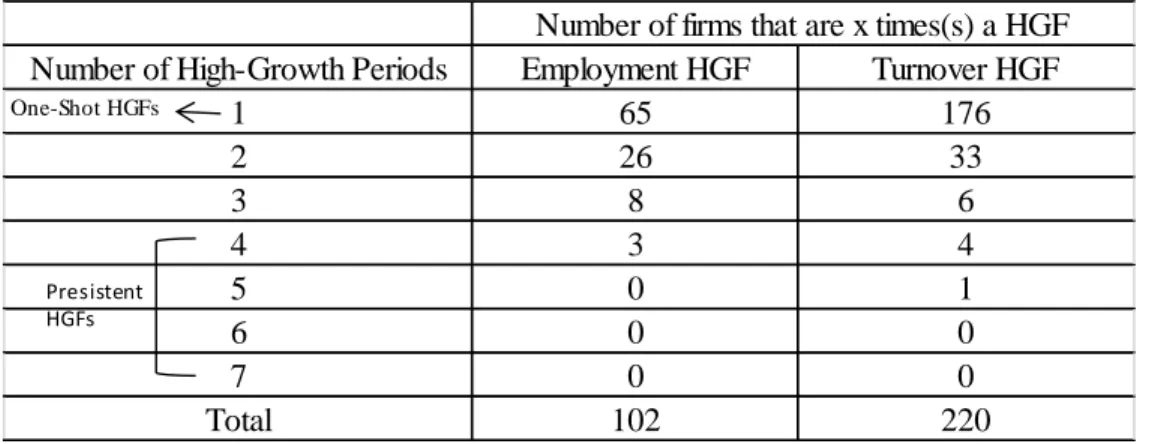
Based on the earlier mentioned considerations, manage to maintain the high-growth firm status is something that can only be achieved by a very small group, the majority of those who can, are only able to maintain the high-growth rates for a short period of time. The identification of the seven (overlapping) high-growth firm subsets offers the opportunity to learn more about the persistence of high business growth. As per the following table (i.e. Table 2), we are able to overview the number of firms that could be identified as a high-growth firm in only one of the three-year period, or more than one period. Therefore, we have conclude that 102 different firms could be classified as an ‘employment high-growth
firm’ in one or more of the seven periods and 220 different firms were identified as a ‘turnover high-growth firm’ in one or more of the seven periods. Regarding the ‘turnover high-growth firms’ 176 out of 220 were only a high-growth firm for one period, on the
other hand and with respect to the ‘employment high-growth firms’, 63.73% were ‘fleeting 2006-2009 21 1,85% 44 3,88% 3 2007-2010 22 1,82% 43 3,56% 2 2008-2011 22 1,75% 33 2,63% 1 2009-2012 17 1,33% 55 4,29% 3 2010-2013 26 1,98% 26 1,98% 2 2011-2014 28 2,11% 29 2,18% 3 2012-2015 17 1,23% 51 3,70% 3
Absolute number of firms that are in both HGF-subsets
Period Absolute number Employment HGFs (7 subsets) Relative number Turnover HGFs (7 subsets) Absolute number Relative number
14
high-growth firms’ (i.e. 65 of the 120 firms) meaning that they could only maintain this
status for only one period. A ‘fleeting high-growth firm’ is subsequently a firm that is only an ‘employment high-growth firm’ or ‘turnover high-growth firm’ in one of the seven overlapping periods. Hence, it appears that more than half of the firms that were qualified as a high-growth firm between 2006 and 2015 could only hold this status for one three-year period. Furthermore, only a very small number of firms were able to be a high-growth in four periods and none of them were able to maintain this status for more than 5 periods.
Only one firm was able to be classified as high-growth firm in 5 periods for the ‘Turnover’ category. Only 3 firms were able be classified as a HGF in four periods out of the seven overlapping periods for the ‘employment high-growth firms’ category (i.e.3%) and 5 in the ‘turnover high-growth firms’ subset (i.e. 2.3%), therefore we will recognize them as
‘persistent high-growth firms’. Hence, it also appears that it is easier – or better stated, less
difficult – for the ‘turnover HGFs’ to become ‘persistent’.
Table 2 - Firms qualified as a HGF for one or more than three-year periods
Source: Author
Number of High-Growth Periods 1 2 3 4 5 6 7 Total
Number of firms that are x times(s) a HGF 176 65 Employment HGF Turnover HGF 26 8 33 6 4 1 0 0 220 3 0 0 0 102 One-Shot HGFs Presistent HGFs
15
The following table (i.e. Table 3) shows the number of firms that have been classified as an
‘employment HGF’ or ‘turnover HGF’ in the first analyzed period and the number of firms
of this initial group that were able to maintain the HGF status, for the following three-year period(s). Therefore, regarding ‘employment HGFs’ 10 of the 21 firms analyzed in the first period (i.e. 2006-2009) maintained that status in the following period (i.e. 2007-2010) representing 47,62% of the initial firms. Moving to the next overlap period, 2 of the initial 21 firms could retain the HGF-status concerning the employment for three consecutive overlapping periods (i.e. 9,52%). The tendency found for ‘turnover HGFs’ decayed more drastically - in comparison with the subset of ‘employment HGFs’ - from the first period to the second one, with an initial group of 44 firms of which 17 firms were still a ‘turnover
HGF’ in the following period (i.e. 38,64%).
Five of the initial 44 ‘turnover HGFs’ retained their HGF-status for three consecutive periods (i.e. 11,36%), and only one was able to sustain this status for five consecutive periods.
‘Turnover HGFs’ could maintain the HGF status for a maximum of 5 consecutive periods,
whereas ‘employment HGFs’ could only conserve it for 3 consecutive periods.
It is once again proved that ‘turnover HGFs’ appear to be more persistent than ‘employment
16
Table 3 - Number of consecutive ‘employment HGFs’ and ‘turnover HGFs’
Source: Author
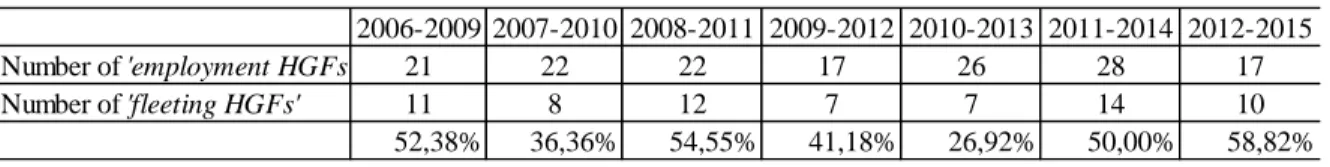
The following table (i.e. Table 4) shows the number of firms that were an ‘employment
HGF’ in just one of the seven periods and were not able to be qualified as a HGF on other
periods. For instance, 11 of the 21 ‘employment HGFs’ for the period 2006-2009, they could only held this status in this specific period (i.e. 52,38%). The quantity of ‘fleeting
HGFs’ throughout the periods (e.g. in percentages) must be highlighted. For the period
2012-2015 nearly 58,82% of the ‘employment HGFs’ were ‘fleeting HGFs’, whereas only 26,92% ‘fleeting HGFs’ were reported for the subset of the period 2010-2013.
Table 4 - Number of ‘fleeting HGFs’ in the subsets of ‘employment HGFs’
Source: Author
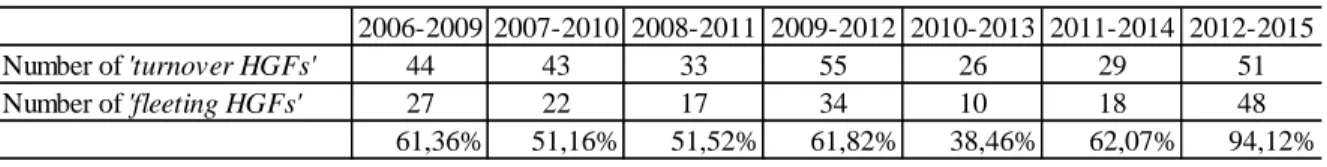
On the following table the scenario is quite similar with the previous one. However, here (i.e. Table 5), the weight of the ‘fleeting HGFs’ is quite higher, with special enhance for the period of 2012-2015, where 48 out of 51 'turnover HGFs’ were 'fleeting HGFs'. On the other hand, the period 2010-2013 was the period that registered the minimum weight of
'fleeting HGFs' in the ‘employment HGFs’ and 'turnover HGFs’ categories.
2006-2009 2007-2010 2008-2011 2009-2012 2010-2013 2011-2014 2012-2015 Employment HGFs 21 10 2 0 0 0 0 Turnover HGFs 44 17 5 4 1 0 0 2006-2009 2007-2010 2008-2011 2009-2012 2010-2013 2011-2014 2012-2015 21 22 22 17 26 28 17 11 8 12 7 7 14 10 52,38% 36,36% 54,55% 41,18% 26,92% 50,00% 58,82% Number of 'fleeting HGFs' Number of 'employment HGFs'
17
Table 5 - Number of 'fleeting HGFs' in the subsets of 'turnover HGFs'
Source: Author
According to what has been demonstrated before, only few high-growth firms are able to maintain the desired high growth rates for a long period of time. Therefore, the succeeding table will show the number of HGFs that lost their status, considering that they were once an ‘employment high-growth firm’ or ‘turnover high-growth firm’ in the period 2006-2009 but were able to reconquer this status in other periods.
We were able to identify that, regarding the ‘employment high-growth firms’, 11 out of 21 firms that were identified as a HGF in the period 2006-2009, lost their status in the period after, for the ‘turnover high-growth firm’ 27 out of 44 lost the status in the same period (i.e. 2007-2010).
The analysis and conclusion on the following table are pretty easy to obtain, none of the firms that lost their status in the period 2006-2009 could ever regained in later years.
Table 6 - HGF's that returned after losing that status
Employment HGFs Turnover HGFs
Lost HGF status (2007-2010) 11 27
Period Nr of firms that re-obtained their HFG status
2008-2011 0 0 2009-2012 0 0 2010-2013 0 0 2011-2014 0 0 2012-2015 0 0 Total 0 0% 0 0% Source: Author 2006-2009 2007-2010 2008-2011 2009-2012 2010-2013 2011-2014 2012-2015 44 43 33 55 26 29 51 27 22 17 34 10 18 48 61,36% 51,16% 51,52% 61,82% 38,46% 62,07% 94,12% Number of 'turnover HGFs' Number of 'fleeting HGFs'
18
As we advance on the study, and after learning more about the persistence of the HGFs, we will now approach their ‘robustness’. Given two different high-growth firm subsets (i.e. ‘turnover high-growth firm’ and ‘employment high-growth firm’) we will now compare their profile features. Thus, we will analyze if the profile characteristics of each high-growth subset are consistent and stable over the 7 periods. Hence, we will analyze for each period, the average firm age, size, amount of total assets, solvency and the sectoral distribution for either the ‘turnover high-growth firms’ and ‘employment high-growth
firms’.
4.1 Profile Characteristics
Firm Age
In Table 7, it is possible to identify the average high-growth firm age for the seven periods for each growth categories (i.e. ‘turnover growth firms’ and ‘employment
high-growth firms’). Thus, for the ‘employment high-high-growth firms’ the minimum average HGF
age obtained was 6.4 average years in the period 2009-2012, while its maximum was register in 2012-2015 with 7.8 average years. On the other hand with the respect to the ‘turnover high-growth firms’, which comparing with the other category are slightly older on average, they have reached the minimum average age in 2011-2014, while its maximum was register in 2006-2009 with 7.3 average years. Thus, the conclusion is supported by the Portuguese Central Bank that has mentioned in a recent research (Estudos da Central de Balanços, 2013) that Portuguese high-growth firms are usually young firms. As an overall view average high-growth firm age remains quite stable over seven periods analyzed since neither one of them reached 8 year old.
19 Table 7 - Average age of the HGFs
Source: Author
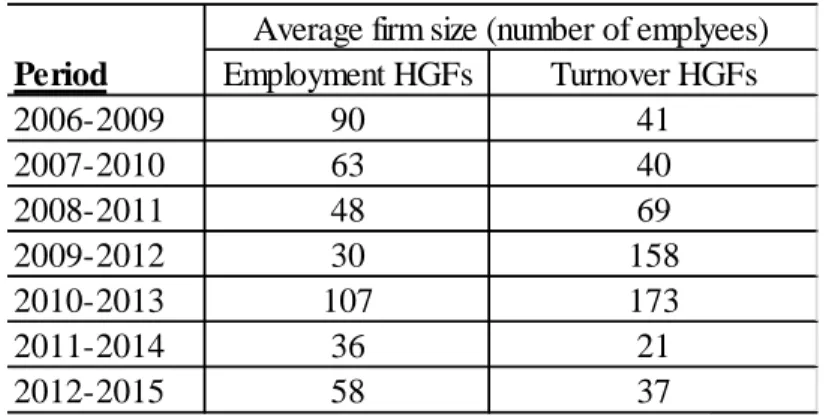
Firm Size
The next table measures the average size of the two different categories – measuring the number of the employees in units – throughout the 14 subsets, the average size of the
‘employment high-growth firms’ has fluctuated between 30 and 107 employees, reaching its
higher value in 2010-2013, whereas the average size of the ‘turnover high-growth firms’ ranged from 21 in 2011-2014 to 173 employees in 2010-2013. ‘employment high-growth
firms’ had a better start, having more employees on the first 2 periods. However, after those
periods the results became quite unstable, having the ‘turnover HGFs’ more employees in some periods and the ‘employment HFGs’ in others.
Hence, it seems that there’s no significant difference between the ‘turnover high-growth
firms’ and ‘employment high-growth firms’ that could lead us to conclude that one of the
categories is bigger – in terms of employees – than the other.
2006-2009 2007-2010 2008-2011 2009-2012 2010-2013 2011-2014 2012-2015 6,7 6,5 7,2 6,5 6,8 7,6 6,4 7,3 7,5 7,8
Period Employment HGFs Turnover HGFs
Average firm age (years) 7,1
6,8
7,3 6,6
20 Table 8 - Average size of HGFs
Source: Author
Firm Solvency
In the following table we are able to overview the solvency of the high-growth firms in the
‘employment’ and ‘turnover’ categories, the results encountered remained relatively stable
over the analyzed decade without any significant difference to register, the average solvency ratios vary from 15.73% to 38.86% for the ‘employment HGFs’. Regarding the
‘turnover HGFs, it follows the same analysis of the previous HFG category, there’s no
significant difference throughout the periods. The average solvency of the ‘turnover’ category varies from 12.50% to 24.81%.
Comparing both high-growth firm categories we concluded that the average solvency is lower in the ‘turnover high-growth firms’ category.
2006-2009 2007-2010 2008-2011 2009-2012 2010-2013 2011-2014 2012-2015 107 173 36 21 58 37 63 40 48 69 30 158 Period
Average firm size (number of emplyees)
Employment HGFs Turnover HGFs
21 Table 9 - Average solvency of HGFs
Source: Author
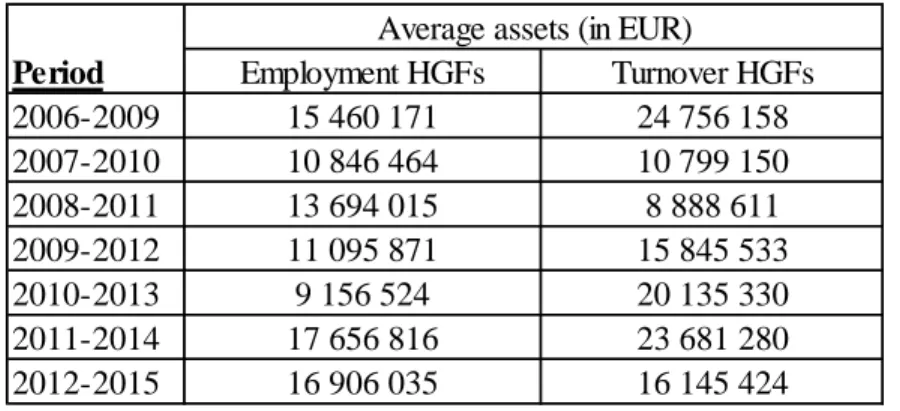
Firm Total Assets
The below table (i.e. Table 10), shows that the ‘turnover HGFs’ have a significantly higher average total amount of assets in most of the periods than the ‘employment high-growth
firms’.
Comparing both of categories, the average total assets varies roughly from 9 000 000 EUR to 17 000 000 EUR for ‘employment HGFs’, while ‘turnover HGFs’, varies roughly from 9 000 000 EUR to 25 000 000 EUR. Therefore, and putting aside the two and three anomalous results for ‘employment HGFs’ and ‘value-added HGFs’ respectively, it seems that the variations remain fairly stable for both categories throughout the 7 periods.
2006-2009 2007-2010 2008-2011 2009-2012 2010-2013 2011-2014 2012-2015 Period
Solvency (asset based %)
Employment HGFs Turnover HGFs 30,27 19,27 38,86 24,81 26,86 15,14 30,18 16,19 24,28 12,50 15,73 15,85 20,08 18,03
22 Table 10 - Total average assets (in EUR)
Source: Author
‘Fleeting high-growth firms’ and ‘Persistent high-growth firms’
For the following tables (i.e. Table 11 and Table 12) the profile characteristics of ‘Fleeting
'employment HGF’ and ‘persistent employment HGF’ will be compared. This comparison
will be made on between subsets with different size, where 65 ‘fleeting employment HGFs’ will be compared with 3 ‘persistent employment HGFs’ and 176 ‘Fleeting turnover HGFs’ with 5 ‘persistent turnover HGFs’ . As mentioned before, ‘fleeting HGFs’ are those who are only able to reach high-growth rates for one period, whereas ‘persistent HGFs’ can maintain the HGF status for more than 3 periods.
Regarding the age, ‘persistent HGFs’ seem to be slightly older than ‘fleeting HGFs’, given the fact that they are older than the ‘fleeting HGFs’ we would expect that their size would also be bigger, however, ‘fleeting HGFs’ are on average larger than the ‘persistent HGFs’. For the total assets, in the 'employment HGF’ category a few differences were found, the
‘fleeting employment HGFs’ have on average four times more assets than the ‘persistent
2006-2009 2007-2010 2008-2011 2009-2012 2010-2013 2011-2014 2012-2015 Period
Average assets (in EUR)
Employment HGFs Turnover HGFs 15 460 171 24 756 158 10 846 464 10 799 150 13 694 015 8 888 611 11 095 871 15 845 533 9 156 524 20 135 330 17 656 816 23 681 280 16 906 035 16 145 424
23
employment HGFs’, on the other hand, for the turnover category the ‘persistent HGFs’
have on average more assets than the ‘fleeting HGFs’.
It appears that the differences between fleeting and persistent high-growth firms are greater on the category 'employment high-growth firms' than the category 'turnover high-growth
firms'.
Table 11 – ‘Fleeting HGFs’ vs ‘Persistent HGFs’
Source: Author
Table 12 – ‘Fleeting HGFs’ vs ‘Persistent HGFs’
Source: Author
Quantity 65 firms 3 firms
Average firm age 8,3 years 8,7 years
Average firm size 109 employees 48 employees
Average total assets 18 649 294 EUR 4 244 536 EUR
Average solvency 26,96% 16,44%
Fleeting 'employment high-growth firm'
Persistent 'employment high-growth firm'
Quantity 176 5 firms
Average firm age 7,4 years 9 years
Average firm size 88 employees 73 employees
Average total assets 13 040 734 EUR 13 100 00
Average solvency 21,36% 14,63%
Fleeting 'turnover high-growth firm'
Persistent 'turnover high-growth firm'
24 High-growth firms sectorial distribution
The following table (i.e. Table 13) demonstrates the HGF’s sectoral distribution over the seven periods analyzed on all the NACE sections. Included in the appendix is the table with all sections (i.e. NACE-BEL 2008).
Comparing both categories (i.e. employment and turnover), both share a relatively common distribution over the sectors throughout the seven periods, the Manufacturing, Wholesale and retail trade dominate the Portuguese economic activity sectors.
Nevertheless, besides the domination of Manufacturing and retail trade sectors for either
‘employment high-growth firms’ or ‘turnover high-growth firms’ if we extend the sectors
for the top 5 we are able to identify some differences. Thus, regarding ‘employment
high-growth firms’ some sectors – with a smallest weight – should be highlighted, therefore,
putting aside the dominating sectors, activities related with transporting and storage, information and communication, and also, on the same level, the traditional Portuguese economic activities, like fishing, agriculture and forestry complete the top 5 with Manufacturing and Wholesale and retail trade.
25
Table 13 - Sectorial distribution of 'employment HGFs' over the seven periods
NACE-section 2006-2009 2007-2010 2008-2011 2009-2012 2010-2013 2011-2014 2012-2015 A 4,76% 4,55% 4,55% 5,88% 7,69% 3,57% 5,88% B 0,00% 0,00% 0,00% 0,00% 0,00% 0,00% 0,00% C 14,29% 18,18% 13,64% 5,88% 15,38% 14,29% 11,76% D 0,00% 0,00% 0,00% 0,00% 0,00% 0,00% 0,00% E 0,00% 0,00% 0,00% 0,00% 3,85% 3,57% 0,00% F 4,76% 0,00% 4,55% 5,88% 7,69% 0,00% 0,00% G 38,10% 40,91% 22,73% 47,06% 34,62% 35,71% 41,18% H 4,76% 4,55% 9,09% 5,88% 19,23% 14,29% 17,65% I 0,00% 0,00% 0,00% 5,88% 0,00% 0,00% 5,88% J 4,76% 4,55% 9,09% 5,88% 3,85% 14,29% 5,88% K 4,76% 4,55% 9,09% 0,00% 0,00% 3,57% 0,00% L 0,00% 0,00% 9,09% 5,88% 0,00% 0,00% 0,00% M 9,52% 9,09% 4,55% 0,00% 3,85% 7,14% 5,88% N 4,76% 4,55% 9,09% 5,88% 3,85% 3,57% 5,88% O 0,00% 0,00% 0,00% 0,00% 0,00% 0,00% 0,00% P 4,76% 4,55% 0,00% 0,00% 0,00% 0,00% 0,00% Q 4,76% 0,00% 0,00% 0,00% 0,00% 0,00% 0,00% R 0,00% 4,55% 4,55% 5,88% 0,00% 0,00% 0,00% S 0,00% 0,00% 0,00% 0,00% 0,00% 0,00% 0,00% T 0,00% 0,00% 0,00% 0,00% 0,00% 0,00% 0,00% U 0,00% 0,00% 0,00% 0,00% 0,00% 0,00% 0,00% Source: Author
On the other hand and moving now to ‘turnover HGFs’ sectorial distribution, the administrative and support service activities have also a significant weight throughout the seven periods paired with information and communication.
In this category (i.e. ‘turnover HGFs) the activity sector of the HGFs shows that the weight of the Contruction sector has been decreasing since the period 2007-2010 until 2011-2014 (i.e. aprox. 13%) returning in the last period with a weight of 1,96%.
26
Table 14 - Sectorial distribution of 'turnover HGFs' over the seven periods
NACE-section 2006-2009 2007-2010 2008-2011 2009-2012 2010-2013 2011-2014 2012-2015 A 2,27% 6,98% 3,03% 1,82% 0,00% 0,00% 1,96% B 0,00% 0,00% 0,00% 1,82% 0,00% 0,00% 0,00% C 9,09% 11,63% 15,15% 18,18% 15,38% 3,45% 23,53% D 2,27% 0,00% 0,00% 3,64% 3,85% 3,45% 3,92% E 2,27% 2,33% 3,03% 0,00% 0,00% 0,00% 1,96% F 4,55% 6,98% 3,03% 1,82% 0,00% 0,00% 0,00% G 40,91% 32,56% 21,21% 32,73% 42,31% 58,62% 29,41% H 0,00% 0,00% 0,00% 1,82% 3,85% 3,45% 3,92% I 0,00% 0,00% 0,00% 1,82% 0,00% 0,00% 0,00% J 9,09% 6,98% 9,09% 7,27% 15,38% 6,90% 9,80% K 2,27% 2,33% 3,03% 3,64% 7,69% 3,45% 5,88% L 2,27% 4,65% 6,06% 0,00% 0,00% 0,00% 7,84% M 13,64% 6,98% 12,12% 10,91% 3,85% 6,90% 5,88% N 9,09% 13,95% 12,12% 10,91% 7,69% 10,34% 5,88% O 0,00% 0,00% 0,00% 0,00% 0,00% 0,00% 0,00% P 0,00% 0,00% 0,00% 0,00% 0,00% 0,00% 0,00% Q 0,00% 0,00% 6,06% 1,82% 0,00% 0,00% 0,00% R 2,27% 4,65% 3,03% 1,82% 0,00% 0,00% 0,00% S 0,00% 0,00% 3,03% 0,00% 0,00% 3,45% 0,00% T 0,00% 0,00% 0,00% 0,00% 0,00% 0,00% 0,00% U 0,00% 0,00% 0,00% 0,00% 0,00% 0,00% 0,00% Source: Author
27
5. CONCLUSION
From all of the high-growth firms identified, more than 50% of them were only able to maintain the status of a high-growth firm for only one period of three years.
Maintaining the high-growth status is no easy task, being a transitory phase on the life cycle of the Portuguese firms. Between 2006 and 2015 were identified 102 high-growth firms for the category of employment and 220 for the turnover category. However, only a very small portion of firms achieved the HGF status for more than 3 periods over the seven periods. The number of fleeting growth firms is far higher than the number of persistent high-growth firms, this temporary high-high-growth phenomenon could be related with the below notions and concepts that have been mentioned before in this study.
1) With Gibrat’s law, we have learned that growth rates are independent of firms size, this statement could be supported by the fact that Portuguese ‘persistent high-growth firms’ had less employees than the high-growth firms that could only retain this status for only one period.
2) The difference that relays on competitive advantage and a sustained competitive advantage could explain the small number of ‘persistent high-growth firms’ once being able to obtain a sustained competitive advantage is considered to be achievable by only a very limited number of firms. A firm has a sustained competitive advantage when it is able to implement a value creating strategy that is not implemented simultaneously by any other potential competitor and when these competitors are unable to duplicate the benefits of such strategy. Consequently, the amount of firms that are only a
high-28
growth firm for a short period of time is much higher than the amount of persistent HGFs (firms that retain high growth rates for a long period of time), once moving from a competitive advantage to a sustained competitive advantage is something that is only achievable by a very small group of companies.
3) Regarding the life cycle of a firm and its theory – that defends that the high-growth may occur in one of the earlier phases and that growth is an inherit firm process - the temporary high-growth that a firm conquers while growing, could temporary be explained by this theory.
4) Following the minimum size effect concept that according to Lipezynsky et al (2005), in order for a firm to survive longer in a certain sector they depend on their ability to achieve the minimum efficient scale also known as a minimum size. Temporary high-growth could be explained by the fact that some of these firms may try to obtain this size as fast as possible in order to survive in the sector. However, once this size is reached their growth intentions may fade away, leading to a lower number of ‘persistent HGFs’ – or better stated – a high number of firms that can only retain the high growth rate for a short period of time.
Supported by the minimum size effect concept, the life cycle of a firm, Gibrat’s law and the concepts of competitive advantage and a sustained competitive advantage we can conclude that high firm growth is an ephemeral phase, which is supported by the difference that we have come across regarding the much higher number of fleeting high-growth firms compared with the number of HGFs that could maintain the status for more than three periods.
29
As mentioned early on it is to bear in mind that the most of the firms that were once a qualified as a high-growth firm at a certain moment in time will only remain as such for a relatively short period.
With respect to ‘fleeting high-growth firms’ and ‘persistent high growth firms’, considering their differences regarding their profile characteristics, focusing on the ‘persistent high-growth firms’ would be useful in order to give new perceptions of high-high-growth since these type of firms have proven to be capable of sustaining high growth rates for long periods of time.
Taking into consideration their high-growth rates, for an academic point of view, these firms could be more suitable for case studies that have the aim to study the factors associated with business high-growth.
From a managerial point of view, managers of non-high-growth firms may see them as example to follow, given their high-growth rates. However, the managers have to bear in mind that the majority part of the high-growth firms can only preserve this status for a short period of time.
Analyzing the characteristics of Portuguese HGFs it appeared that only few significant differences were encountered regarding the average firm age, firm size, total assets and solvency of both categories.
On the sectoral distribution ‘employment high growth firms’ and ‘turnover high-growth
30
periods, being the Manufacturing, Wholesale and retail trade sectors, those who dominate the Portuguese economic activity.
5.1 Future research and limitations
Before moving to the future research subject and approaching a limitation that we had while creating this paper related with data obtainment. In the database Amadeus, regarding Portuguese firms and comparing with some other studies that were made on similar area, the number of firms obtained was relatively low. Furthermore, in some fields the information was non-existent.
Throughout this paper a distinction between ‘fleeting high-growth firms’ and ‘persistent
high-growth firms’ was made. For future researches it would be interesting to analyze
which are the factors that prevent ‘fleeting growth firms’ from maintaining their high-growth status longer. Is it related with the decline of the demand for the product or service provided? Or are there other variables – internal and external – that contribute for the reduction of the high-growth rates?
Which aspects could explain the continuous high growth of the ‘persistent high-growth
firms’?
Getting more insight about this matter could lead to a potential overcome knowledge on the difficulties that high-growth firms suffer regarding the growth rates, this, could also be helpful for the new high-growth firms.
31
Furthermore, on the sectorial distribution for the ‘fleeting high-growth firms’ and ‘persistent high growth firms’, could there be any explanation why that some sectors tend to have a higher number of ‘fleeting high-growth firms’ than ‘persistent high growth firms’ or vice-versa?
It would be interesting to compare the high-growth firms of some other markets, for instance, compare the high-growth firms that are present in ‘PIGS’ (i.e. Portugal, Italy, Greece and Spain), and find the differences or similitudes that between them.
It seems that there are still many questions that need to be answered regarding the persistence of high business growth. Nevertheless, in a future research a distinction between ‘fleeting high-growth firms’ and ‘persistent high growth firms’ should be kept, as they seem to represent different types of high-growth firms.
32
6. BIBLIOGRAPHY
Almus, M. (2002), What characterizes a fast-growing firm?, Applied Economics,Vol. 34, 1497-1508.
Ana R. Silva (2014). Portugal está a perder empresas de elevado crescimento há quatro anos consecutivos.
Avaiable in:
https://www.publico.pt/economia/noticia/portugal-esta-a-perder-empresas-de-elevado-crescimento-ha-quatro-anos-consecutivos-1631307 [Accessed in: 5/10/2016].
Banco de Portugal (2013), Estudo da central de Balanços. Avaiable in:
https://www.bportugal.pt/pt-PT/ServicosaoPublico/CentraldeBalancos/Biblioteca%20de%20Tumbnails/Estudos%20da %20CB%2012_2013.pdf [Accessed in: 5/10/2016].
Barney, J. (1991), Firm Resources and Sustained Competitive Advantage, Journal of
Management, Vol. 17, 99-120.
Birch, D. L. (1989). Change, Innovation, and Job Generation. Journal of Labor Research, 10(1), 33-38.
European Commission (2011), Policies in support of high-growth innovative SMEs, INNO Grips Policy Brief by empirica Communication and Technology Research, principal author: Stefan Lilischkis, June 2011.
Eurostat – OECD (2007), Manual on Business Demography Statistics, European Communities/OECD, December 2007.
Garnsey, E., E. Stam and P. Hefferman (2006), New Firm Growth: Exploring Processes and Paths, Industry & Innovation, Vol.13, 1-20.
Gibrat, R. (1931), Les inéqalités économique, Paris, Recueil Sirey.
Greiner, L.E. (1972), Evolution and revolution as organizations grow, Harvard Business
Review, May-June, 37-46.
Kor, Y. and J.T. Mahoney (2004), Edith Penrose’s (1959) Contributions to the Resource-based View of Strategic Management, Journal of Management Studies, Vol. 41(1), 183-191.
Lipczynski, J., J. Wilson and J. Goddard (2005), Industrial Organization: Competition,
33
Manmohan S. Kumar (1985), Growth, Acquisition and Investment, London: Cambridge University Press.
Parker, S., D. Storey and A. van Witteloostuijn (2010), What happens to gazelles? The importance of dynamic management strategy, Small Business Economics, Vol. 35, 203-222. Penrose, E. (1959), The Theory of the Growth of the Firm, New York: Oxford University Press Inc.
Prais, Sigbert J.( 1976), The evolution of giant firms in Britain, London: Cambridge U. Press.
Samuels, John M. (1965), Size and Growth of Firms, Rev. Econ. Stud., Vol. 32(1), 105– 12. Storey, D.J.; Keasey, K.; Watson, R. and Wynarczyk (1987), The Performance Of Small
Firms: Profits, Jobs, And Failures, Routledge, London.
Sutton, J. (1997), Gibrat’s legacy, Journal of Economics Literature, Vol. 35, 40-59.
Teruel, M. and G. de Wit (2011), Determinants of high-growth firms: Why have some
34
7. APPENDIX 1
Table A: NACE-BEL 2008 sections
NACE-BEL 2008
Section A Agriculture, forestry and fishing
Section B Mining and quarrying
Section C Manufacturing
Section D Electricity, gas, steam and air conditioning supply
Section E Water supply, sewerage, waste management and remediation activities
Section F Construction
Section G Wholesale and retail trade; repair of motor vehicle and motorcycles
Section H Transporting and storage
Section I Accommodation and food service activities
Section J Information and communication
Section K Financial and insurance activities
Section L Real estate activities
Section M Professional, scientific and technical activities
Section N Administrative and support service activities
Section O Public administration and defense; compensatory social security
Section P Education
Section Q Human health and social work activities
Section T Activities of households as employers
Section U Activities of extraterritorial organizations and bodies
Section R Arts, entertainment and recreation