Carlos Eduardo da Silva Nossa Tuma*, Wilson Maia de Oliveira Junior**, Geraldo José da Silva Nossa Tuma***, Ivana Uglik Garbui****, Nelson Padilha da Silva****, Paulo Roberto Aranha Nouer****
Evaluation of the bone age in 9-12 years old
children in Manaus-AM city
Objective: This study evaluated bone age using the Greulich & Pyle method (1959) and pubertal growth according to the study conducted by Martins (1979). Methods: Hand and wrist radiographs of 201 children (103 boys) aged 9 to 12 years living in the state of Ama-zonas (Brazil) were analyzed. A chi-square test was used for statistical analysis at a level of significance of 5% (p<0.05). Results and Conclusions: Girls were at more advanced stages in all phases of skeletal growth than boys for the ages under study; 50% of the girls had reached pubertal growth peak, whereas only 11.6% of the boys were in the same stage. The beginning and the peak of the pubertal growth spurt occurred earlier among girls (10.1 ± 0.7 and 11.1 ± 0.8 years) than among boys (11.4 ± 0.7 and 12.3 ± 0.4 years). Early matura-tion was more frequent among girls than among boys (41.8% vs. 5.8%), and late maturamatura-tion was more prevalent among boys (38.8% vs. 11.2%). Mean bone age in the group of boys was 10.4 ± 1.7 years, and in the group of girls, 11.7 ± 1.8 years.
Abstract
Keywords: Growth and development. Puberty. Sexual maturity.
* Specialist in Orthodontics and Dentofacial Orthopedics, Federal University of Amazonas (UFAM). MSc in Orthodontics, São Leopoldo Mandic Dentistry School (SLMANDIC). Professor, University of Amazonas State and University Center Nilton Lins.
** Specialist in Orthodontics and Craniofacial Orthopedics and MSc in Orthodontics, University of São Paulo (USP). Professor of Orthodontics and Occlusion, UFAM. *** DDS, University of Amazonas State.
**** PhD in Orthodontics and Professor of Post-graduate courses of masters level in Orthodontics, SLMANDIC.
intROduCtiOn
Two thirds of orthodontic patients have mal-occlusion in which growth and development play an important role in the success or failure of treat-ment and directly affect the decisions about the use of extraoral mechanics, functional appliances, extractions or even orthognathic surgeries. Ortho-dontists should understand the events associated with growth because maturation stages have a decisive role in diagnosis, planning and length of treatment, as well as in the prognosis of malocclu-sion. Orthodontists should understand the events associated with growth because maturation stages have a decisive role in diagnosis, planning and length of the treatment, as well as in the prognosis of malocclusion.13 Therefore, individual patterns
of growth for each patient are fundamental fac-tors in the success of orthodontic treatment.
Age may be defined in several ways: bone age, morphological age, age at development of sec-ondary sexual characteristics, age at menarche and dental age. These parameters have all been described as means to define physiological age.18
The time when a patient will reach puberty and even when the pubertal growth spurt (PGS) will occur may be estimated. However, these different types of age have a low correlation, and there are individual variations according to sex, ethnicity, geographic location, genetic factors, climate, nu-trition and socioeconomic status. Because of that, the determination of specific chronological ages as the beginning of puberty in male and female patients is no longer used.2,11,18
PGS occurs in adolescence, usually between 10 years and 6 months and 15 years of age in the Brazilian population, and girls reach it at an earlier age. This phase of height and craniofacial growth occurs at the same time as the physical phenomena that follow maturation of the sexual system and the beginning of reproductive life. The estimated age at which they occur is variable and several individuals reach specific stages of skeletal maturation at different chronological ages.11,12,13
The most common methods to measure bone age using hand and wrist radiographs are the ones described by Greulich and Pyle7 (1959) and
Tan-ner-Whitehouse22 (TW2) (1983), which are based
on the recognition of maturity indicators that are characterized by changes in the radiographic ap-pearance of the epiphysis of long bones from the early mineralization stages to their fusion with the diaphysis.6
Several intrinsic and extrinsic factors are known to directly affect an individual’s growth pattern. Brazil is a very large country and has regional population differences; therefore, spe-cific studies should be conducted about nutrition, weight, height, and skeletal development patterns. The characteristics of each region should be taken into consideration to establish regional standards for the use of hand and wrist radiographs, to eval-uate the growth of that population, and, thus, sig-nificantly contribute to the practice of high qual-ity orthodontics. This study evaluated chronologi-cal age at the beginning and at the peak of PGS for both sexes and correlated findings with bone age in individuals born in the city of Manaus in the state of Amazonas, Brazil.
Several authors conducted studies using hand and wrist radiographs to determine bone age and PGS beginning and peak. Pubertal growth spurt occurred at 11 to 12 years in their samples, and PGS peak was exactly at 12 years of age.4 A study
with Swedish children found that PGS occurred at 10 to 12 years and was completed at 14.8 among girls and 17.1 among boys. Height velocity peaked two years after the beginning of PGS in both sexes (12 years for girls and 14.1 for boys).9
In general, ossification of the ulnar sesamoid may be used as an indicator of PGS beginning, which oc-curs between 10 and 11 years in girls and 11 and 12 years in boys. Other authors found similar chrono-logical ages for PGS beginning and peak.8,10,17
velocity age for girls was 2 years earlier than for boys and ranged from 10 to 14 years.
Data about bone age and PGS are not avail-able for the population in the Northern region of Brazil, particularly in the state of Amazonas. This epidemiological study analyzed hand and wrist radiographs to determine bone age using the Greulich and Pyle radiographic atlas7 and
to determine, according to the study conducted by Martins,12 the standard height velocity curve
and hand and wrist bone ossification stages.
MAtERiAL And MEtHOdS Sample size
For a total of 127,133 children enrolled in public schools, a sample size of 132 individu-als was calculated for a 95% confidence interval and a 5% error. Therefore, data about 132 chil-dren were included in the study.
Sample size and method error
The following equation was used to calcu-late sample size:
Key: N = universe n = calculated sample
∂ = confidence level e = sample size error p.q = percentage which
phenomena occurs n= ∂2.p.q.N
e2.(N-1)+ ∂2.p.q
Where, from a total of 127,133 children en-rolled in the public schools in Manaus, a city in the Brazilian state of Amazonas, a sample of 132 individuals was defined for 90%, 95% and 99% confidence intervals and 5.8%, 7.0% and 9.1% errors using the interobserver error method.
A sample of 132 Brazilian boys and girls aged 9, 10, 11 and 12 years, born in Manaus, whose parents and grandparents were born in Amazonas, and who studied in municipal public schools were included in the study and separated into groups according to sex and age. According to the Manaus
Education Department, 127,133 children in this age group were enrolled in school in 2006. An in-formed consent term was signed by the parents. A special form was used to collect data about medi-cal history, which included place of birth, possible absence of one or more permanent teeth, maloc-clusion, systemic diseases, nutritional deficiencies, chronic infectious diseases and no previous orth-odontic treatments. After data about clinical his-tory were recorded, the children were taken to a radiology center for hand and wrist radiographs. This study was previously approved by the Ethics and Research Committee of the institution where it was conducted under no. 05/093 and in agree-ment with Resolution no. 196/1996 of the Brazil-ian National Health Council, Ministry of Health, on April 20, 2006.
Hand and wrist radiographs were acquired using 18 x 24 Kodak T-Mat G/RA film (At-lanta, GA, USA) usable for at least 6 months according to expiration date and an Orthora-lix 9200 Plus unit (X Gendex, Dentsply, York, PA, USA) calibrated to operate at 06 mA, 60 KVp and exposure time of 0.16 seconds. The focus-to-film distance was 76 cm. Patients were protected with a lead apron. The radiographs were acquired with the participant’s open left hand centered on the film to include the carpal, metacarpal and phalangeal regions.
After acquisition, the radiographs were pro-cessed in a dark room using an automatic devel-opment method and an AT 2000 XR processor (Air Techniques, New York, NY, USA) accord-ing to film manufacturer’s recommendations.
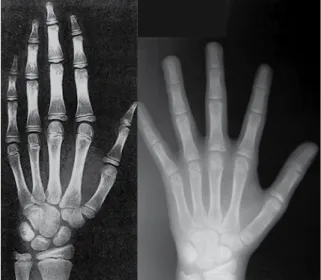
After fixing and drying, the radiographs were analyzed in a dimly-lit room using an X-ray box, a 0.5 mm lead pencil, a soft eraser and a form for data recording. Hand and wrist radiographs were analyzed visually and each one was com-pared with the radiographic standards in the Greulich and Pyle7 atlas (Fig 1), a widely used
To calculate bone age, fi rst the hand and wrist radiograph was compared with the standard for the same sex and closest chronological age in the atlas. After that, for confi rmation, the radiograph was compared with standards for individuals immediately younger and older than the initial standard. When the most similar standard was found, bone age was recorded in a specifi c form. To check maturation stages of the hand and wrist bones, a corresponding mark was made in the standard height velocity curve to determine the time of PGS, as suggested by Martins.12
All radiographs were examined by the same observer. To evaluate intraobserver error, a pilot study was conducted using the whole sample to determine bone age and the standard height velocity curve. After that, the radiographs were examined again in 10 days to evaluate the gree of reliability using a form specifi cally de-veloped for this study, and no statistically signif-icant intraobserver error was found (p<0.05).14
Statistical analysis
A chi-square test was used to compare statis-tically signifi cant differences between groups and the associations between chronological age, bone
age and sex. Linear regression analysis was used to evaluate the correlation between variables. The level of signifi cance was set at 5% (p<0.05).
RESuLtS
The results are shown in Tables 1, 2 and 3, and Figures 2, 3 and 4.
FIGURE 1 - Comparison of hand and wrist radiograph of 10-year-old girl and the corresponding standard in the Greulich & Pyle atlas7.
FIGURE 2 - Epiphyseal stages.
TABLE 1 - Distribution of PGS frequency according to sex.
TABLE 2 - PGS phases according to chronological age and sex. Chi-Squared test χ2=87.411 (p<0.001).
PGS Boys Girls Total
N % N % N %
Not
yet 31 43.7 4 6.1 51 25.4
Beginning 32 44.7 12 19.4 65 32.3
Peak 8 11.6 30 50.0 61 30.4
Completed - - 15 24.5 24 11.9
Total 71 100 61 100 132 100
PGS Sex Mean SD Min. Median Max.
Not yet M 10.1 0.7 9 10.1 11.4
Beginning M 11.4 0.7 9.9 11.3 12.9
Peak M 12.3 0.4 11.4 12.3 12.9
Completed M - - - -
-Not yet F 9.6 0.6 9.0 9.7 10.4
Beginning F 10.1 0.7 9.0 10.1 11.6
Peak F 11.1 0.8 9.4 11.0 12.8
Completed F 11.7 0.8 10.4 12.0 12.9 Pubertal Growth Spurt
% patients
- FD = 14
12
10
8
6
4
2
0 FP
100 90 80 70 60 50 40 30 20 10 0
15 14 13 12 11
10
9 10 11 12 13
9 8
7 6
diSCuSSiOn
The analysis of absolute and relative number of boys and girls at the different PGS stages re-vealed that girls were at a more advanced phase than boys (Table 1). In the sample under study, 44.7% of the boys and 19.4% of the girls were at the beginning of PGS, and about 50% of the girls had reached PGS peak, whereas only 11.6% of the boys were in the same phase. No boy had reached the fi nal phase of PGS, whereas 24 girls (24.5%) were in this phase. The comparison between sexes using a chisquare test revealed statistically signifi -cant results (p<0.001), which confi rmed that girls were at a more advanced pubertal growth stage than boys (Table 1). The results found in this
study for a group of children living in the state of Amazonas, Brazil, confi rm data previously re-ported for Swedish11 and Brazilian children from
different regions.12 Similar results have also been
reported in other studies.6,8,9
Figure 2 shows the number of children at each epiphyseal stage regardless of age or sex. One child (0.5%) had not reached the fi rst epiphyse-al stage, and no children had completed growth, which was determined as the full fusion of radius epiphysis and diaphysis (Rut). Also, the most fre-quent stages for the age groups under study were FD= (11.9%), which described children not yet in the PGS; R= (11.4%), of children in the be-ginning of PGS; and Rcap (10.0%), of children at PGS peak.
Table 2 shows that mean age for boys at the beginning of PGS was 11.4 years, and at peak PGS, 12.3 years (0.9 year after beginning of PGS), and no boy had competed PGS. In the group of girls, mean age at the beginning of PGS was at 10.1 years and at peak PGS, 11.1 years, which was one year after the beginning of PGS. The age of 11.7 years marked the end of PGS in the age groups under study. The comparison of mean age at the beginning and peak of PGS between sexes revealed that girls were younger at the time of each of these events. The analy-sis of chronological age at the beginning of PGS revealed that girls reached this phase 1.3 year FIGURE 3 - Types of maturation according to sex. FIGURE 4 - Dispersion plot: chronological age and bone age according
to sex.
Age
(years) Sex Mean SD Min. Median Max.
9 M 8.4 1.6 6 8.5 13
10 M 9.8 1.1 8 10 12.5
11 M 10.8 1.0 9 11 13
12 M 12.3 1.0 10 12.5 13.5
9 F 9.6 1.3 6.8 10 11
10 F 11.2 1.5 8.8 11 15
11 F 12.3 1.3 8.8 12 15
12 F 13.2 1.1 11 13.3 15
TABLE 3 - Statistical data on bone age according to chronological age and sex.
% Patients
Male Female
Intermediate Late Early maturation
Maturation phase according to sex
Bone age
Chronological age
before boys, and PGS peak was 1.2 year earli-er in girls than in boys. Howevearli-er, othearli-er studies found that PGS beginning and peak were a mean 1 to 2 years later in their samples than in our study.5,8,9,10,17,21
Figure 3 shows the comparison between the type of maturation (early, intermediate or late) and sex. There was a greater prevalence of inter-mediate maturation (differences between bone and chronological age below 1 year) in both sexes (boys = 55.3%; girls = 46.9%). Early maturation, that is, bone age at least one year greater than chronological age, was more frequent among girls (41.8%) than boys (5.8%). Late maturation, or chronological age at least one year greater than bone age, had a greater incidence among boys (38.8%) than girls (11.2%). These results con-firm data reported in other studies, which found that girls reach all the skeletal maturation phases at an earlier age than boys (p<0.001).4,8
Figure 4 shows the regression line between bone and chronological ages for the study par-ticipants and indicates a positive correlation be-tween chronological and bone ages in the groups of both boys and girls. Therefore, results showed that bone age increases with chronological age.
Table 3 shows the statistical results of mean bone age in each chronological age according to sex. In the group of boys, bone age was greater (12.3 years) only at the chronological age of 12 years, and was lower at 9 (8,4), 10 (9.8) and 11 (10.8) years of age. Girls had bone ages
rela-tively greater at all chronological ages, with dif-ferences ranging from 0.6 year at 9 to 1.3 year at 11 years. At 9, mean bone age was 9.6 years; at 10, 11.2 years; at 11, 12.3 years; and at 12, 13.2 years. The correlation of bone ages for each chronological age between sexes revealed that girls had bone ages greater than boys at each age group under study: 1.2 year at 9; 1.4 at 10; 1.5 at 11; and 0.9 at 12.
COnCLuSiOn
Girls were at more advanced stages in the different PGS phases than boys.
Chronological age at the beginning of PGS among girls was 10.1 years, and at peak PGS, 11.1 year. Among boys, chronological ages at the beginning and peak PGS were 11.4 and 12.3 years.
Children in the state of Amazonas had their PGS beginning and peak one to two years ear-lier than children in other regions of Brazil.
Girls had significantly greater bone ages than boys, and the mean difference was 1.3 year in all age groups under study. Chronological and bone ages were 10.9 and 10.4 for boys and 11 and 11.7 for girls.
Contact address Wilson Maia O. Jr
Rua 6, 192, Conj. Castelo Branco - Parque Dez CEP: 69.055-240 - Manaus / AM, Brazil E-mail: [email protected]
1. Bergensen EO. The male adolescent facial growth spurt: its prediction and relation to skeletal maturation. Angle Orthod. 1972;42(4):319-38.
2. Bowden BD. Epiphysal changes in the hand/wrist area as indicators of adolescent stage. Austr Orthod J Pediat. 1976;4(3):87-104.
3. Cerveira ARP, Silveira ID, Calmo JAF, Danesi OFP, Rosa RO, Karam LC, et al. Avaliação da idade óssea em adolescentes do sexo masculino na faixa etária de 10 a 12 anos. Rev Odonto Ciênc. 1990;5(10):36-46.
4. Damante JH, Freitas JAS, Capelloza Filho L. Estirão de crescimento circumpuberal em meninas brancas, brasileiras, da região de Bauru. Ortodontia. 1982;15(3):221-30. 5. Franco AA, Santana AH, Santana IS, Melo MFB, Santos
Júnior JH. Determinação radiográica da maturidade
esquelética e sua importância no diagnóstico e tratamento ortodôntico. Ortodontia. 1996;29(1):53-9.
6. Gilli G. The assessment of skeletal maturation. Horm Res. 1996;45(2):49-52.
7. Greulich WW, Pyle SI. Radiographic atlas of skeletal development of the hand and wrist. Calif Med. 1950 October; 73(4):378.
8. Guzzi BSS, Carvalho LS. Estudo da maturação óssea em
pacientes jovens de ambos os sexos através de radiograias
de mão e punho. Ortodontia. 2000;33(3):49-58.
9. Hägg V, Taranger J. Maturation indicators and the pubertal growth spurt. Am J Orthod. 1982;82:299-309.
10. Iguma KE, Tavano O, Carvalho IMM. Comparative analysis of pubertal growth spurt predictors: Martins and Sakima method and Grave and Brown Method. J Appl Oral Sci. 2005 Jan-Mar;13(1):58-61.
11. Magnunsson TE. Skeletal maturation of the hand in Iceland. Acta Odontol Scand. 1979;37(1):21-8.
12. Martins JCR. Surto de crescimento puberal e maturação óssea em ortodontia [dissertação]. São Paulo: Universidade de São Paulo; 1979.
REfEREnCES
13. Mercadante MMN. Radiograia de mão e punho. In: Ferreira
FV. Ortodontia: diagnóstico e planejamento clínico. 6ª ed. São Paulo: Artes Médicas; 2004. p. 188-23.
14. Midtgard J, Bjork G, Linder-Aronson S. Reproducibility of cephalometric landmarks and errors of measurements of cephalometric cranial distances. Angle Orthod. 1974 Jan;44(1):56-61.
15. Moraes LC, Moraes MEL. Veriicação da assimetria bilateral de desenvolvimento por meio de radiograias de mão e
punho, baseada na avaliação da idade óssea. Rev Odontol UNESP. 1996;25(n. esp.):183-94.
16. Onishi S, Amaral IM, Carvalho LS. Identiicação da menarca na curva de crescimento estatural: radiograia de mão e
punho. Rev Assoc Paul Cir Dent. 2006;60(3):176-81. 17. Peluffo PL. Indicadores de la maduración. Edad ósea y
vértebras cervicales. Rev Odontol Interdisc. 2001;2(3):9-15. 18. Prates NS. Crescimento crânio-facial e maturação óssea:
estudo em crianças nascidas em Piracicaba, portadoras de oclusão dentária normal [tese]. Campinas: Universidade Estadual de Campinas; 1976.
19. Pryor JW. The hereditary nature of variation in the
ossiication of bones. Ana Rec. 1907;1:84-8.
20. Siqueira VCV, Martins DC, Canuto CE. O emprego das
radiograias da mão e do punho no diagnóstico ortodôntico.
Rev Dental Press Ortodon Ortop Facial. 1999;4(3):20-9. 21. Sulivan PG. A estimativa do surto de crescimento puberal,
por meio do osso sesamóide e da menarca. Rev da ABRO. 2004;5(1):42-6.
22. Tanner JM, Whitehouse RH, Cameron N. Assessment of skeletal maturity and prediction of adult height (TW2 method). London Academic Press; 1983.
23. Todd TW. Atlas of skeletal maturation (hand). St. Louis: C.V. Mosby; 203 p.