Country-specific Drivers of Triadic Patent Families in selected
environment-related Technologies
-
A country-level empirical research on environmental innovation activity
[email protected] NOVA
School of Business & Economics
Place & date: Maastricht, 17th of December, 2018 Name, initials: Frederic Virnich, FV
ID number: 31797
Study: MSc International Management Course code: 2866-1819_FLL
Supervisor: Miguel Muñoz Duarte Teresa Mannebach
Firstly, I would like to express my sincere gratitude to my first supervisor Nina Karthaus, mem-ber of the Organisation and Strategy Department at Maastricht University School of Business and Economics. Without her valuable knowledge and continuous support throughout the entire process of writing, this master thesis would not have become what it is now. While providing clear guidance, she simultaneously afforded me to work independently and conduct my own research. I am grateful for her continuing engagement, constructive advice, as well as for her amiable nature which combined created an ideal work environment.
Further, I would like to acknowledge Professor Dr Iwan Bos, member of the Organisation and Strategy Department at Maastricht University School of Business and Economics, as the sec-ond reader of this thesis. In the same vein, I would like to acknowledge Professor Dr Miguel Muñoz Duarte as well as Teresa Mannebach as being my supervisors at NOVA School of Business and Economics. I am gratefully indebted to their insightful comments on this research.
I am also grateful to my brother William Virnich for always being amenable to share thoughts and ideas and, thus, for stimulating discussions in the course of writing this thesis. Similarly, I want to express my deep appreciation for my girlfriend Carolin Vosdellen who always stands by my side giving me warm encouragement and exercising continued patience.
Finally, I would like to express my very profound gratitude to my mother Marie-Luise Virnich and Wolfgang Lehwald for giving me the chance to participate in the Double Degree Program, in the first place. Moreover, they have provided me with unfailing support and persistent en-couragement throughout my years of study and especially through the process of researching and writing this thesis. This accomplishment would not have been possible without them so that I dedicate this thesis to them. Thank you!
The importance of innovation in being a driving force for national economic development is broadly acknowledged by a large body of literature. Especially, the development of environ-mentally friendly technologies and services has transformed into a growing industry and, thus, gained in influence on economic growth patterns. Motivated by differences in eco-innovation performance across OECD economies, the present study provides new evidence on country-specific determinants of environmental related innovation activity. Using panel data setting of 28 OECD countries concerned over the period 1998 – 2013, the analysis builds upon theoretical grounds of ideas-driven endogenous growth theory as well as the national innovation system (NIS) perspective and examines the relationship between determinants of five innovation con-ditions and environmental innovation output. Particularly, the study integrates separate litera-ture strands regarding institutional-, human capital and research-, infrastruclitera-ture-, market so-phistication- and business sophistication conditions into a single model. Referring to Triadic Patent Families in selected environment-related technologies, the thesis employs an empirical operationalisation of eco-innovation that improves international comparability compared to commonly used patent counts from single patent offices. Using fixed effects regression models, empirical results suggest that governmental expenditures on education, credit availability to the private sector, and inward foreign direct investments play a role in determining national environment-related innovation performance. In contrast, no evidence is found for a significant impact of factors regarding institutional- as well as infrastructural innovation conditions.
Keywords: Eco-innovation; Triadic Patent Families; National innovation system; Innovation
List of Figures and Tables ... 1
1. Introduction ... 2
2. Theoretical Framework ... 6
2.1 Endogenous Growth Theory and National Innovation System (NIS) Perspective ... 6
2.2 Literature Review and Hypotheses ... 8
2.2.1 Institutions ... 9
2.2.2 Human Capital & Research ... 13
2.2.3 Infrastructure ... 16 2.2.4 Market Sophistication ... 17 2.2.5 Business Sophistication ... 19 3. Methodology ... 20 3.1 Empirical Specification ... 21 3.2 Data Description ... 24 3.1.1 Dependent Variable ... 25 3.1.2 Independent Variables ... 28 3.1.3 Control Variables ... 30 3.3 Estimation Method ... 30 4. Results ... 32
4.1 Main Empirical Results ... 33
4.2 Robustness Checks ... 38
5. Discussion ... 40
5.3 Theoretical Contributions ... 49
5.4 Limitations and Future Research ... 51
6. Conclusion ... 54
References ... 56
Appendix A – Conceptual Framework ... 66
Appendix B – Theoretical Framework ... 67
Appendix C – Variables and Definitions ... 68
Appendix D – Pair-wise Correlations ... 70
Appendix E – Descriptive Statistics ... 71
Appendix F – Variance Inflation Factors (VIF) ... 72
Appendix G – Hypotheses ... 73
1
List of Figures and Tables
Figures
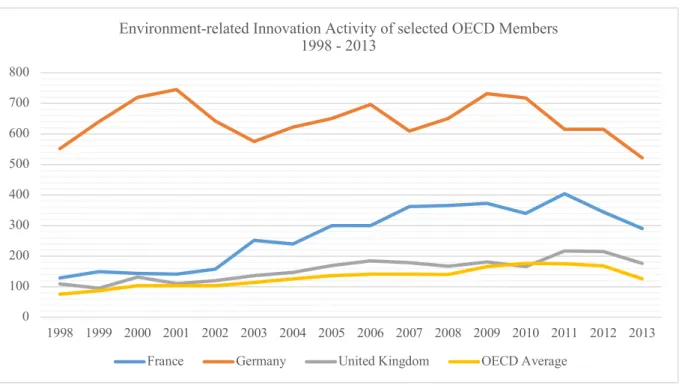
Figure 1: Environment-related Innovation Activity of selected OECD Member States
1998 - 2013……….2 Figure 2: Country shares of patents applied for at the EPO, patent grants by the USPTO
and Triadic Patent Families, for priority year 1999………26
Tables
Table 1: Sample Countries……….24 Table 2: Estimation lTPF-ENVTECH using Model (1), (2), (3), and (4)………...34
2
1. Introduction
Varying terminology is used in attempting to define environmental innovation. The thesis con-siders the terms “environmental-”, “green-“, and “eco-innovation” as interchangeable and iden-tical. They are understood as any form of innovation that results in the reduction of environ-mental impacts irrespective of the innovator’s original intention (Organisation for Economic Co-operation and Development [OECD], 2010; Rio, Penasco, & Romero-Jordan, 2016). Look-ing at national environmental innovation output, it becomes apparent that the commercialisation of technology related to environmental pollution, water scarcity, and climate change mitigation has been concentrated in only few countries while, further, being subject to fluctuations over time. Taking into consideration recent patent data from 2013, France, Germany, and the UK, for instance, stand at the forefront in terms of patenting activity at the beginning of the twenty-first century as illustrated by Figure 1. The questions arise why there are cross-country differ-ences in the intensity of eco-innovation and why this intensity fluctuates over time.
Figure 1. Environment-related Innovation Activity of selected OECD Member States 1998 – 2013. Environmental related innovation activity measured by OECD Triadic Patent Families in selected environment-related Technologies. OECD Average based on 36 OECD member coun-tries as of December 2018. 0 100 200 300 400 500 600 700 800 1998 1999 2000 2001 2002 2003 2004 2005 2006 2007 2008 2009 2010 2011 2012 2013
Environment-related Innovation Activity of selected OECD Members 1998 - 2013
3 Importance of these questions can be explained from a societal point of view on the one hand as well as from an economic perspective on the other. Firstly, our society enforcedly is in need of nurturing environment-related innovation since the modern world is generally confronted with challenges that can only be overcome by fundamental inventions in technical, ecological, social, and economic fields (European Commission, 2017; Haščič & Migotto, 2015). Especially in view of an ongoing climate change, main challenges become manifest in the transition to a clean, efficient and sustainable energy system, the realization of a resource-efficient economy, the achievement of a smart, green and integrated transport system, or the protection of natural resources and ecosystems as outlined by the European Commission (2017). To manage these challenges, it is of utmost relevance for the well-being of society to understand how to effi-ciently foster innovation activity on a global scale. At the same time, it should be acknowledged that environmental performance may not be the initial driver. That is, secondly, the ability to continually innovate emerges to be a key success factor in today’s complex and dynamic econ-omy as emphasized by research of endogenous growth theories (Filippetti & Archibugi, 2011; Furman, Porter, & Stern, 2002; Hu & Mathews, 2005; Khayyat & Lee, 2015). Accordingly, national governments increasingly place innovation at the centre of their growth strategies (Dutta, Lanvin, & Wunsch-Vincent, 2018), highlighting its economic importance. A country’s capacity to compete is becoming a question of a country’s capacity to innovate (Constantini, Crespi, Marin, & Paglialunga, 2017). The Organisation for Economic Co-operation and Devel-opment (2011) especially emphasises contribution potential of environmental innovation to economic development showing that the management of climate change and associated envi-ronmental goods and services has transformed into a rapidly growing industry inevitably offer-ing huge profit potential. Consequently, decision-makers in economy, politics, and sciences are in search of significant innovation determinants to develop appropriate policies that foster en-vironmental inventive activity (Haščič & Migotto, 2015).
4 The pursuit and development of policies intending to facilitate environment-related, national innovation activity effectively, however, are consistently limited for at least three reasons. Firstly, while a considerable amount of existing research has focused on the importance of na-tional innovation capability for economic performance (Khedhaouria & Thurik, 2017), empiri-cal literature specifiempiri-cally examining national antecedents of environment-related innovation seems to be still in its infancy (Díaz-García, González-Moreno, & Sáez-Martínez, 2015; Klewitz & Hansen, 2013; Rio, Penasco, & Romero-Jordan, 2016) mainly because of data re-strictions (Horbach, 2014). For instance, patent data of environment-related technologies as a proxy for environmental innovation activity has been made available only recently (Haščič & Migotto, 2015). Secondly, existing empirical literature pertaining to determinants of national innovation capability does not provide a single holistic framework covering all relevant dimen-sions of innovation drivers (Filipetti & Archibugi, 2011; Khayyat & Lee, 2015; Kirikkaleli, Ozun, & Sari, 2018). This can be ascribed to the fact that existing studies seem to be rather fragmented and exclusively focus on a fractional amount of those innovation conditions which are deemed to be relevant by other authors (Khedhaouria & Thurik, 2017). Thirdly, empirical literature is insufficient in that it does not agree on a harmonised set of underlying drivers of the innovation process (Furman, Porter, & Stern, 2002; Filippetti & Peyrache, 2011; Castellacci & Natera, 2013) which is in turn caused by point one and two as outlined above.
Motivated by this important gap, the central purpose of this study is to deliver novel insights into the literature of environment-related innovation drivers, firstly, by availing itself of updated and more sophisticated data. Generally, it is recognised that patent counts are the most useful measure available to examine technology output and to compare its changes across countries and over time (Nam & Barnett, 2011; Lee, Nam, Lee, & Son, 2016). Following Popp (2005), though, patent counts from single patent offices do not represent a precise comparison of inno-vative activity across countries by reason of a home advantage bias. This bias occurs since
5 domestic patent applicants tend to file patents in their home country first, before filing at foreign patent offices (Dernis & Khan, 2004). The study utilises recently published OECD Triadic Pa-tent Family (TPF) database in order to avoid this bias. That is, a set of paPa-tent applications for the same invention filed at the European Patent Office (EPO), the United States Patent and Trademark Office (USPTO) and the Japan Patent Office (JPO) are considered in the analysis. This way, the research explicitly contributes to the cross-country empirical literature by ena-bling improved international comparability and accentuates its uniqueness. Data is further dis-aggregated into specific technology fields and allows to concentrate on those technologies that address environmental pollution as well as water scarcity and facilitates eco-system health and climate change mitigation. Secondly, the thesis helps to address aforementioned gap and justi-fies its novelty by developing a comprehensive framework which covers a broader spectrum of pertinent dimensions compared to past research. Thus, drawing on the ideas-driven endogenous growth theory and the national innovation system perspective, a model will be developed that consolidates innovation drivers in five dimensions being institutions, human capital and re-search, infrastructure, market sophistication, and business sophistication. Thirdly, taking a prac-tical perspective, the study provides an empirical model to inform governments as well as in-ternational organisations how to manage national environmental innovation output signifi-cantly. Therefore, the thesis builds on the research question of what macro-level indicators de-termine national environmental-related innovation. In particular, it examines in how far condi-tions concerning institucondi-tions, human capital and research, infrastructure, as well as market- and business sophistication will affect national eco-innovation activity.
This thesis attempts to answer the research question by firstly examining the state of existing literature and providing an overview of what research has discovered so far. On this basis, a comprehensive theoretical framework will be developed, and hypotheses will be inferred in
6 Section 2. Subsequently, data descriptions will be provided as well as different models for es-timating national innovation activity will be depicted in Section 3, conjointly capturing the methodology. Then, analysis results will be revealed before being tested for robustness in Sec-tion 4. After a thorough discussion of the findings including political- and theoretical implica-tions, limitations as well as future research opportunities in Section 5., Section 6 will close the paper with an overall conclusion.
2. Theoretical Framework
This section aims to theoretically develop and ground underlying hypotheses of the research study. For this reason, ideas-driven endogenous growth theory and the national innovation sys-tem perspective will be introduced in the first place, serving as the theoretical foundation for argumentation. A conceptual framework, derived from theory, is depicted in Appendix A. Sub-sequently, a clear line of arguments will be provided explaining the composition of relevant variables used in the theoretical framework (Appendix B). In order to ensure coherence, the discussion of research studies is grouped according to five pillars being institutions, human capital and research, infrastructure, market- and business sophistication.
2.1 Endogenous Growth Theory and National Innovation System (NIS) Perspective
The thesis draws on two individual areas of previous research, which become manifest in the ideas-driven endogenous growth theory on the one hand and research on national innovation system on the other. Both research areas classify country-specific factors that influence inno-vation performance. Whereas endogenous growth theory generally points to investment in hu-man capital and knowledge in the form of subsidies for research and development or education in order to offer incentives for innovation, the NIS perspective highlights a wider spectrum of
7 nuanced factors (Furman, Porter, & Stern,2002). Freeman (1982) was pioneering by proposing the concept of the national innovation system in the 1980s. With his work, he intends to chal-lenge the neoclassical concept of economic growth as it disregards the role of innovation and technological development. In general, a national innovation system can be described as a sub-system of a country’s economy in which institutions and organisations collectively engage in inventive activities (Balzat & Hanusch, 2003). In fact, literature of both research areas agrees by arguing that innovation and technological change are decisive factors for economic growth (Filippetti & Archibugi, 2011; Furman, Porter, & Stern, 2002; Khayyat, & Lee, 2015; Khedhaouria & Thurik, 2017; Lundvall, 1985, 1988; Nelson, 1988, 1990). Amongst others, the authors base their reasoning on research conducted by Nelson and Winter (1982) and the neo-Schumpeterian theory of innovation stating that economic growth is nurtured by evolutionary technological change. It is important to emphasise that the NIS perspective does not conceptu-alise innovation as a discrete endeavour made by individual companies but rather as a combined effort of several parties including private and public institutions(Watkins, Papaioannou, Mug-wagwa, & Kale, 2015). In this regard, the term national innovation capability is used which captures a nation’s ability to coordinate resources and skills in such a way that present knowledge is converted into innovation (Fagerberg & Srholec, 2008; Lopez-Carlos & Mata, 2010). In line with Nelson (1988), Nelson and Winter (1982) and Freeman (1987) the present study assumes that this capability is an evolutionary learning process taking place within insti-tutional structures. As a matter of fact, “effective learning requires instiinsti-tutional structures with appropriate legal institutions that develop human capital through appropriate education and re-search systems, build common infrastructures to enable knowledge sourcing and transfer, and facilitate business and market conditions to absorb, adopt and implement foreign advanced technologies” (Khedhaouria & Thurik, 2017, p. 49). Due to the fact that the NIS perspective especially highlights the importance of these conditions (Freeman, 1995; Lundvall, 1992; Lundvall et al., 2002) and, thus, broadens the view of endogenous growth theory, it is used as
8 the underlying theory for the framework in this study. That is to say, the framework at hand considers innovation output as being determined by five conditions which are institutions, hu-man capital and research, infrastructure, as well as market- and business conditions (Appendix A). Nowadays, exactly this five-pillar segmentation is used by the Global Innovation Index (GII, 2018) to consolidate the relevant spectrum of innovation drivers in its Innovation Input Sub Index. GII is a country ranking based on the assessment of a nations’ innovation capacity and published annually by Cornell University, the European Institute of Business Administra-tion (INSEAD) and the World Intellectual Property OrganizaAdministra-tion (WIPO) (Dutta, Lanvin & Wunsch-Vincent, 2018). It assumes that the entire set of conditions should be improved in order for a country to strengthen its innovation capability.
2.2 Literature Review and Hypotheses
Diving deeper into the topic of the national innovation system, it becomes apparent that litera-ture on NIS has revealed the emergence of several distinctive themes (Díaz-García, González-Moreno, & Sáez-Martínez, 2015). Since the 1990s, several performance-oriented studies have begun to examine the outcomes and results of inventive activity (Balzat & Hanusch, 2003). By contrast, another body of literature has tried to shed light on the drivers of innovation. In this respect, a rich and still growing body of literature has investigated innovation activity without a specific context whereas other authors have aimed at illustrating distinctive features in the context of a study. Analyses have been targeted at particular regions like Asian countries for instance (Hu & Mathews, 2005; Krammer, 2009). Likewise, researches have attempted to em-phasise specificities when focusing on a particular type of innovation such as information and communication technologies (ICTs) (Lee, Nam, Lee & Son, 2016) to provide another example. Particularly noticeable is the fact that there are relatively few historical studies in the area of sustainability-related innovation (Klewitz & Hansen, 2013). Finally, the systemic approach has
9 led a number of authors to bring into focus policy assessments and how the political framework can foster inventive activities of a country.
Even though the study is particularly interested in the drivers of green innovation, it is addi-tionally going to concentrate on the body of literature covering antecedents of innovation in general. It is assumed that if certain factors have an influence on overall innovation activity of which eco-innovation is considered to be a sub-category, it follows that these factors impact eco-innovation in the same way. The reason for including a larger body of literature lies in the fact that research on determinants of eco-innovation is still in its infancy, and thus scarce. In this way, it is ensured that a broader spectrum of analysis approaches, useful methods, important outcomes and critical limitations are covered. It has to be pointed out, that literature on innova-tion drivers can be further classified into a micro-, meso-, and macro level (Díaz-García, González-Moreno, & Sáez-Martínez, 2015). Micro-level studies have paid attention to firm-specific influences on innovation, whereas meso-level research has predominantly considered the role of market dynamics. Macro-level studies have taken a more holistic and systemic view in that they trace results of interaction over a larger population. The thesis will particularly give attention to innovation determinants on macro-level. The unit of analysis is an entire nation which is subject to this study.
2.2.1 Institutions
As previously outlined, the NIS perspective originates from the neo-Schumpeterian theory of innovation which accentuates national inventive efforts to be particularly facilitated by institu-tions (Nelson & Winter, 1982). Formal instituinstitu-tions encompass policies, laws, constituinstitu-tions, rights and regulations pertaining to a country’s regulatory-, business-, and political environment (Leftwich & Sen, 2010). They specifically stimulate innovation activity as they reduce
uncer-10 tainty on the one hand and create incentives for companies on the other (Nelson, 2008). Con-sidering a country’s regulatory environment, the majority of research (Fu & Yang, 2009; Fur-man & Hayes 2004; FurFur-man, Porter, & Stern, 2002; Krammer, 2009) indicates that a strong intellectual property rights (IPR) regime is a key predictor of innovation at the national level as it particularly provides incentives for participating in economic activities including innovation activities (Acemoglu, Johnson, & Robinson, 2005). More precisely, strong IPR policies incen-tivise domestic firms to invest in and develop patentable innovation on the one hand. On the other, they indirectly foster innovation activity by attracting inward foreign direct investment (FDI) with high spillovers (Fu & Yang, 2009; Krammer, 2009) as will be discussed in Section 2.2.5. Building on literature in national innovation systems, Furman, Porter, and Stern (2002) implement a novel framework, which is later applied by Furman and Hayes (2004) to under-stand national innovative capacity. Estimating a production function, both studies find that the strength of protection for intellectual property (IP) positively and significantly affects interna-tional patenting. Fu and Yang (2009) make use of a distinctive approach in order to analyse variances in patenting across countries by applying a stochastic frontier analysis. This standard efficiency estimation approach allows to analyse the efficiency of a country’s innovation sys-tem and the drivers of that efficiency. Nonetheless, they similarly identify intellectual property rights protection to significantly and positively impact economic patenting efficiency. Focusing on Eastern European Transition Countries and bearing on a modified IPR index that combines two dimensions: legislative protection and the degree of enforcement, Krammer (2009) also finds that a strong IPR regime increases patenting. In contrast to previous findings, only Hu and Mathews (2005, 2008) do not detect evidence for a significantly positive relationship between IP protection and patent output. Adjusting the procedure of Furman, Porter, and Stern (2002) by applying it to five East-Asian countries (Hu & Mathews, 2005) and China (Hu & Mathews, 2008), they conclude that a strong IPR regime insignificantly and negatively affects patenting activity.
11 Exclusively focusing on intellectual property rights, the majority of authors mentioned earlier fail to consider other important dimensions of a nation’s institutional framework as proposed by Dutta, Lanvin, and Wunsch-Vincent (2018). Indeed, convenient business conditions stimu-late national inventiveness since designing favourable terms for starting as well as doing busi-ness fosters domestic entrepreneurship and attracts inventive activity of foreign companies (Krammer, 2009). Entrepreneurs demand innovation in the form of new products and new pro-duction methods in order to achieve competitiveness (Versakelis, 2006). Particularly, the re-duction of time and effort for starting a business as well as the mitigation of administrative barriers encourage competitiveness and thus overall inventiveness of firms at the national level (Djankov, La Porta, Lopez-de-Silanes, & Shleifer, 2002; Lopez-Carlos & Mata, 2010). Whereas Ho and Wong (2007) take into account the number of procedures, days, and costs to start a business, as well as minimum capital required for registration, separately, Klapper, Laeven, and Rajan (2006) consolidate these factors into a composite index. Findings of both studies conform with each other in that they argue for a significant negative impact on the rate of entrepreneurship which in turn negatively affects national innovation output. Krammer (2009) reveals a direct effect on innovation measures and identifies the cost of starting a busi-ness to significantly decrease national patenting activity. In contrast, Thurik, Storey, and van Stel (2007) conclude that administrative aspects of starting a business including time, cost, pro-cedures, seem to be unrelated to entrepreneurship rates across countries. Still, their results sug-gest that minimum capital requirements necessary for business start-up significantly lower busi-ness activities and hence inventive efforts.
Further, innovation is stimulated by a stable political environment as it mitigates uncertainty about doing business (Busenitz, Gomez, & Spencer, 2000; Khedhaouria & Thurik, 2017). Ar-guing in reverse, political instability provokes uncertainty and mistrust in the integrity of the political system and its actors. Uncertainty and mistrust prevent individuals from engaging in
12 triple helix collaborations being cooperation between government, business and higher educa-tion as well as it inhibits foreign investment. Both aspects are crucial to foster the innovaeduca-tion system as pointed out by Allard, Martinez, and William (2012). As such, the authors conclude that political instability, measured as the likelihood that the government will be destabilised or overthrown by unconstitutional or violent means, has a statistically significant and negative effect on different measures of the national system of innovation including patenting intensity. Conversely, Waguespack, Birnir, and Schroeder (2005) find that political stability increases patenting activity, specifically investigating the effect of national political institutions in Latin America and the Caribbean. In the same vein, Versakelis (2006) identifies a statistically signif-icant and positive effect of a nation’s polity on innovation productivity.
As the majority of literature illustrates that a country’s institutional framework allures business activities and entrepreneurship necessary for national innovation if it ensures intellectual prop-erty protection, business freedom and political stability, following hypotheses are formulated:
Hypothesis (1a): The stronger intellectual property rights protection is, the higher
environ-ment-related patenting output.
Hypothesis (1b): The more favourable conditions for starting a business are, the higher
envi-ronment-related patenting output.
Hypothesis (1c): The more stable the political environment of a country is, the higher
13
2.2.2 Human Capital & Research
In line with the NIS perspective, literature nowadays widely emphasises the importance of hu-man capital and research development for innovation (Lee, Nam, Lee, & Son, 2016; Lin, 2014). This is because especially R&D institutions and education enhance knowledge creation which is in turn critical for innovation activity (Dutta, Lanvin, & Wunsch-Vincent, 2018; Khedhaouria & Thurik, 2017). In terms of R&D factors, previous literature (Fu & Yang, 2009; Furman & Hayes, 2004; Furman, Porter, & Stern, 2002; Hu & Mathews, 2005, 2008; Krammer, 2009; Shapiro, 2014; Versakelis, 2006) agrees that general R&D funding is a relevant determinant of national innovative capacity because it improves the quality of research institutions which in turn enhances the creation and assimilation of knowledge (Furman, Porter, & Stern, 2002). In that sense, Furman, Porter, and Stern (2002), Furman and Hayes (2004), Fu and Yang (2009), as well as Hu and Mathews (2005, 2008), find that national R&D expenditure proxied by ex-penditures in all sectors positively and significantly affects international patenting activity. Similarly, Versakelis (2006) supports these findings through a statistically significant coeffi-cient of R&D expenditure intensity measured as the ratio of research and development expend-itures, public and private, over GDP. Taking a more detailed view on R&D expenditures as a driver of national innovation, however, it becomes apparent that even though existing literature agrees on a significant influence of total expenditures on R&D, it provides contradicting results when splitting the indicator into public- and private R&D funding, respectively. This differen-tiation should be considered when analysing innovation drivers (Krammer, 2009) since it pro-vides more profound insights into the effectivity of R&D funding sources. For example, Hu and Mathews (2005) emphasise a subtle, though important finding that distinguishes them from Furman, Porter, and Stern (2002), Furman and Hayes (2004), as well as from Fu and Yang (2009). They specifically find public R&D expenditure to significantly explain international patenting activity and deem this part to be more important than private R&D expenditures.
14 Literature on R&D funding by the private sector pertains to conditions of business sophistica-tion and will be discussed in Secsophistica-tion 2.2.5.
Apart from R&D considerations, literature within the NIS perspective points to educational factors having a substantial influence on national inventive activity (Fadul, 2014; Khedhaouria & Thurik, 2017; Lundvall, Johnson, Andersen, & Dalum, 2002). On the one hand, it is argued that skilled human capital including scientists is considered to be the output of the education production function while being an input of the knowledge production function. Hence, a so-phisticated education system enables the development of highly skilled scientists and a well-trained workforce which in turn enhance knowledge creation (Versakelis, 2006). Education further facilitates the accumulation of a national pool of entrepreneurs who, in order to stay competitive, strive for innovation, new products and production processes. On the other hand, Furman, Porter, and Stern (2002) argue that the importance of education for innovation be-comes manifest in sophisticated and quality-sensitive local customers. Customers are presumed to be more demanding for qualitative products and services if they are well-educated and demonstrate high cognitive abilities. However, little emphasis has been devoted to empirical testing of human capital development as a predictor of innovation (Versakelis, 2006). Delving deeper into the influence of public expenditures, contemporary literature (Furman & Hayes, 2004; Furman, Porter, & Stern, 2002) ascertains diverse results regarding public education ex-penditure. Furman, Porter, and Stern (2002), for instance, observe significant increases in pa-tents dependent on public spending on secondary and tertiary education. This is in line with findings of Furman and Hayes (2004) who make use of the same variable operationalisations. In contrast, Hu and Mathews (2005), Krammer (2009) and Fu and Yang (2009) do not detect a statistically significant effect of higher education expenditure on the number of patents granted by the USPTO. In place of employing financial inputs of education production, Versakelis (2006) examines the effect of education quality, being the output of education production. He
15 concludes that a higher quality of education measured by student’s scores on internationally organised competitions has a positive impact on inventive activity. Additionally, Castellacci and Natera (2013) find that tertiary education as measured by tertiary enrolment ratio has a positive and significant effect on technological output proxied by the number of patents regis-tered at the USPTO.
Furthermore, there seems to be broad agreement concerning the effect of aggregate employed science and technology personnel on countrywide innovation activity among existing research as this is crucial for knowledge production (Fu & Yang, 2009; Furman & Hayes, 2004; Furman, Porter, & Stern, 2002; Hu & Mathews, 2005, 2008; Lee, Nam, Lee, & Son, 2016; Maietta, 2015). That is, the number of patents granted by the USPTO, whether lagged by three years or not, is significantly and positively impacted by the number of full-time equivalent scientists and engineers in all sectors (FTE S&E) (Fu & Yang, 2009; Furman & Hayes, 2004; Furman, Porter, & Stern, 2002; Hu & Mathews, 2005, 2008). Similarly, Maietta (2015) concludes that the num-ber of researchers positively impacts product innovation, applying a multi-probit regression. Particularly examining drivers of technological innovation in the ICT sector and applying fixed effects regression models, Lee, Nam, Lee, and Son (2016) also find a significantly positive impact of research personnel on national innovative activity.
Based on the foregoing discussion, showing that the majority of existing literature finds evi-dence for a significantly positive association between particular human capital factors and na-tional innovation activity, the following hypothesis is posited:
Hypothesis (2): The higher (a) public R&D expenditure, (b) public education expenditure and (c) the number of research personnel is, the higher environment-related patenting output.
16
2.2.3 Infrastructure
National inventive activity is further facilitated by a country’s well-developed infrastructure (Dutta, Lanvin, & Wunsch-Vincent, 2018; Fagerberg & Srholec, 2008). While research in this field is not yet extensive (Khedhaouria & Thurik, 2017), existing studies specifically point to the importance of energy infrastructures (Castellaci & Natera, 2013) and communication infra-structures (Lee, Nam, Lee, & Son, 2016) for national innovation. The reason is that they enable the production and diffusion of knowledge essential for national innovation capability (Khedhaouria & Thurik, 2017). In this sense, Castellacci and Natera (2013), examining long-run relationships between general infrastructure measures and technological output, find that high levels of electricity consumption are significantly and positively associated with a large number of patents registered at the USPTO. Merely considering the general infrastructure di-mension in terms of electricity output, however, their study makes no attempt to include other infrastructure conditions. Dutta, Lanvin & Wunsch-Vincent (2018) suggest information and communication technologies access to play a role in determining innovation performance. ICTs reduce the cost of accessing information and enable to diffuse it more widely through internet use (Fadul, 2014; Khedhaouria & Thurik, 2017; OECD, 2012). In this respect, Lee, Nam, Lee and Son (2016) detect a statistically significant impact of broadband network infrastructure measured by the number of broadband subscribers on the number of ICT patent grants.
Based on findings of existing literature, the following hypotheses are formulated:
Hypothesis (3a): The greater electricity consumption is, the higher environment-related
pa-tenting output.
17
2.2.4 Market Sophistication
In keeping with the NIS perspective, a country’s capability to innovate, further, depends on particular market conditions (Dutta, Lanvin, & Wunsch-Vincent, 2018; Khedhaouria & Thurik, 2017). That is, national market scale, access to international markets (Fagerberg & Srholec, 2008) and availability of financial resources to the private sector (Filipetti & Archibugi, 2011) are critical factors for companies to prosper and, thus, for national inventive activity to occur (Dutta, Lanvin, & Wunsch-Vincent, 2018). By measuring a nation’s gross domestic product (GDP), many authors provide a useful variable operationalisation for market scale which is a valid indicator for economic and social health and measures a country’s income level. Thereof, it is argued that high levels of GDP foster a country’s innovation capability and maintain the production and commercialisation of innovation and technological accumulation (Castellacci & Natera, 2013). There is an explicit agreement among researchers with respect to a statistically significant and positive association between high levels of national GDP whether proxied by Gross Domestic product in billions of purchasing power parity (PPP)-adjusted 1985 (Furman, Porter, & Stern, 2002) –,1990 (Hu & Mathews, 2005) -, or 2000 US dollar (Furman & Hayes, 2004). Additionally, Furman and Hayes (2004) in accord with Hu and Mathews (2005), Fu and Yang (2009) and Castellacci and Natera (2013) discover a statistically significant and positive relationship between a country’s income level as measured by GDP per Capita. Hu and Mathews (2008), though, find an insignificant association between GDP per Capita and the number of utility patents.
Moreover, literature highlights the fact that openness to international trade stimulates national inventive activity since it, firstly, enables technology transfers in the form of spillovers (Fager-berg & Srholec, 2008; Fu & Yang, 2009; Khedhaouria & Thurik, 2017). Secondly, it may in-tensify competition which forces domestic companies to innovate. Thirdly, market extension caused by exporting may result in incentives for innovation as returns on R&D investments can
18 be increased (Fu & Yang, 2009). Furman, Porter, and Stern (2002) as well as Hu and Mathews (2005, 2008), both detect evidence for a significantly positive and economically relevant impact of openness to international trade and investment on national innovative capability. In the same vein, measuring openness to international trade by trade intensity, Castellacci and Natera (2013), Furman and Hayes (2004), and Krammer (2009) agree with authors mentioned above in that trade intensity positively affects patenting activity. Finally, Lee, Nam, Lee, & Son (2016), although only focusing on ICT goods exports, identify a statistically significant impact on ICT innovation in their one-year lag model. It is to mention, however, that there is no statis-tical significance identified with regard to their no-lag model.
Further, being part of market conditions, a robust financial system is essential for high levels of national innovation performance (Filippetti & Archibugi, 2011) as it ensures the availability of credit and with it required resources for firms to engage in innovation activities (O’Sullivan, 2005). It becomes apparent, though, that none of the aforementioned authors includes this as-pect in their analyses. Girma, Gong, and Görg (2008) examine innovation activity in China and find that companies with good access to domestic bank loans exhibit a higher rate of inventive outcomes compared to firms having limited access.
Forgoing discussion reveals that the majority of literature finds evidence for a positive associ-ation between a country’s innovassoci-ation performance and market scale or internassoci-ational trade, re-spectively. Moreover, existing research suggests credit availability to have a positive impact on national innovation. Accordingly, the following hypotheses are formulated:
Hypothesis (4a): The larger the market scale of an economy is, the higher environment-related
19 Hypothesis (4b): The more open an economy is to international trade, the higher
environment-related patenting output.
Hypothesis (4c): The better the availability of credit to the private sector is, the higher
envi-ronment-related patenting output.
2.2.5 Business Sophistication
Dimensions of knowledge workers and the absorptive capacity of businesses pertain to the final condition that determines national inventive activity (Dutta, Lanvin, & Wunsch-Vincent, 2018; Khedhaouria & Thurik, 2017). Following Fu and Yang (2009) the importance of the private sector for innovation becomes manifest not only in financing and creating innovation ideas but also in the ability to commercialise them. As Section 2.2.2 proposes, human capital and research are decisive predictors of innovation. The knowledge worker dimension goes one step further as firms by themselves strengthen their innovation potential by employing and developing qual-ified personnel (Dutta, Lanvin, & Wunsch-Vincent, 2018). Indeed, literature agrees that busi-ness R&D funding facilitates the creation of knowledge workers which in turn is necessary for national innovation. In that sense, Hu and Mathews (2005) coincide with Furman, Porter and Stern (2002) when it comes to the proportion of private R&D expenditures in relation to total R&D expenditures. Both studies find R&D expenditures funded by industry over total R&D to enter positively and significantly. Similar outcomes are validated by Furman and Hayes (2004), Fu and Yang (2009) as well as Natario, Couto, Tiago and Braga (2011) who use cluster analysis and apply the European Innovation Scoreboard as a proxy for innovation activity in opposition to precedent research. Extending the work of Furman, Porter and Stern as well as of Hu and Mathews (2005), Hu and Mathews (2008) support those findings saying that private R&D fund-ing positively and significantly influences innovation capability.
20 Considering the absorptive capacity of businesses, domestic innovation activity is stimulated by inward foreign direct investment (FDI) which is an investment in a domestic company by a foreign entity or individual with a lasting management interest of at least ten per cent in the form of mergers and acquisitions for instance. They enable the collection and diffusion of new knowledge through positive spillovers of the host country (Fu and Yang, 2009; Krammer, 2009). Aggregating inward FDI in globalisation factors, Krammer (2009) finds that FDI inflows have a significantly positive effect on patenting activity. Similarly, Girma, Gong, and Görg (2008) conclude that inward FDI at the sectoral level is positively associated with domestic innovative activity. Fu and Yang (2009), though, do not find a statistically significant impact of openness to FDI measured by the ratio of FDI to GDP on patenting.
As the majority of literature suggests national innovation activity to be positively impacted by private R&D funding and inward FDI, respectively, the following hypothesis is formulated:
Hypothesis (5): The higher (a) private R&D funding and (b) inward foreign direct investment
is, the higher environment-related patenting output.
3. Methodology
While preceding section provides an overview of the theoretical background and findings of existing research, this section aims at delivering insight into the empirical design chosen to answer previously developed hypotheses and, thus, the research question of what factors drive environmental-related innovation. For this reason, empirical models, sample, measures, as well as the analytical strategy are elucidated and justified.
21
3.1 Empirical Specification
Literature has formulated different models that try to assess certain effects on the determination of innovation activity. This study aims to consolidate the effects into a single and comprehen-sive framework based on five conditions as outlined above. Corresponding to the literature structure of the preceding section, the model of interest is developed. Due to the fact that the majority of previous literature has predominantly paid attention to institutional- as well as hu-man capital conditions, appropriate factors conjointly build the base model. Subsequent models are specified, gradually incorporating factors on infrastructure-, market sophistication- and business sophistication conditions in order to explain the effect on environmental innovation output. Individual factors are chosen in accord with previously developed hypotheses and de-pendent on data availability. At the same time, the study accounts for a time lag between initial idea production and final reflection in patents which is in line with previous research (Fu & Yang, 2009; Hu & Mathews, 2005, 2008; Lee, Nam, Lee, & Son, 2016). As such, specifications are developed using 2-year lagged independent variables. Starting with institutional- as well as human capital and research factors, the study formulates Model (1) for country i at time t as follows:
!"#$ − &'("&)*+, = α + 1234#5+,67 + 17389:$;<<+,67 + 1=3#>!?@AB+,67 + C23#9B!5D+,67 +
C73#<;:5D+,67 + C=3&E?ℎA;<+,67 + e+, (1)
where a and e+, denote the individual effect for country i and the residual value, respectively. Environmental innovation output is proxied by "#$ − &'("&)* which is the dependent var-iable designating the number of Triadic Patent Families in selected environment-related tech-nologies. In regard to the right-hand side of the equation intellectual property rights IPR, busi-ness freedom BusFree, and political stability PolStab represent institutions of a country’s reg-ulatory-, business-, and political environment, respectively. Factors of R&D financed by the
22 public sector PublRD, aggregate research personnel PersRD, and expenditure on education
Ed-Share conjointly cover human capital and research conditions. Model (1) serves as a base model
and is augmented by factors of general infrastructure conditions next. Consolidating individual factors of Model (1) in vectors by using matrix notation, the study formulates Model (2) as follows:
!"#$ − &'("&)*+, = α + 1´ H+,,67JKLM + C´ (+,,67NOP + Q23R<S4ST;+,67 + Q734)"4ST;+,67 + e+, (2)
where vector HJKLM includes institutional factors IPR, BusFree, and PolStab and vector (NOP incorporates PublRD, PersRD, and EdShare. General infrastructure GenInfr in terms of elec-tricity consumption and broadband network infrastructure ICTInfr designate infrastructure con-ditions. Subsequently, Model (2) is expanded adding general market concon-ditions. As such, the study formulates Model (3) as follows:
!"#$ − &'("&)*+, = α + 1´ H+,,67JKLM + C´ (+,,67NOP + Q´ U+,,67JKVW + X23RD#)AY+,67 + X73ZY<SS<::+,67 +
X=3);<E[@+,67 + e+, (3)
where vector UJKVW encompasses GenInfr and ICTInfr. Infrastructure variables are followed by general market sophistication conditions including Gross Domestic Product per Capita
GDPCap, openness to international trade ZY<SS<:: and credit availability to the private sector, );<E[@. Finally, Model (3) is extended by incorporating factors regarding business sophistica-tion condisophistica-tions as well as an addisophistica-tional control variable resulting in Model (4) as follows:
!"#$ − &'("&)*+,= α + 1´ H+,,67JKLM+ C´ (+,,67NOP+ Q´ U+,,67JKVW+ X´ \+,,67P]W^+ _73#;[`5D+,67+ _=3$D4+,67+
23 where GDPCap and Openness are covered by vector \P]W^. Private R&D expenditure #;[`5D and inward foreign direct investments $D4 constitute business sophistication conditions. In line with previous research, the analysis additionally controls for cross-country differences in edu-cational level Edlevel as it is assumed to impact national productivity and efficiency of a coun-try’s absorptive capacity (Krammer, 2009). Specifically, higher education levels improve the productivity of innovation production (Engelbrecht, 2002; Krammer, 2009) which is the reason that EdLevel is expected to carry a positive sign. Expected signs of the remaining coefficients for Model (1) to (4) are derived from the discussion of the previous section and reported in Appendix G. Containing factors of all five innovation conditions, Model (4) is expected to ex-plain more of the variation in Triadic Patent Families in selected environment-related technol-ogies compared to previous models.
Due to the fact that the distribution of TPF-ENVTECH is positively skewed, the variable enters in logarithmic form for all models, normalising its distribution. This transformation handles the non-linear relation existing between response variable and regressors as the logarithm makes the effective relationship non-linear while preserving the linear model. Apart from controlling the skew, problems of heteroskedasticity and serial correlation are countered. Moreover, inde-pendent variables enter in standardised form for all models by subtracting the mean from each observation and dividing it by the standard deviation. This produces standardised regression coefficients or beta coefficients, respectively, having a mean of zero and standard deviation of one. Reason for this lies in the fact that independent variables are measured on different scales. With beta weights, the variables are put on a common scale counteracting potentially small coefficients approaching zero and thus aiding the interpretation of coefficients.
24
3.2 Data Description
In order to empirically investigate the effect of macro-level factors on national environmental innovation activity, the thesis refers to a fixed panel of 28 OECD countries concerned over the period 1998 to 2013. Table 1 lists all countries that have been incorporated into the analysis. Using secondary data, a longitudinal dataset is employed which is arranged in the long form (pooled dataset) and covers a total of 7168 observations. It is constructed from OECD Main Science and Technology Indicators (MSTI), World Bank comprising World Development - and World Governance Indicators, Heritage Foundation, and UN Human Development Reports. Appendix C provides definitions and sources for all variables under investigation. Pairwise correlations are reported in Appendix D. Descriptive statistics of employed variables including measures of central tendency (means), dispersion (standard deviations), minimum and maxi-mum, as well as number of cases are reported in Appendix E. It becomes apparent that countries incorporated in the analysis hold on average 56 Triadic Patent Families in selected environ-ment-related technologies. The highest number of environmental TPFs amounting to 745 can be attributed to Germany in the year 2001. Generally, the data reveals an upward trend of TPFs in environment-related technologies peaking in 2010 with a total of 2267 patent families. Until 2013, the number slightly drops to around 1800 TPFs. However, data reveals fluctuations in eco-innovation output for individual countries over time. The focus on OECD countries and the timespan up to and including the year 2013 are generally justified by data availability. Typi-cally, data on potentially useful indicators tend to be more comprehensive for advanced- op-posed to developing markets (Fagerberg & Srholec, 2008; Khedhaouria & Thurik, 2017). Cor-respondingly, the dataset contains 24 countries which are considered advanced-, and four coun-tries deemed as being developing economies according to the International Monetary Fund’s (IMF, 2018) World Economic Outlook Database. Eighteen countries are members of the Euro-pean Union. Further, TPF data is particularly available up to and including 2013. Reason for that is an average five-year time lag between the priority date which is the first date of filing a
25 patent application and the publication date at which information about the invention is disclosed to the general public (OECD, 2009). Still, not all data sources provide a complete set of obser-vations for the countries and period of interest. On this account, datasets were matched employ-ing linear interpolation- and extrapolation technique usemploy-ing Excel VBA trend analysis which results in a strongly balanced panel. In the following sub-sections, variables of interest are dis-cussed elaborately.
Table 1: Sample Countries
Australia Austria Belgium Canada Czech Republic Denmark Estonia Finland France Germany Greece Hungary Iceland Ireland Israel Italy Korea (R.O.K.) Luxembourg Mexico Netherlands Norway Poland Portugal Slovak Republic Spain Sweden Turkey United Kingdom 3.1.1 Dependent Variable
To proxy environmental innovation output, a variable is employed based on the number of Triadic Patent Families in selected environment-related technologies (TPF-ENVTECH). It is defined as a set of patents associated with environmental pollution, water scarcity, and climate change mitigation taken at the European Patent Office, Japan Patent Office, and United States Patent and Trademark Office that share one or more priorities (Dernis & Khan, 2004). The focus of the research is on visible commercialisable innovations as international patenting rates are generally deemed to be “the only observable manifestation of inventive activity with a well-grounded claim for universality” (Trajtenberg, 1990, p. 183). That is, in line with previous au-thors (Furman & Hayes, 2004; Furman, Porter, & Stern, 2002; Krammer, 2009), patents are the most expedient measure to compare innovative output across countries and over time. They are advantageous as data firstly is quantitative and, thus, generally applicable to statistical analyses.
26 Secondly, they are commensurable as patents rely on objective standards. Thirdly, patent data can be disaggregated into specific technology fields. Combined, these advantages form an ap-propriate basis for this research which aims at empirically testing environmental innovation output across countries.
However, patent counts are not exempt from limitations in providing internationally compara-ble indicators of technology performance. Firstly, there is no filter on patent’s quality meaning that individual patents vary widely in commercial value. In fact, the value distribution within a single patent office is skewed as the number of low-value patents (having limited industrial application) exceeds the number of patents with substantial value (Dechezleprêtre, Ménière, & Mohnen, 2017; OECD, 2009; Popp, 2005). Secondly, a home advantage bias occurs when tak-ing patent counts from individual patent offices (Criscuolo, 2006; Haščič, Silva, & Johnstone, 2015) because inventors usually file for protection in their home country first before filing at foreign patent offices. Specifically examining the USPTO and EPO, Criscuolo (2006) provides evidence for the effect: proportionate to their inventive activity, domestic applicants tend to file a larger quantity of patents with the PTO in their home country than foreign applicants do.
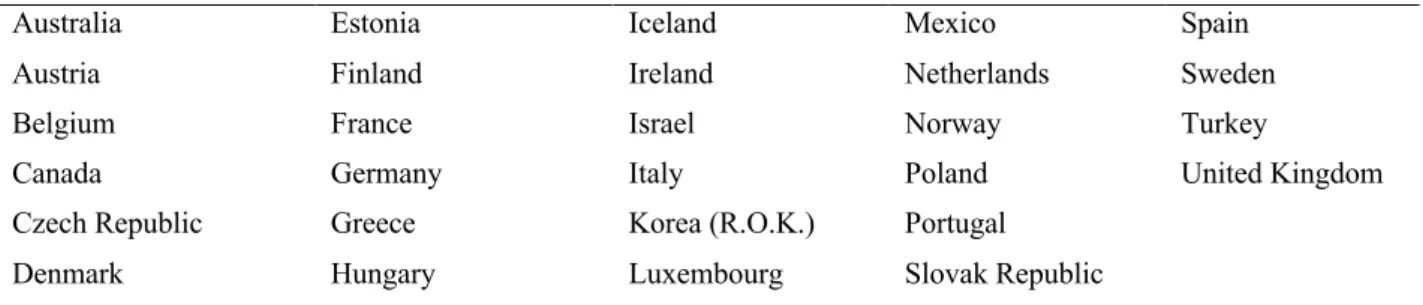
Figure 2. Country shares of patents applied for at the EPO, patent grants by the USPTO and Triadic Patent Families, for the year 1999. Adapted from “Triadic Patent Families Methodology,” by H. Dernis and M. Khan, 2004, Technology and Industry Working Papers, OECD Publishing.
17,4 26,6 20,6 27,8 34,0 52,6 46,5 32,4 15,9 8,3 7,0 10,9 0% 10% 20% 30% 40% 50% 60% 70% 80% 90% 100% EPO TPF USPTO
Country shares of patents applied for at the EPO, patent grants by the USPTO and Triadic Patent Families, for priority year 1999
27 Figure 2 depicts this effect by providing country shares of patents applied for at the EPO, patent grants by the USPTO and Triadic Patent Families, for the year 1999. It can be seen that in 1999 the majority of countries (46,5%) applying for patents at the EPO are European countries. Sim-ilarly, the majority of patents the USPTO (52,6%) were granted to the United States in 1999.
Since historically published patent statistics typically refer to counts of patents applications to a single patent office, previous research tries to mitigate a potential home bias effect by omitting data from the analysis. In particular, past studies (Furman & Hayes 2004; Furman, Porter, & Stern, 2002; Krammer, 2009) predominantly use the number of patents granted by the USPTO but only to inventors from a particular country other than the U.S. as the dependent variable. This approach is not presumed to be the optimal solution since meaningful insights for identi-fying significant innovation drivers are not taken into consideration if data is omitted. Hence, this research refers to patent families which are sets of patents taken in various countries and protecting the same invention (Haščič & Migotto, 2015; OECD, 2009). Specifically, Triadic Patent Families are utilised incorporating patent filings in the Global Triad including Europe, Japan and the U.S. as outlined above. This way, a home advantage bias is resolved as shown by Criscuolo (2006) without causing data loss of specific countries and international compara-bility is eventually improved (Baudry & Dumont, 2006, p. 208). The application of TPF further mitigates the first limitation by facilitating data to be limited to more high-value patents than being present in patent counts from single PTOs (Criscuolo, 2006; Popp, 2005). The reason lies in the self-selection process. Indeed, additional expenses incur when filing patents at multiple patent offices, suggesting that inventors who are willing to bear those costs anticipate their patents to be of high practical value (Popp, 2005). Harhoff and Reitzig (2001) and Lanjouw and Schankerman (2001) provide evidence for patents generally being of higher value if they are member of families than those filed at a single PTO. Further, TPF data implicates the advantage that it can be disaggregated into specific technology fields which, in accord with the purpose of
28 this thesis, allows to explicitly focus on patent data of selected environment related technolo-gies. OECD search strategies for patent data of ENVTECH cover a total of 80 technological fields ranging from traditional environmental management domain such as air- and water pol-lution to mitigation of biodiversity threats and climate change (Popp, 2005). Fractional counts are used to allocate respective contributions of countries and avoid double counting if there are multiple inventors with different nationalities for the same patent (Dernis & Khan, 2004). That is, a patent co-invented, for instance, by one Dutchman and two Germans will be counted as 1/3 for the Netherlands and 2/3 for Germany. Hence, the dependent variable used becomes manifest in non-discrete (continuous) count data truncated at zero.
3.1.2 Independent Variables
The first set of explanatory variables pertains to a country’s institutional framework. Both var-iables Intellectual Property Rights IPR and Business Freedom BusFree, conjointly covering the regulatory- and business environment, are extracted from Heritage Foundation. IPR measures the degree to which national laws protect intellectual property rights on the one hand and the extent to which government supervision enforces them on the other. BusFree measures the government’s efficiency in regulating business activities. The indicator is based on ten factors regarding the difficulty of starting, operating, and closing a business. Scores of both variables are structured on a scale from 0 to 100, with higher numbers indicating higher certainty of legal protection and a larger extent of business freedom, respectively.
In view of the political environment, data on political stability, PolStab, captures the perceived probability of profound political disruptions and is retrieved from World Bank’s World Gov-ernance Indicators. More precisely, the indicator is derived from a variety of surveys and ag-gregated into a standardised measure of a nation’s overall political stability. It ranges from -2.5 to +2.5 with higher values indicating superior political stability. The second set of variables
29 covers human capital and research conditions. The first two R&D related explanatory variables,
PublRD and PersRD stem from OECD Science and Technology Indicators. Percentage of gross
expenditure on R&D financed by the government is covered in Public R&D Expenditure,
Pub-lRD, and calculated by public expenditure in R&D divided by total R&D expenditures.
Re-search personnel in R&D, PersRD, describes the number of reRe-searchers engages in R&D as per millions of people. Lastly, education expenditure, EdShare, is retrieved from World Bank. It encompasses government expenditure on education expressed as a percentage of GDP.
Similarly, infrastructure variables in terms of general infrastructure GenInfr and broadband net-work infrastructure ICTInfr, are gathered from World Bank Group. GenInfr constitutes a meas-ure of electric power consumption produced by power plants and combined heat and power plants in kilowatt-hour divided by midyear population. ICTInfr measures the number of fixed broadband subscriptions to high-speed access to the public internet (TCP/IP connection).
Market sophistication predictors incorporate a measure of overall market scale. Following Fur-man and Hayes (2004), Hu and Mathews (2005), Fu and Yang (2009) and Castellacci and Natera (2013), market scale is measured by GDPCap, which becomes manifest in Gross Do-mestic Product per capita in PPP current international dollars in millions and extracted from World Bank’s World Development Indicators. Openness to international trade, Openness, is measured by exports plus imports divided by GDP. Data is gathered from World Bank (WDI) which is also the case for credit availability, Credit. Credit is defined as financial resources provided to the private sector by financial corporations as a percentage of GDP.
Finally, business sophistication conditions become manifest in private R&D expenditures,
30 from OECD MSTI and provides the percentage of GERD financed by the business enterprise sector. FDI net inflows in current US dollars are extracted from World Bank Group.
3.1.3 Control Variables
National education level, EdLevel, is proxied by mean years of schooling which is defined as the average number of years of education in the population aged 25 and older and gathered from United Nations’ Human Development Reports. The variable is based on the widely used indi-cator of educational attainment level from Barro and Lee (2013).
3.3 Estimation Method
Having defined explanatory variables included in the models previously developed, the covari-ates are checked for multicollinearity using variance inflation factors (VIFs) in a next step. This is because high correlations suggest that two variables are measuring the same variance and will over-inflate R-squared. If so, only one variable is needed. VIF values of the particular independent variables range from 1.26 to 5.64 with a mean of 2.91 as reported in Appendix F. Applying commonly used threshold value of 10 for the VIFs (Burns & Burns, 2008, p.389) and a 0.8 benchmark for the strength of pair-wise correlation, results suggest no problems of mul-ticollinearity. Hence, all explanatory variables are incorporated in the regression analysis.
The five models of interest are estimated using a simultaneous fixed effects regression con-ducted via StataSE 14. It is the nature of the underlying model that determines the appropriate regression type to be used. In particular, the results of the F-Test, Breusch and Pagan’s (1980) Lagrange Multiplier (LM) Test and Hausman (1978) Test justify fixed effects regression for the longitudinal data as will be discussed in the following paragraph.
31 In the first instance, the existence of fixed effects is tested by the F-Test and based on loss of goodness-of-fit. The underlying null hypothesis predicates that all observed and unobserved fixed effects 9+ are equal to zero. Results provide evidence that the null hypothesis can be re-jected, suggesting that there is a significant fixed effect or a significant increase in goodness-of-fit in the fixed effect model. Consequently, a fixed effect model should be preferred over a pooled Ordinary Least Squares (POLS) model. Secondly, to examine the existence of random effects, Breusch and Pagan’s Lagrange Multiplier (LM) Test is used. In this case, the null hy-pothesis states that individual or time specific variance elements are equal to zero. Results are suggestive of rejecting the null hypothesis and indicate that a significant random effect is pre-sent in the data. That is, a random effects model should be preferred over a pooled Ordinary Least Squares model since it allows for superior treatment of heterogeneity compared to POLS model. Thirdly, in order to investigate if a fixed- or random effects model is more appropriate for the analysis, the Hausman (1978) Test is employed which is based on the difference between the random- and fixed effects estimates. While the F-test denotes that at least one group or time specific intercept 9+ is not equal to zero, it might be the case that these fixed effects are yet uncorrelated to the regressors (Hausman, 1978). The null hypothesis of the Hausman Test states that the difference in coefficients is not systematic in that there is no correlation between the unique errors and the explanatory variables. Results provide evidence of rejecting the null hy-pothesis meaning that the difference in coefficients is systematic. Hence, it can be reasoned that a fixed effects estimation serves as a more appropriate method than a random effects estimation for the analysis (Wooldridge, 2002, p. 288). Respective p-values of all three tests are reported in Table 2 together with the results of the estimation.
In order to ascertain that proposed estimates are efficient and standard errors are not biased, appropriate diagnostic tests are conducted. A modified Wald statistic which handles the viola-tion of the normality assumpviola-tion is calculated to test for group-wise heteroskedasticity in the
32 idiosyncratic errors of the fixed effects regressions following Greene (2000, p. 598). Evidence is provided that the null hypothesis of homoskedasticity or homogeneity of variance, respec-tively, can be rejected for all models. Causing bias in the standard errors, the absence of ho-moskedasticity can invalidate statistical significance tests (Hoehn, Schuberth, & Steiner, 2014). Even though not necessarily problematic in the panel at hand which can be defined as a micro panel covering a short time period under 20 years, serially correlated idiosyncratic errors may further cause standard errors of the fixed effects estimators to be understated and higher R-square as shown by Bertrand, Duflo, and Mullainathan (2004). To examine serial correlation in the residuals, a test proposed by Wooldridge (2002, p. 274) is employed. Results give evidence that the null hypothesis of no first-order autocorrelation cannot be rejected for all models. Fur-ther, as the panel is characterized by small T and large N, a postestimation test described by Pesaran (2015) is employed to test residuals for weak cross-sectional dependence. The under-lying null hypothesis stating that residuals are weakly cross-sectional dependent can be rejected for all models. Even though serial correlation seems not to be a problem, cluster robust covari-ance estimators treating each country as cluster are used to correct for heteroskedasticity as proposed by Wooldridge (2013, p. 483). Diagnostic test results are reported in Table 2.
4. Results
Having justified the choice of the empirical estimation, results of the fixed effects regressions using cluster robust estimators will be discussed in this section. The respective results of Model (1), (2), (3), and (4), are reported in Table 2.
33
4.1 Main Empirical Results
As previously indicated, the study aims to provide a comprehensive framework in terms of innovation dimensions as proposed by theory of the national innovation system perspective. The majority of previous literature has predominantly brought into focus institutional- and hu-man capital conditions to empirically explain innovation activity. In order to determine whether the addition of factors relating to infrastructure-, market sophistication- as well as business so-phistication conditions provides an improvement in predicting environmental-related innova-tion activity, individual independent variables enter cumulatively in the regression using Model (2), (3), and (4).
Investigating the estimation results in consideration of R-squared, the development of Model (4) being derived from preceding models unveils a considerable improvement of general fit. As conditioned by the properties of the fixed effects estimation it is the R-squared within level which is an ordinary R-squared and of main interest in the light of the study’s research problem. Being more precise, the study aims to elucidate factors causing time series variation within individual countries. Accordingly, R-squared within describes the explanatory power of the independent variables after partialling out the fixed effects. Model (1) produces a within 57 = 9.4% which is significantly different from zero (F = 4.57, p = 0.003) suggesting that the model accounts for approximately 9.4 per cent of total variance within the panel units. Adding infra-structural factors, Model (2) generates a within 57 = 10.6% again being significantly different from zero (F = 4.23, p = 0.002.). Individual factor importance of each condition can be assessed by comparing values of within R-squared with the particular forgoing estimation that does not include these factors. In this way, contrasting Model (2) with Model (1), R-squared within raises by 0.012, suggesting that infrastructure measures account for approximately 11.3 per cent of within variation in Model (2). Model (3) produces a within 57 = 15.5% which is significantly different from zero (F = 5.42, p = 0.000). Similarly, opposing Model (3) to Model (2), within