A R T I C L E
Mapping and Explaining the
Use of the Left-Right Divide*
André Freire
Department of Political Science and Public Policies and Centre for Sociological
Studies and Research, Lisbon University Institute, Portugal
Kats Kivistik
Institute of Government and Politics, University of Tartu, Estonia
This study is about mapping and explaining the use of the Left-Right di-vide across 14 countries from 5 Continents and relies on the richness of the post electoral mass surveys from the Comparative National Election Project: 14 coun-tries and 18 elections spread over 5 continents. The paper shows not only how extensively the LR divide is used in these 14 countries, but also explains varia-tion across both individuals and countries in terms of the factors determining LR recognition and use. Overall, it is shown that, although seen world-wide, the LR divide (both for self-placement and party placement) is more present in long con-solidated and middle-aged democracies and countries with freer media systems than in new democracies and societies with less free media systems. In the case of parties LR placement, party size also counts: larger parties are more easily placed. Additionally, we also show that LR recognition is more socially and politically determined in long consolidated and middle-aged democracies and in countries with more freedom of the press than in new democracies and in systems with less free media system. These findings add to the existing knowledge about these top-ics because previous studies were either country/Continent specific, or, if global in nature, never invested in explaining individual and system variation across 14 from 5 Continents. Besides, these findings mean that in the long term probably the new democracies will converge with the long consolidated or middle-aged ones, but this is an empirical question to be researched in future studies.
Keywords: Left-right; America; Europe; Africa; Asia.
* The data necessary to reproduce numerical results can be found in http://bpsr.org.br/files/
Introduction
A
fter the French Revolution, the idea of a left-right (LR) divide gained great importance in mass politics (Bobbio, 1994; Caramani, 2004; Laponce, 1981). At the individual level, the division between left and right functions as an instrument to reduce the complexity of the political universe; at the systemic level, it functions as a code of communication (Fuchs and Klingermann, 1990).In spite of all the theories about the “end of ideology” (Aron, 2002; Bell, 2000; Lipset, 1987), the “end of history”(Fukuyama, 1989) and about a certain overcoming of the division between left and right(Giddens, 1996), the truth is that these same theories have been shrouded in an ideological character and, soon after being defended, have been followed by the appearance of new ideological forms or a renewed prominence of the “old” ideologies(Heywood, 2003). Furthermore, various studies have documented the remain-ing (or even increasremain-ing) importance of electors’ positions on the LR (or liberal-conserva-tive in the US and some other countries) scale as a defining factor for their voting choices in several regions of the world: in long consolidated democracies in Europe and North America (Franklin et al, 1992; Gunther and Kuan, 2007; Gunther and Montero, 2001; Van der Eijk et al, 2005), in new/middle-aged democracies in Southern and Eastern Europe (Gunther and Kuan, 2007; Gunther and Montero, 2001; Kitschelt et al, 1999; Markowski, 1997), in Latin America (Gunther and Kuan, 2007; Luna and Zechmeister, 2010) and in at least some countries in East Asia (Jou, 2010; Lee, 2007).
Additionally, studies about mass political attitudes based on opinion surveys and other sources have shown that in «less central» parts of the world a very large majority of citizens (as well as political experts) not only recognize the LR/liberal-conservative divide, but are also able to place the political parties «correctly» on such a scale (Barnes, 2002; Colomer and Escatel, 2005; Dalton, 2006; Dalton, Farrel and McAllister, 2011; Ev-ans and Whitefield, 1998; Freire, 2006a; Gunther and Kuan, 2007; Huber and Inglehart, 1995; Jou, 2010; Kitschelt et all, 1999; Lee, 2007; Luna Zechmeister, 2010; Markowski, 1997; Noël and Thérien, 2008; Zechmeister, 2006 and 2010). Moreover, it has been shown that in several regions of the world, individual LR self-placement is also anchored in issue attitudes and value orientations (Dalton, 2006; Freire, 2006b and 2008; Freire and Belchi-or, 2011; Inglehart and Klingerman, 1976; Gunther and Kuan, 2007; Knutsen, 1997, 1998; Knutsen and Scarbrough, 1995; Lee, 2007; Luna Zechmeister, 2010; Markowski, 1997; Noël and Thérien, 2008; Zechmeister, 2006 and 2010).
ask: what relevant elements can be added to this area of knowledge? With the present study about mapping and explaining the use of the LR divide across 14 countries from five continents, we believe that we can add the following: first, we can add relevant data and interpretations given the richness of datasets from the Comparative National Election Project (CNEP I-III). The richness relies on the diversity of countries included that allows us to compare and explain variation in LR recognition and use across 14 countries from five continents, i.e., on a scale never done before (usually these type of analyses are conti-nent or country specific: Freire, 2006b and 2008; Freire and Belchior, 2011; Knutsen and Scarbrough, 1995; Lee, 2007; Luna Zechmeister, 2010; Markowski, 1997; Zechmeister, 2006 and 2010; some cross continent analyses done before map LR recognition but nei-ther explain variation across individuals nor across countries: Dalton, 2006; Gunnei-ther and Kuan, 2007; Noël and Thérien, 2008). The reader should bear in mind that CNEP I-III includes post electoral mass surveys from 14 countries and 18 elections (cases) from five continents: Europe, North and South America, Africa and Asia. We have relevant data for the present paper from the following cases included in CNEP I-III: Argentina 2007, Bulgaria 1996, Chile 1994 and 1999, Greece 1996, Hong Kong 1998, Hungary 1998 and 2006, Italy 1996 and 2006, Mexico 2006, Mozambique 2004, Portugal 2005, South Africa 2004, Spain 1996 and 2004, USA 2004, and Uruguay 1994 and 2004.2
Considering all this, we believe that we can advance scientific knowledge about the recognition and use of the LR divide across 14 countries from five continents by pursu-ing the followpursu-ing objectives: first, at the individual level, we want to know and explain how extensively the LR divide is used (LR self-placement: LR SP/ LR party placement by citizens: LR PP) in the 14 countries. Second, mostly using the two step hierarchical re-gression (multi-level modelling) approach (Achen, 2005; Jusko and Shively, 2005; Lachat, 2008), we want to explain variation across countries in terms of the factors determining LR recognition and use. These findings add to the existent knowledge about these topics because previous studies were either country/continent specific, or, if global in nature, never invested in explaining variations across individuals and countries.
But there is more about the relevance of these topics. On the one hand, this fresh CNEP I-III data will allow us to update information about the levels of LR recognition and use worldwide. But on the other, we do not know from previous studies if the structure of individual determination of LR recognition is the same worldwide or not. If it is similar (for example, if education, political interest, media exposure, and party identification work in the same direction as in Europe and North America), then the differences in overall
2 For the US in 1992 and Greece in 2004 we have information about the level of LR recognition
recognition and use between countries might be due to compositional differences in the aggregate levels of education, political interest, media exposure and party identification in the different countries, and some convergence between countries might be expected in the future when those compositional differences are reduced. But if that structure of determination is rather different, then country specific macro events should weigh more to explain LR recognition and use, and thus convergence between countries will be less probable in future. Moreover, this situation would also raise serious doubts about the pos-sibility of comparing mass use of the LR schema worldwide. We will also try to specify the impact of some macro-level factors (age of the democratic regime, freedom of media, and level of educational development) on LR recognition and use. Again, if these macro-level explanatory factors are indeed relevant to explain variations in both the overall levels of recognition and in the structure of determination, as we expect, then we should see some convergence between countries when democratic regimes (from non-Western parts of the world) become more mature, freedom of the press is more solid, and social development more advanced. This would also give indications of the heuristic value of LR for compar-ing mass political attitudes and behaviour worldwide.
We will proceed as follows: in the second section, we will review the theory about LR recognition and formulate hypotheses. In the third section, data and methods will be presented. In the fourth and fifth sections, we will analyse the questions related to LR recognition and use. We finish with our conclusions.
Theory and Hypotheses
Following Converse’s study (1964), we assume that if people recognize the labels left and right, if they are able to place themselves and parties on the LR continuum, then it is reasonable to claim that this is at least one indicator that these ideological concepts are still meaningful and valid. 3 Therefore, in order to assess the importance of LR
con-cepts, we will first analyse the levels of LR SP and how that recognition is influenced by individual and country level factors. Data from advanced Western democracies confirm, for instance, that on average LR is widely understood by almost 90% of people (Knut-sen, 1998; McAllister and White, 2007). The other regions of the world are less studied; nevertheless, the existing research supports the idea that, although usually to a variable
3 Of course, there are other indicators of the meaningfulness and validity of the LR divide. See
extent, LR is widely recognized and used by the mass publics in very different regions of the world (Barnes, 2002; Colomer and Escatel, 2005; Dalton, 2006; Evans and Whitefield, 1998; Freire, 2006a; Gunther and Kuan, 2007; Jou, 2010; Kitschelt et all, 1999; Lee, 2007; Luna Zechmeister, 2010; Markowski, 1997; Noël and Thérien, 2008; Zechmeister, 2006 and 2010).
Although it is known that the LR divide is widely recognized and used by mass pub-lics in several regions of the world, cross continent comparisons are less common (but see Dalton, 2006; Gunther and Kuan, 2007; Noël and Thérien, 2008). Moreover, none of these rather scarce “global studies” tried testing the individual-level and macro-level de-terminants of citizens’ LR recognition and use across countries from different regions of the world. It is precisely this gap we intend to fill with our paper. First, at the individual level, we want to know how extensively the LR divide in the 14 countries from the five continents under scrutiny is used. Second, at the macro level, we want to explain variation across countries in terms of the overall level of recognition and use, and in terms of the impact of the individual level determinants on LR recognition and use.
Traditionally, the recognition and utilization of the LR divide is associated with the sophistication and awareness of individual citizens – more sophisticated people under-stand these ideological labels better and in a more coherent way (Freire, 2006a; Freire and Belchior, 2011; Kitschelt and Hellemans, 1990; Zechmeister, 2006). The most popular way to conceptualize this is through education. In addition to education, a person’s political interest and age are most often said to increase the level of recognition and use of the LR divide. The more educated and politically interested people are, the more familiar they are with ideological terms, as they have more resources and motivation. Usually, other aspects being held constant, older people are more aware of political terms because they have had more time to learn them through socialization. Only in cases of regime change may this be questionable, because then one could expect young people to adjust to the new situation more quickly (Freire, 2006a). But there are still other factors that have been shown to explain LR recognition like media exposure and party identification – people with more media exposure and stronger levels of party identification are also more likely to be better informed about and/or engaged in politics and therefore are also expected to show higher levels of LR recognition and use (Freire, 2006a; Freire and Belchior, 2011; Kitschelt and Hellemans, 1990; Zechmeister, 2006). From previous findings, we have derived our indi-vidual level hypotheses:
Hypothesis on education and LR recognition: more educated people recognize and utilize the terms LR better than the less educated;
Hypothesis on age and LR recognition: others things being held constant, older peo-ple recognize and utilize the terms LR better than younger peopeo-ple.
Hypothesis on media exposure and LR recognition: more informed people recognize and utilize the terms LR better than the less informed;
Hypothesis on party identification and LR recognition: people with stronger levels of party identification recognize and utilize the terms LR better than those with weaker levels of party identification.
The problem with the latter two hypotheses is that questions about media exposure and party identification were not asked in all countries taking part in the CNEP I-III, therefore, these two additional variables will be used only in a limited way. Of course this is a common problem when we use secondary survey data but it is not necessarily an obstacle to producing good quality research (Kiecolt and Nathan, 1985), namely because the 19 cases/countries from four Continents and survey data available for them allow us to perform tests on a global scale done never before. In the present paper we will test the model with only a subset of variables (age, education, political interest) for the 19 cases/ countries (see Tables 5.1 to 5.4 below), but we will also test the full model for all the cases/ countries (13) where all variables are available (data not shown in the tables but findings mentioned in the text). Thus, there is some element of cross validation in these two types of tests and the findings are quite robust, as we will demonstrate. Moreover, regarding the explanatory factors/independent variables (age, education, political interest, media expo-sure, party identification) used to explain LR recognition and use (at the individual level), they follow the so-called “political sophistication model” and are pretty common in the literature about LR conceptualization among the mass publics (see Converse, 1964; Freire, 2006b; Freire and Belchior, 2011; Fuchs and Klingemann, 1990; Kitschelt and Hellemans, 1990; Klingemann, 1979; Zechmeister, 2006). As for the macro level explanatory variables (see below), they will be deduced from the theoretical literature cited below.
Even in competitive political environments, for individuals to identify themselves with
certain LR ideological areas, it is necessary that such political organizations and notions,
as well as the image and content that define and/or are associated with them, consolidate
their presence in the political and media arenas (Barnes, 2002; Barnes, McDonough and
Pina, 1985; Converse, 1969; Gunther and Montero, 2001; Niemi et al, 1985). Thus,
politi-cization and political intermediation are preconditions for the formation and relevance of
LR attitudes by mass publics (Beck et al, 2002; Gunther and Kuan, 2007). Moreover, the
usual instability associated with new party systems is yet another reason for a lower level
of LR recognition by citizens in new democracies (Dix, 1992; Freire, 2006a; Gunther and
Kuan, 2007; Mainwaring and Torcal, 2005; Rose and Munro, 2003).
Therefore, we expect that in long consolidated democracies and more developed
so-cieties individual level variation in terms of recognition and use of the LR divide is more
determined by education, income, political interest, media exposure, and strength of party
identification than in new democracies and less developed countries. In the latter regimes
and societies, lower levels of LR recognition are more widespread, thus more determined
by cultural, historical and political factors than by individual level factors. Thus, we derive
our macro level hypotheses:
Hypothesis on the age of democratic regime and the overall level of LR recognition
and use across countries: the longer the democratic tradition in a country (as measured by
“the numbers of years since the last democratic transition”), the higher the level of
recog-nition and utilization of the LR divide by mass publics.
Hypothesis on the age of the democratic regime and the individual level
determina-tion of LR recognidetermina-tion and use across countries: the longer the democratic tradition in a
country, the more the level of recognition and utilization of the LR divide by mass publics
is determined by individual level determinants (age, education, political interest, strength
of party identification, and media exposure).
Hypothesis on the level of social development of societies and the overall level of
LR recognition and use across countries: The more socially and politically developed a
country (as measured by “the Freedom House index of overall press freedom” and “the
percentage of people with secondary education or more”) the more the level of recognition
and utilization of the LR divide by mass publics.
Hypothesis on the level of social development of societies and the individual level
determination of LR recognition and use across countries: The more socially and
political-ly developed a country, the more the level of recognition and utilization of the LR divide
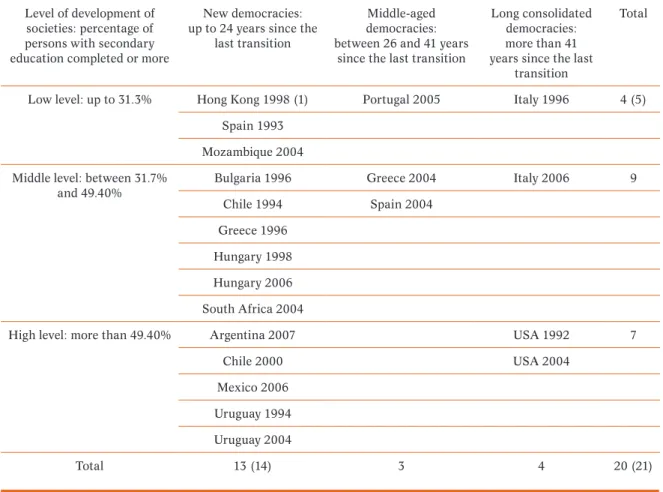
Table 1. Typology of countries in terms of age of the democratic regime and level of development
Level of development of societies: percentage of persons with secondary education completed or more
New democracies: up to 24 years since the
last transition
Middle-aged democracies: between 26 and 41 years
since the last transition
Long consolidated democracies: more than 41 years since the last
transition
Total
Low level: up to 31.3% Hong Kong 1998 (1) Portugal 2005 Italy 1996 4 (5)
Spain 1993
Mozambique 2004
Middle level: between 31.7% and 49.40%
Bulgaria 1996 Greece 2004 Italy 2006 9
Chile 1994 Spain 2004
Greece 1996
Hungary 1998
Hungary 2006
South Africa 2004
High level: more than 49.40% Argentina 2007 USA 1992 7
Chile 2000 USA 2004
Mexico 2006
Uruguay 1994
Uruguay 2004
Total 13 (14) 3 4 20 (21)
Sources:
1) Polity IV for “time elapsed since the last democratic regime transition”;
2) “Percentage of persons with secondary education completed or more” – computed from the CNEP mass surveys in each country. Notes:
1) Hong Kong is not a democracy, especially not at the time of the survey, as can be clearly seen in the Freedom House report for that country in 2002. See http://www.freedomhouse.org/template.cfm?page=363&year=2002&country=2471 (retrieved on 29/09/2011). Moreover, the country was considered “partly free” and scored a 5 in terms of “political rights” (on a scale from 1, “the most free”, to 7, “the least free”). Thus, this case was either considered “missing” in our macro level analysis or scored with the value “0” for the number of years since the last democratic transition.
we see that the partition makes sense politically. Similar notes could be made about the
partition concerning “the level of development of societies”. However, we should bear in mind that our dataset has a larger number of new democracies (13) than middle-aged (3) or long consolidated democracies (4). We can see that in terms of the level of development, there are many more cases with middle (7) and high (9) levels of development (16) than with low levels (4). Moreover, we can say that there is a reasonable spread of different regimes across each level of social development. Thus, although new democracies are in
greater quantity, we are convinced that both the richness and uniqueness of the CNEP I-III data and the reasonable variation in macro independent variables allow us to proceed with our analysis.
Finally, we have a third set of two hypotheses that apply only to the recognition of the location of parties in the LR scale (LR PP):
Hypothesis on party size and the overall level of LR recognition and use across coun-tries: the higher the (electoral) size of the two parties under recognition taken together,
the higher the overall level of recognition of parties’ location on the LR scale.
Hypothesis on party size and the individual level determination of LR recognition and use across countries: the higher the (electoral) size of the two parties under recogni-tion taken together, the higher the recognirecogni-tion determinarecogni-tion of parties’ locarecogni-tion on the LR scale by the independent variables in each country.
We expect this effect because larger parties have more chances of being recognized, especially by the more educated, politically interested and older voters, as well as by those
with more media exposure and stronger partisan attachments. First, because they are probably older than the smaller parties. Second, because the policy proposals of larger parties usually receive more media attention. Third, because larger parties usually have more resources to publicize their actions and mobilize voters.
Data, Methods and Operationalization
In order to accomplish our objectives and test the hypotheses, we use as many coun-tries and election surveys from the CNEP I-III dataset as possible, a solution that is vari-able according to the different objectives and information availvari-able. We usually use around 12-13 and 17-19 cases.
To estimate the impact of macro-level items on the country level of determination in LR recognition we use the multi-level technique known as “two-step hierarchical regres-sion” (Achen, 2005; Jusko and Shively, 2005). At the individual level (first step), we use
macro level (second step), we pick up the regression coefficients from the first step and consider them as our dependent variables.
First, as Jusko and Shively (2005: 12-13) note, the “two-step strategy draws heavily on the statistical foundations of the hierarchical linear models... but maintains many of the advantages of both portioning and pooling strategies... And it accomplishes this without loss of efficiency as compared to pooling strategies”, and with more flexibility as we will explain below. In the first step, we estimate separate logistic regressions to explain the LR recognition in each one of the 12-19 cases. Education, Political Interest, Age, Media Expo-sure, and Strength of Party Identification are the independent variables at level one. The regression coefficients from the first step are then taken as the dependent variables for the second step, where the independent variables are system level, and the cases (“N”) are the 12-19 countries/election surveys. We acknowledge that a larger N would have been better, but it is important to stress three things. First, while ideally N should be greater than or equal to 30, statistical simulations for N=10 reveal “the regression coefficients and low-est-level variance components are again estimated without bias”, and only “the group-level variance was over-estimated, with a bias up to 25 per cent” (Maas and Hox, 2005: 90, 91). Since we have 12-19 groups, and are mainly interested in explaining variation in the regression coefficients, we can conclude the sample size at step two is adequate, even if far from ideal. Second, in cross-country comparative political analysis, larger samples for the second step are rather rare, but robust findings have been found with 26 (Jusko and Shively, 2005), 16 (Lachat, 2008), 15 (Weldon, 2006), and 13 groups (Freire and Kivis-tik, 2013). Moreover, studies about LR among the mass publics usually rely on an even smaller number of cases/countries in level 1: for example, around 13 and 6 cases in Freire and Kivistik (2013) (using CNEP III data); 13 cases in Freire (2006a, 2006b); 13 cases in Knutsen (1997) (the latter three studies using European Value Study 1990-1999 data). Third, by using the robust standard errors procedure we can be reasonably sure about the robustness of our findings.
Additionally, when we want to explain cross country variation in the overall level of LR recognition (self and parties) and in the overall level of individual determination of LR recognition, we will proceed in yet another way. Using the “percentage of persons that can locate themselves (or the parties) in the LR scale” as our dependent variable, we then regress these values on a set of independent variables. Or using R2s for each country, from
Left-Right Recognition Across 14 Countries from Five Continents
To begin with, we will analyse LR recognition across countries. First, we will de-scribe the material from each country, then we will proceed to testing the hypotheses at the micro and macro levels.
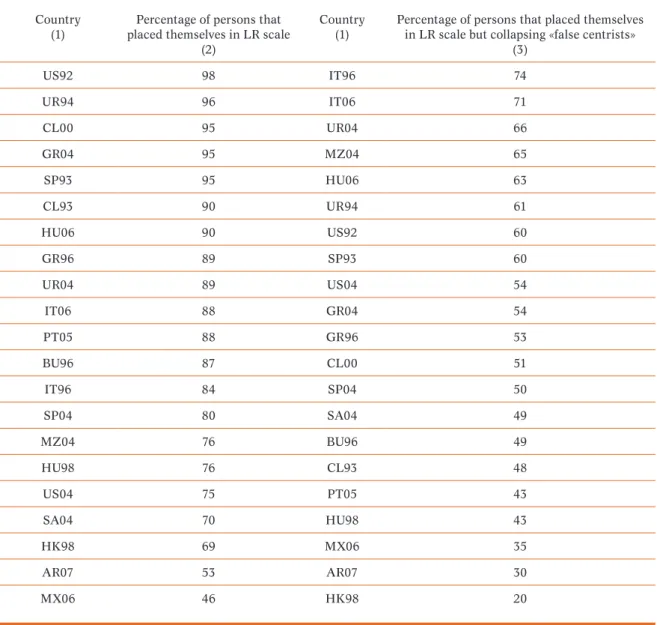
Table 2. Left-right self-placement (LR recognition) in five continents
Country (1)
Percentage of persons that placed themselves in LR scale
(2)
Country (1)
Percentage of persons that placed themselves in LR scale but collapsing «false centrists»
(3)
US92 98 IT96 74
UR94 96 IT06 71
CL00 95 UR04 66
GR04 95 MZ04 65
SP93 95 HU06 63
CL93 90 UR94 61
HU06 90 US92 60
GR96 89 SP93 60
UR04 89 US04 54
IT06 88 GR04 54
PT05 88 GR96 53
BU96 87 CL00 51
IT96 84 SP04 50
SP04 80 SA04 49
MZ04 76 BU96 49
HU98 76 CL93 48
US04 75 PT05 43
SA04 70 HU98 43
HK98 69 MX06 35
AR07 53 AR07 30
MX06 46 HK98 20
Notes:
(1) Countries organized by descending order of overall level of recognition. (2) Can place themselves in scale (values 1-10); 0 – DK, NA, Missing values.
(3) Can place themselves in scale (values 1-4 and 7-10); 0 – values 5-6 plus DK, NA, Missing values.
Values -1 and system missing are treated as DK, except in the case of CL93, IT06, MX06 PT05, US92, US04 and UR94, where they have been left out of the analysis.
a lot across countries. The general level of recognition accounts for more than three-quar-ters of the respondents and in Mexico, less than half of the respondents. So we can con-clude that the concept is known at large over the world, like many other studies did before us (Dalton, 2006; Gunther and Kuan, 2007; Noël and Thérien, 2008). The expected ten-dency should be that long consolidated democracies have a greater proportion of recog-nizers than newer ones and that the level of recognition is increasing with the passage of time in new democracies (Freire, 2006a), but the data confirms this tendency with some deviations. The lowest levels of ideological recognition are in Latin America (Mexico: 46; Argentina 53 percent), Asia (Hong Kong: 69), Africa (South Africa: 70; Mozambique: 73), and Eastern Europe (Hungary: 76). But some consolidated democracies in some years (US 2004, Spain 2004, Italy 1996) are not that much above the level of the new democracies just mentioned. Of course, there are always some short-term factors that explain variation in the same country across relatively short periods of time. For example, we know that the case of Italy, due to the strong turbulence in the Italian party system since 1994, is perhaps an example of that situation (Freire, 2006a). This is probably the case also for the US 2004 and Spain 2004, namely because data from US 1992 and Spain 1993 are much more in line with our expectations.
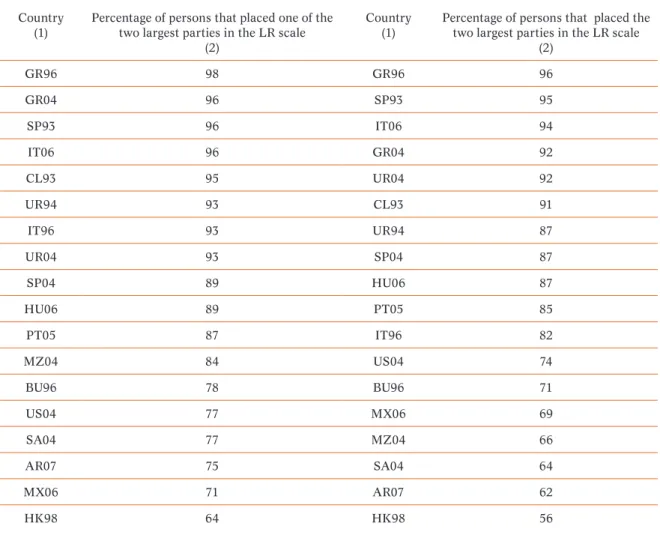
Table 3. Left-right recognition of parties’ location in the LR scale in five continents
Country (1)
Percentage of persons that placed one of the two largest parties in the LR scale
(2)
Country (1)
Percentage of persons that placed the two largest parties in the LR scale
(2)
GR96 98 GR96 96
GR04 96 SP93 95
SP93 96 IT06 94
IT06 96 GR04 92
CL93 95 UR04 92
UR94 93 CL93 91
IT96 93 UR94 87
UR04 93 SP04 87
SP04 89 HU06 87
HU06 89 PT05 85
PT05 87 IT96 82
MZ04 84 US04 74
BU96 78 BU96 71
US04 77 MX06 69
SA04 77 MZ04 66
AR07 75 SA04 64
MX06 71 AR07 62
HK98 64 HK98 56
Notes:
(1) Countries organized by descending order of the overall level of recognition.
(2) Can place the two largest parties in the LR scale (values 1-10); (1) Can place one of the two largest parties in the LR scale (values 1-10); (0) – DK, NA, Missing values.
Values -1 and system missing are treated as DK, except in the case of CL93, IT06, MX06, PT05, US92, US04, and UR94 where they have been left out from the analysis.
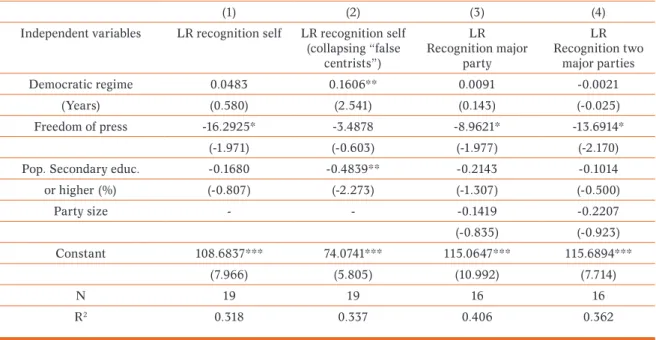
The results of the OLS regressions to explain cross country variation in the overall level of recognition reveal the following (Table 4) 4: first, in terms of self LR recognition,
freedom of press and age of democratic regime work in the expected direction – countries with more freedom of press (lower values in the Freedom House’s scale of freedoms) and with longer time elapsed since the last democratic transition do show higher levels of recognition. However, the age of the democratic regime is only significant when the de-pendent variable is self LR recognition and “false centrists” were collapsed. Conversely, freedom of press always works in the expected direction and in a significant way.
For self LR recognition when “false centrists” are collapsed, there is a factor that works contrary to expectations: the higher the level of education in a country, the lower the level of recognition. It is not easy to explain this, nevertheless, we can conclude that both political socialization in the democratic regime (self) and mass media political intermediation (self and parties) are factors that have a significant effect on the overall level of LR recognition.
Table 4. Explaining macro level variation in the overall level of LR recognition: self and parties’ location on LR scale – OLS regressions
Dependent variables: percentage for overall level of recognition
(1) (2) (3) (4)
Independent variables LR recognition self LR recognition self (collapsing “false
centrists”)
LR Recognition major
party
LR Recognition two
major parties
Democratic regime 0.0483 0.1606** 0.0091 -0.0021
(Years) (0.580) (2.541) (0.143) (-0.025)
Freedom of press -16.2925* -3.4878 -8.9621* -13.6914*
(-1.971) (-0.603) (-1.977) (-2.170)
Pop. Secondary educ. -0.1680 -0.4839** -0.2143 -0.1014
or higher (%) (-0.807) (-2.273) (-1.307) (-0.500)
Party size - - -0.1419 -0.2207
(-0.835) (-0.923)
Constant 108.6837*** 74.0741*** 115.0647*** 115.6894***
(7.966) (5.805) (10.992) (7.714)
N 19 19 16 16
R2 0.318 0.337 0.406 0.362
Notes:
1) Hong Kong collapsed because it is not a democracy; other cases collapsed due to missing data in the macro variables.
2) The dependent variables are the percentage of respondents in each country/year that are able to place themselves or the two largest parties on the LR scale.
3) The robust standard errors procedure is used: robust statistics in parenthesis.
4) Non-standardized regression coefficients and probabilities associated with significance tests are shown in the table, beside R2 and N. 5) *** p<0.01, ** p<0.05, * p<0.1.
4 From Table 4 to Table 6.3 we present the error margins for the estimations of the coefficients
Table 5.1. Explaining individual LR recognition (self) across countries
LR recognition: 1, yes, 0, no
LR recognition: 1, yes, 0, no (with false centrists: 5-6)
Variables B Wald B Wald
Italy 06 Constant 1.01*** 30.17 .18 1.55
Interest 1.56*** 68.38 .81*** 58.60
60+ years -.66** 7.50 -.39* 5.19
Nagelkerke R square .24 - .13
-N of cases 814 - 814
-Hungary 98 Constant -.84*** 15.50 -.42*** 14.26
Education .71*** 27.36 n.s. n.s.
Interest .91*** 69.00 .73*** 94.92
45-59 years .54** 8.40 n.s. n.s.
Nagelkerke R square .21 .21
-N of cases 1155 1149
-US 04 Constant -2.59*** 58.57 -2.99*** 91.83
Education .95*** 52.85 .82*** 52.41
Interest .74*** 70.95 .55*** 48.77
Nagelkerke R square .19 - .14
-N of cases 1190 - 1190
-Portugal 05 Constant .52*** 2.39 -.65*** 28.33
Education .37* 4.23 n.s. n.s.
Interest .77*** 47.47 .24*** 12.23
60+ years -.43** 3.63 n.s. n.s.
Nagelkerke R square .13 .02
-N of cases 1087 1087
-Notes:
1) binary logistic regression, forward stepwise method, countries separately; 2) *** p < 0.001, ** p < 0.01, * p <0.05;
3) Forward stepwise method: only variables with significant impact are considered and presented in the table. 4) In case of age, the 29 years or younger group is the reference group.
5) Countries ordered according to descending strength of the Pseudo R2.
Table 5.2. Explaining individual LR recognition (self) across countries
LR recognition: 1, yes, 0, no
LR recognition: 1, yes, 0, no (with false centrists: 5-6)
Variables B Wald B Wald
Hungary 06 Constant -.32 .34 -.42*** 14.26
Education .91** 11.45 n.s. n.s.
Interest .80*** 38.08 .73*** 94.92
60+ years -.47* 3.96 n.s n.s.
Nagelkerke R square .14 - .12
-N of cases 1148 - 1149
-Uruguay 04 Constant .40 2.07 .25 5.65
Education .45** 8.72 n.s. n.s.
Interest .84*** 47.32 .30*** 21.31
Nagelkerke R square .14 - .03
-N of cases 1127 - 1126
-Spain 04 Constant .49*** 19.21 -.60*** 33.81
Interest .89*** 82.88 .50*** 50.16
Nagelkerke R square .12 .06
-N of cases 1190 1190
-Chile 93 Constant .42 1.53
Education .96*** 19.05 n.s. n.s.
Interest .40* 4.97 .38*** 20.35
30-44 years n.s. n.s. -.36* 4.87
45-59 years n.s. n.s. -.66** 11.40
Nagelkerke R square .10 - .06
-N of cases 823 - 823
-Hong Kong 98 Constant -.69** 11.72 -2.25*** 89.21
Education .64*** 36.67 28* 6.35
Interest .33*** 15.43 .25** 7.87
45-59 years .53** 9.33 .56** 10.29
Nagelkerke R square .09 - .04
-N of cases 1167 - 1167
Table 5.3. Explaining individual LR recognition (self) across countries
LR recognition: 1, yes, 0, no
LR recognition: 1, yes, 0, no (with false centrists: 5-6)
Variables B Wald B Wald
Argentina 07 Constant -1.16*** 43.56 -1.89*** 85.44
Education .52*** 38.87 .259** 7.73
Interest .24*** 13.22 .387*** 32.26
Nagelkerke R square .08 - .06
-N of cases 1183 - 1183
-Italy 96 Constant .04 0.03 .70*** 24.71
Education .55*** 14.64 n.s. n.s.
Interest .53*** 26.66 .41*** 24.04
45-59 years n.s. n.s. -.40** 6.80
60+ years n.s. n.s. -.35* 3.91
Nagelkerke R square .07 -
-N of cases 1200 -
-Greece 96 Constant 1.47*** 130.18 -.39*** 15.70
Interest .56*** 30.33 .33*** 32.69
60+ years n.s. n.s. .30* 4.58
Nagelkerke R square .06 - .05
-N of cases 1198 - 1198
-Spain 93 Constant 2.25*** 207.62 -.14 2.03
Interest .90*** 20.66 .49*** 43.82
60+ years n.s. n.s. .39** 7.41
Nagelkerke R square .06 - .06
-N of cases 1198 - 1198
-Mozambique 04 Constant .50*** 13.60 -.48* 4.45
Interest .39*** 37.96 .34*** 32.29
Education n.s. n.s. .43** 8.51
60+ years n.s. n.s. -.58* 5.18
Nagelkerke R square .05 - .06
-N of cases 1068 - 1068
Table 5.4. Explaining individual LR recognition (self) across countries
LR recognition: 1, yes, 0, no
LR recognition: 1, yes, 0, no (with false centrists: 5-6)
Variables B Wald B Wald
South Africa 04 Constant -.34 2.57 -.68** 11.66
Education .54*** 22.60 .23* 5.17
Interest .20** 10.76 .20*** 13.95
Nagelkerke R square .04 - .02
-N of cases 1188 - 1188
-Bulgaria 96 Constant .96*** 17.75 -.72*** 49.62
Education .41** 9.66 n.s. n.s.
Interest .20* 4.42 .50*** 67.34
Nagelkerke R square .03 - .08
-N of cases 1195 - 1195
-Mexico 06 Constant -.89*** 14.27 -.89*** 26.27
Education .22* 4.02 n.s. n.s.
Interest .17** 7.19 .15* 5.03
Nagelkerke R square .03 - .01
-N of cases 624 - 624
-Uruguay 94 Constant 2.08*** 20.74 .08 .59
Interest n.s n.s. .32*** 27.05
Education .62* 5.19 n.s. n.s.
Nagelkerke R square .02 - .03
-N of cases 788 - 1187
-Notes: See table 5.1
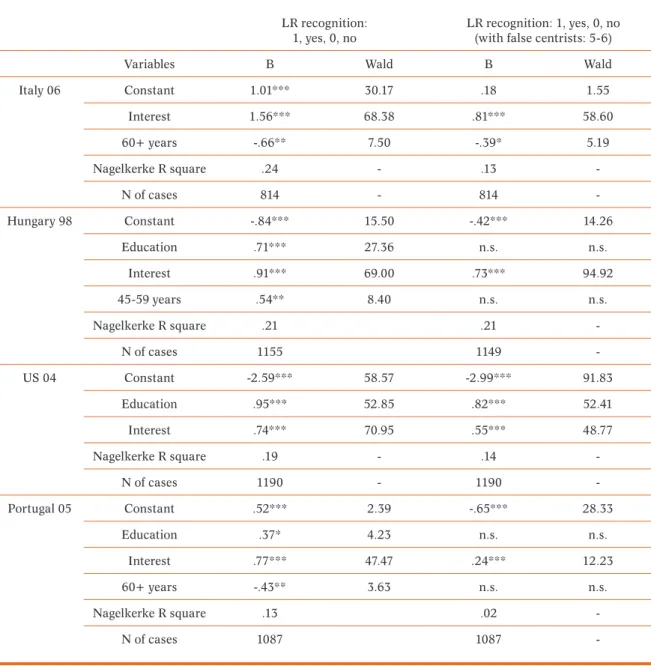
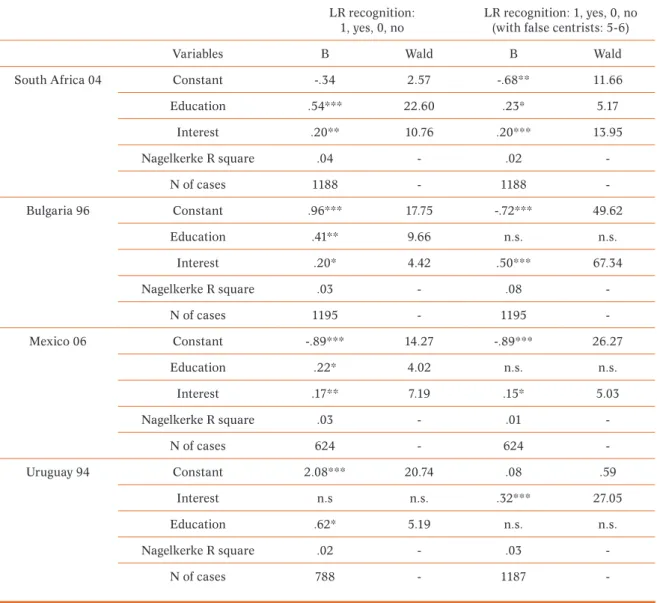
The findings about which individual level variables have an effect on self LR recog-nition are in Tables 5.1-5.3.5 First, when we compare the explanatory power of the model,
5 When the dependent variable is a dichotomy (1, the respondent is able to locate him/herself
in the LR scale, 0 otherwise), like in Tables 5.1-5.4, we use Logistic (L. Reg.) instead of OLS regressions. In L. Reg. we estimate instead the probability of success of a phenomenon (1, the respondent is able to place him/herself in the LR scale). Thus, the relationship between the independent and dependent variables is not linear – it is better described by an S. So, a logarithmic transformation is needed to transform a non-linear relation into a linear one: this is done by the logit (Jovell, 1995). The regression constant (a) represents the value logit
of the probability of an event happening when the value of the independent variable (X) is zero. The regression coefficients (b) now represent the change in the odds ratios’ logit for an event to happen, for one unit change in the independent variable (X). The odds ratios
it seems that the effect of the sophistication level of LR recognition is usually larger in
Europe and in the US than in countries from other regions of the world, although with
some exceptions. It seems to indicate that in Europe and the US we find our expectations
more easily (more educated, politically interested and older people are usually more able
to recognize the LR divide), and that in other regions of the globe levels of recognition,
or a lack of them, are socially more diffuse. Thus, in these latter countries, political and
cultural factors probably weigh more than in Europe and the US. In the case of Europe,
Bulgaria is the exception, with one of the lowest levels of determination. But this might
mean that the lower explanatory power of the model that we find in non-European and
non-North American regions can also be found in some new democracies from Eastern
Europe (Freire, 2006a). Anyhow, it is clear that the effect of the sophistication varies a lot:
from 0.02 in Uruguay 1994 to 0.24 in Italy 2006. When we consider an alternate
treat-ment of the dependent variable by collapsing “false centrists”, the major effect is to usually
depress the strength of the R2 (columns 5 and 6 of Tables 5.1 to 5.4).
If we look at the variables’ impact we see that quite often the only variables that have
a significant impact on LR recognition are education and/or political interest. The only
countries where age is more important than education are Portugal in 2005 and Italy in
2006. Other elements worth highlighting are the following: first, age is often irrelevant;
second, in some cases (Hungary 2006, Italy, Chile 1993, and Portugal) the effect of age
is negative. This means that the oldest group (AgeD3: 60 years old or more) in these
countries is less aware of LR than the youngest cohort (18-29 years old), a syndrome that
was found to be characteristic of new European democracies elsewhere (Freire, 2006a).
However, in CNEP I-III this seems not to be the case: first, there are long consolidated
or middle-aged democracies with a negative effect, and we cannot see the same results in
several other new democracies of the CNEP I-III sample. Overall, however, we would say
that the results point in the expected direction: more education, age and political interest
are usually associated with higher levels of self LR recognition. However, the effect of age
is variable across countries.
interpret, we usually consider the inverse of that measure (eb), which allows us to read the
coefficient as the change in the odds ratio of a certain event happening associated with one unit change in the independent variable (X). Since the dependent variable is not an interval variable, we cannot make estimations for regression coefficients using ordinary least squares
(OLS), so the maximum-likelihood method is used instead. The Pseudo R2 is the equivalent
measure for the level of variance explained (R2) in OLS regressions, even if less robust. Finally,
Of course, one could reasonably argue that the previous models are underspecified:
media exposure and strength of party identification are missing. This omission is because
if we want to include these two extra factors, we pass from the 18 cases under scrutiny
to 13. Nevertheless, we performed new regressions for the 13 countries with the relevant
variables testing the effect of “media exposure” and “strength of party identification”,
be-sides the other three variables (due to spatial limitations, these tables are not shown here).
There are basically three conclusions. First, the impact of the new independent variables
is always relevant and the R2s usually increase. Second, both factors boost the level of LR
recognition. Third, when both are available, both have an independent and significant
im-pact, but in any case these factors (or at least one of them) appear among the most relevant
factors to explain individual level variation in LR recognition. Thus, both media political
intermediation and political socialization have an impact on LR recognition.
Due to spatial limitations, we cannot show the tests of the models to explain
in-dividual level variation in the recognition of the two largest parties’ LR position across
countries. Contrary to what we find in terms of self LR recognition, in the case of parties’
LR recognition we now find a mix of long consolidated (US 2004) and new democracies
(Bulgaria, Hong Kong, South Africa) with the highest R2; and at the bottom of the
rank-ing, with the lowest R2, we find both new (Mexico, Uruguay 2004, Spain 1993) and
mid-dle-aged (Greece 2004) democracies. Thus, we have a more mixed situation in terms of the
impact of the age of the democratic regime and level of development on LR recognition.
About the variables that have a significant impact on the recognition of parties’ location
on the LR divide, we conclude that the pattern of determination is rather similar to the
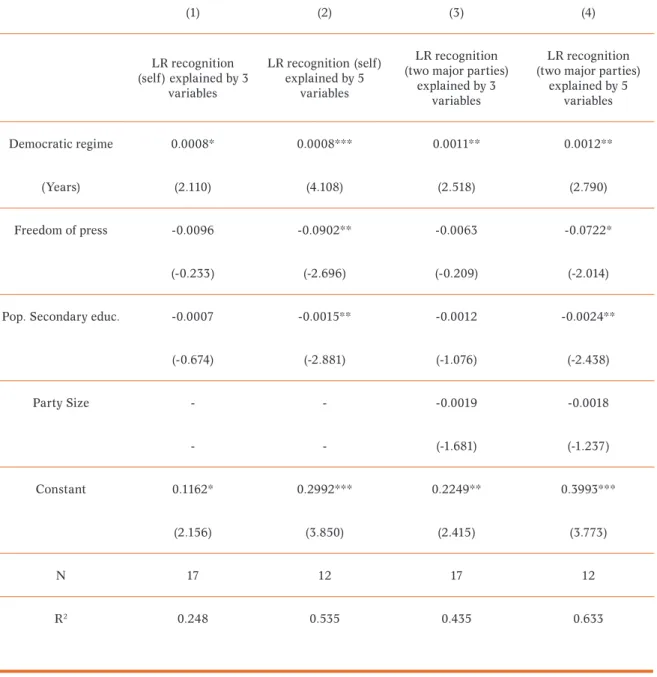
Table 6.1. Explaining cross-national variation in individual level determination of left-right recognition (self and two major parties)
Dependent variables:
R2 for individual level determination of LR recognition in each country
(1) (2) (3) (4)
LR recognition (self) explained by 3
variables
LR recognition (self) explained by 5
variables
LR recognition (two major parties)
explained by 3 variables
LR recognition (two major parties)
explained by 5 variables
Democratic regime 0.0008* 0.0008*** 0.0011** 0.0012**
(Years) (2.110) (4.108) (2.518) (2.790)
Freedom of press -0.0096 -0.0902** -0.0063 -0.0722*
(-0.233) (-2.696) (-0.209) (-2.014)
Pop. Secondary educ. -0.0007 -0.0015** -0.0012 -0.0024**
(-0.674) (-2.881) (-1.076) (-2.438)
Party Size - - -0.0019 -0.0018
- - (-1.681) (-1.237)
Constant 0.1162* 0.2992*** 0.2249** 0.3993***
(2.156) (3.850) (2.415) (3.773)
N 17 12 17 12
R2 0.248 0.535 0.435 0.633
Notes:
1) The robust standard errors procedure is used: robust statistics in parenthesis.
2) Non-standardized regression coefficients and probabilities associated with significance tests are shown in the table, beside R2 and N.
3) Individual level determination of LR recognition by 3 variables (education, political interest, and age) or 5 variables (education, political interest, age, media exposure, and strength of party identification).
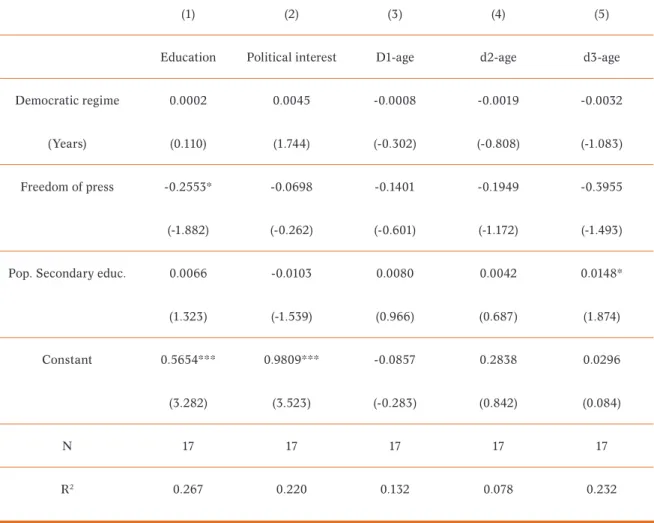
Table 6.2. Explaining cross-national variation in self left-right recognition – 2nd Step of
the Two Step Hierarchical Regression (Beta coefficients) – only for countries that have all independent variables at the individual level
Dependent variables: regression coefficients for sophistication model (self)
(1) (2) (3) (4) (5)
Education Political interest D1-age d2-age d3-age
Democratic regime 0.0002 0.0045 -0.0008 -0.0019 -0.0032
(Years) (0.110) (1.744) (-0.302) (-0.808) (-1.083)
Freedom of press -0.2553* -0.0698 -0.1401 -0.1949 -0.3955
(-1.882) (-0.262) (-0.601) (-1.172) (-1.493)
Pop. Secondary educ. 0.0066 -0.0103 0.0080 0.0042 0.0148*
(1.323) (-1.539) (0.966) (0.687) (1.874)
Constant 0.5654*** 0.9809*** -0.0857 0.2838 0.0296
(3.282) (3.523) (-0.283) (0.842) (0.084)
N 17 17 17 17 17
R2 0.267 0.220 0.132 0.078 0.232
Notes:
1) The robust standard errors procedure is used: robust statistics in parenthesis.
2) Non-standardized regression coefficients and probabilities associated with significance tests are shown in the table, beside R2 and N.
Table 6.3. Explaining cross-national variation in parties’ left-right recognition – 2nd Step
of the Two Step Hierarchical Regression (Beta coefficients) – only for countries that have all independent variables at the individual level
Dependent variables: regression coefficients for sophistication model (parties)
(1) (2) (3) (4) (5)
Independent variables Education Political interest d1-age d2-age d3-age
Democratic regime 0.0004 0.0012** -0.0003 0.0004 -0.0001
(Years) (0.857) (2.756) (-0.798) (0.605) (-0.180)
Freedom of press 0.0195 0.0332 -0.0287 0.0244 -0.0402
(0.501) (0.889) (-0.834) (0.508) (-0.619)
Pop. Secondary educ. 0.0023 -0.0005 0.0005 0.0002 0.0035
or higher (%) (1.711) (-0.363) (0.377) (0.115) (1.550)
Party size 0.0006 0.0023 0.0010 0.0005 -0.0003
(0.452) (1.719) (0.900) (0.303) (-0.146)
Constant -0.0308 -0.0697 0.0078 -0.0525 -0.1116
(-0.324) (-0.625) (0.072) (-0.303) (-0.688)
N 16 16 16 16 16
R2 0.373 0.610 0.119 0.066 0.243
Notes:
1) The robust standard errors procedure is used: robust statistics in parenthesis.
2) Non-standardized regression coefficients and probabilities associated with significance tests are shown in the table, beside R2 and N.
3) *** p<0.01, ** p<0.05, * p<0.1
Let us now pass to explaining cross national variations in a systematic way. First, we take the country by country R2s(from the models to explain individual level determination
of LR recognition) as our dependent variables and the macro-level items as our indepen-dent variables. From these tests we can conclude that LR recognition (self and parties) is always more socially and politically determined in long consolidated (or middle-aged de-mocracies) than in new democracies. Freedom of press also has the expected effect (more freedom of press implies more determined profiles of LR recognition), but these effects are only significant when the fully specified models (i.e., those including education, political interest, age, media exposure, and party identification) are taken into account. Finally, unexpected results are present again for education: lower levels of determination in LR recognition in societies with higher levels of education.
“political interest” and “age” on LR recognition in each country, and our independent variables (second step) are the macro-level items. Overall, what we can see in Table 6.2 for LR self recognition is that there are only two significant macro-level factors. Freedom of press boosts the impact of “education” on LR self recognition. Countries’ overall levels of education boost the impact of “D3 - age” upon LR self recognition: in countries with larger percentages of persons with a secondary education or more, the oldest cohort (“D3 - age”) has a significantly higher level of LR recognition than the youngest cohort (reference group: 18-29 years old).
In the case of parties’ LR recognition, only the variable “age of the democratic re-gime” has a significant effect, and only on the impact of “political interest”: in older de-mocracies any individual “political interest” has more chances of increasing the level of parties’ LR recognition than in new democracies.
Summing up, we conclude that although cross country variation on the strength of the impact of the sophistication model (Tables 5.1-5.4; Table 6.1) and in the overall level of LR recognition (Table 4) can be clearly explained by macro level factors (age of democratic regime, freedom of press, and education), the case is less clear when we want to explain cross country variation in the impact of each individual level explanatory factor (Tables 6.2 and 6.3).
Concluding Remarks
We tried to understand and explain, both across individuals and countries from five continents, the level of recognition of the LR divide at the mass level. Previous studies have concentrated either on European cases or, when using a more global approach, on a description of patterns across countries/regions, and were less focused on explaining those differences. Thus, the present study contributes with unique data and approaches to the understanding of the use of the LR divide across the globe.
political interest, media exposure, and party identification in the different polities, and also that some convergence between countries might be expected in future, when and if these compositional differences are reduced.
Moreover, we found that cross country variation in the total strength of the impact of the sophistication model (R2) and in the overall level of LR recognition can be more
easily explained by macro level factors (age of democratic regime, freedom of press, party size, education) than when we want to explain cross country variation in the impact of each individual level explanatory factor. In the first case, the overall level of LR recogni-tion is more dependent on macro level factors: age of the democratic regime (only for self LR recognition when collapsing “false centrists”) and freedom of press (for all dependent variables: self and parties) both boost the overall level of LR recognition in a country.
But in the second set of situations, concerning cross country variation in the impact of each individual level explanatory factor, we found that in terms of self LR recognition macro level indicators only have an impact on “education” and “age: oldest cohort vs. youngest cohort”: in more free media systems (for “education”) and in more educated societies (age), “education and age” have more of an impact on individual level self LR recognition, respectively. In the case of parties’ LR recognition, we concluded that in long consolidated (or middle-aged) democracies, “political interest” has more impact on LR recognition than in new democracies. Thus, in the latter polities the determination of in-dividual level parties’ LR recognition is less dependent upon political interest and is there-fore more diffuse, i.e., more dependent upon macro-level political and cultural factors.
Overall, however, we found that LR recognition (for self and parties) is more socially and politically determined (at the individual level) in long consolidated democracies and in systems with more freedom of press than in new democracies and in systems with not so free media systems. Thus, both the age of the democratic regime and freedom of press explain cross country variation in the individual level determination of LR recognition across countries. Consequently, there are reasons to expect some convergence between countries when democratic regimes (from non-Western parts of the world) are more con-solidated, there is more freedom of the press, and the level of social development is strong-er. Moreover, the evidence shown, concerning both the individual level and macro level of determination of LR recognition and use, gives clear indications of the heuristic value of the LR scale for comparing mass political attitudes and behaviour worldwide.
in freer societies. But does this really mean that in the long term new democracies will converge with the long consolidated (or middle-aged) ones? This is certainly an empirical question that cannot be answered here. Moreover, we acknowledge that both the micro and macro models are relatively poor in terms of explanatory factors considered, but this is due to the limitations of the CNEP I-III survey data available, as well as the small number of cases at the macro level and the research design adopted (a comparative variable orient-ed and synchronic approach). There are clear tasks for future research either using more cases or more in-depth historical approaches based on case studies.
Revised by Priscila Moura Submitted in May 2012 Accepted in August 2013
References
ACHEN, Christopher. (2005), “Two-Step Hierarchical Estimation: Beyond Regression Analysis”.
Political Analysis, vol. 13, nº 4, pp. 447-456.
ARON, Raymond. (2002), L’Opium des Intellectueles, Paris: Hachette.
BARNES, Samuel H. (2002), “Left and Right in Old and New Democracies”. Central European Political Science Review, vol. 3, nº7, pp. 6-15.
BARNES, Samuel H.; McDONOUGH, Peter; PINA, António L. (1985), “The development of partisanship in new democracies: the case of Spain”. American Journal of Political Science, nº 29, pp. 695-720.
BECK, Paul A.; DALTON, Russell J.; GREENE, Steven; HUCKFELDT, Robert. (2002), “The Social Calculus of Voting: Interpersonal, Media, and Organizational Influences on Presidential Choices”. The American Political Science Review, vol.96, nº1, pp. 57-73.
BELL, Daniel. (2000), The End of Ideology. On the Exhaustion of Political Ideas in the Fifties.
Harvard: Harvard University Press.
BOBBIO, Norberto. (1994), Direita e Esquerda. Lisbon: Presença.
CAMPBELL, Angus; CONVERSE, Philip E.; MILLER, Warren E.; STOKES, Donald E. (1980),
The American Voter. Chicago: Chicago University Press.
CARAMANI, Daniele (2004), The Nationalization of Politics. The Formation of National Electorates and Party Systems in Western Europe. Cambridge: Cambridge University Press. CONVERSE, Philip E. (1964), The nature of belief systems in mass publics, In: Apter, David.
Ideology and Discontent. New York: The Free Press.
COLOMER, Josep M. and ESCATEL, Luis E. (2005), The Left-Right Dimension in Latin America. UPF Economics and Business Working Paper, nº 813.
DALTON, Russell J. (2006). Social Modernization and the End of Ideology Debate: Patterns of Ideological Polarization. Japanese Journal of Political Science. vol.7, nº1, pp. 1–22.
DALTON, Russell J.; FARREL, David M.; MCALLISTER, Ian. (2011), Political Parties and Democratic Linkage: How Parties Organize Democracy. Oxford: Oxford University Press. DIX, Robert H. (1992), “Democratization and the institutionalization of Latin American Political
Parties”, Comparative Political Studies, vol. 24, nº4, pp. 488-511.
EVANS, Geoffrey and WHITEFIELD, Stephen. (1998), The evolution of left and right in post-Soviet Russia. Europe-Asia Studies, vol. 50, nº6, pp. 1023-1042.
FRANKLIN, Mark.; MACKIE, Thomas.; VALEN, Henry (eds.). (1992), Electoral Change. Responses to Evolving Social and Attitudinal Structures in Western Countries, Cambridge, Cambridge University Press.
FREIRE, André. (2006a), Left-Right Ideological Identities in New Democracies: Greece, Portugal and Spain in the Western European Context”, Pôle Sud – Revue de Science Politique de l’Europe Méridionale, nº 25, vol. II, pp. 153-173.
FREIRE, André. (2006b), Bringing Social Identities Back In: The Social Anchors of Left-Right Orientation in Western Europe. International Political Science Review, vol. 27, nº4, pp. 359-378.
FREIRE, André (2008). Party Polarization and Citizens’ Left-Right Orientations. Party Politics, 14 (2), pp.189-209.
FREIRE, André and BELCHIOR, Ana M. (2011), What left and right means to Portuguese citizens.
Comparative European Politics, vol. 9, nº2, pp. 145–167.
FREIRE, André and KIVISTIK, Kats (2013), «Western and Non-Western Meaning of the left-right divide across four continents», Journal of Political Ideologies, vol.18, nº 2, pp. 171-199. FUCHS, Dieter and KLINGEMANN, Hans-Dieter (1990), “The Left-Right Schema”. In:
JENNINGS, M. Kent et al, Continuities in Political Action, Berlin de Gruyter, pp. 203-234. FUKUYAMA, Francis (1989), “The end of history”. The National Interest, 16.
GIDDENS, Anthony (1996), Más Allá de la Izquierda y la Derecha. Madrid: Ediciones Cátedra. GUNTHER, Richard and KUAN, Hsin-chi (2007), “Value Cleavages and Partisan Conflict”. In:
GUNTHER, Richard, MONTERO, José Ramon and PUHLE, Hans-Jürgen. Democracy, Intermediation, and Voting on Four Continents. Oxford: Oxford University Press, pp. 255-320.
HEYWOOD, Andrew (2003), Political Ideologies. An Introduction. Basingstoke: Palgrave Macmillan.
HUBER, John and INGLEHART, Ronald. (1995), “Expert interpretations of party space and party locations in 42 societies”, Party Politics, vol. 1, nº 73, p. 111.
INGLEHART, Ronald and KLINGEMANN, Hans D. (1976), Party identification, ideological preference and the left-right dimension among Western mass publics. In: BUDGE, Ian ed. Party identification and Beyond, London and New York, Wiley.
JOU, Willy (2010), “The heuristic value of the left-right schema in East Asia”, International Political Science Review, vol. 31, nº3, pp. 366-394.
JOVELL, Albert J. (1995), Análisis de Regresión Logística.Madrid: CIS.
JUSKO, Karen L. and SHIVELY, W. Philips. (2005), “Applying a Two-Step Strategy to the Analysis of Cross-National Public Opinion Data”. Political Analysis, vol.13, nº4, pp. 327-344. KIECOLT, K. Jill and NATHAN, Laura E. (1985), Secondary Analysis of Survey Data. London:
Sage.
KITSCHELT, Herbert and HELLEMANS, Staf. (1990), The left-right semantics and the new politics cleavage. Comparative Political Studies. vol.23, nº2: pp. 210-238.
KITSCHELT, Herbert; MANSFELDOVA, Zdenka; MARKOWSKI, Radoslaw; TOKA, Gabor (eds.). (1999), Post-Communist Party Systems. Competition, Representation, and Inter-Party Cooperation. NY: Cambridge University Press.
KLINGEMANN, Hans-Dieter (1979), “Measuring ideological conceptualizations”, “The background of ideological conceptualization”. In: BARNES, Samuel et al, Political Action. Beverly Hills: Sage, pp. 215-253, 255-277.
KNUTSEN, Oddbjørn (1997), “The Partisan and the Value-Based Components of Left-right Self-placement: A Comparative Study”. International Political Science Review, vol. 18, pp.191– 225.
KNUTSEN, Oddbjørn (1998). The strength of the partisan component of left-right Identity. A comparative longitudinal study of left-right party polarization in eight West European countries. Party Politics, 4, pp. 5-31.
KNUTSEN, Oddbjørn and SCARBROUGH, Elinor. (1995), “Cleavage politics”. In: DETH, J. W. Van and SCARBROUGH, E. The Impact of Values. Oxford: Oxford University Press, pp. 492-524.
LACHAT, Romain (2008), “The impact of party polarization on ideological voting”. Electoral Studies, vol. 27, pp. 687-698.
LAPONCE, Jean A. (1981), Left and Right. The Topography of Political Perceptions. Toronto: University of Toronto Press.
LIPSET, Seymour M. (1987), “¿El fin de toda ideología?” and “Un concepto y su historia: el fin de la ideología”. In LIPSET, Seymour M. El Hombre Político. Las Bases Sociales de la Política. Madrid: Editorial Tecnos, pp. 357-372 e 420-448.
LUNA, Juan P. and ZECHMEISTER, Elizabeth J. (2010), “Political representation in Latin American”. In: KITSCHELT, Herbert et al (2010) (eds.) Latin American Party Systems.
NY: Cambridge University Press, pp. 119-144.
MAAS, Cora J.M. and HOX, Joop J. (2005), “Sufficient Sample Sizes for Multilevel Modelling”.
Methodology, vol.1, nº3, pp. 86-92.
MCALLISTER, Ian and WHITE, Stephen. (2007), Political Parties and Democratic Consolidation in Post-Communist Societies. Party Politics. vol.13, nº2, pp.197–216.
MAINWARING, Scott P. and TORCAL, Mariano. (2005), “Party System Theory and Party System Institutionalization after the Third Wave of Democratization.” Paper presented at the Political Science Seminar of the Social Sciences Institute of the University of Lisbon, Portugal.
MARKOWSKI, Radoslaw. (1997), Political Parties and Ideological Spaces in east Central Europe.
Communist and Post-Communist Studies vol. 30, nº3, pp. 221-254.
NIEMI, Richard G.; POWELL JR, G. Bingham; STANLEY, Harold W.; EVANS, C. Lawrence. (1985), “Testing the converse partisanship model with new electorates”, Comparative Political Studies, vol. 18, pp. 300-322.
NOËL, Alain and THÉRIEN, Jean-Philippe (2008), Left and Right in Global Politics. Cambridge: Cambridge University Press.
ROSE, Richard and MUNRO, Neil (2003), Elections and Parties in New EuropeanDemocracies.
Washington: CQ Press.
WELDON, Steven A. (2006), “The Institutional Context of Tolerance for Ethnic Minorities: A Comparative Multilevel Analysis of Western Europe”. American Journal of Political Science, vol. 50, nº2, pp. 331-349.
VAN DER EIJK, Cees; SCHMITT, Hermann; BINDER, Tanja. (2005), “Left-right Orientations and Party Choice”. In: THOMASSEN, Jacques (ed.), The European Voter. A Comparative Study of Modern Democracies. Oxford: Oxford University Press, pp. 167-191.
ZECHMEISTER, Elizabeth. (2006). What’s Left and Who’s Right? A Q-method Study of Individual and Contextual Influences on the Meaning of Ideological Labels. Political Behavior. vol.28: pp.151–173.