THE IMPACT OF FINANCIALIZATION AND
SHAREHOLDER VALUE IN FIXED CAPITAL
INVESTMENT: EVIDENCE FOR THE PORTUGUESE
MANUFACTURING INDUSTRY
Francisco João Maçãs Biscainho
Dissertation submitted as partial requirement for the conferral of Master in Economics
Supervisor:
Prof. Ana Cristina Narciso Fernandes Costa, Assistant Professor, School of Social Sciences ISCTE-IUL, Department of Political Economy
THE I MP ACT OF F IN AN C IA LI ZAT IO N A N D S HA R EHO LDE R VA L UE I N FIX ED C APITA L IN VESTMENT: EV ID E NCE F OR THE P ORTUG UESE MAN UFAC TU R IN G I ND USTR Y
F
ra
nc
is
co
J
o
ã
o
M
a
çã
s B
is
ca
inh
o
II
Abstract
With the dawn of financial markets, several behaviours of economic agents were disrupted and traversed a metamorphosis. Financialization, the process through which economic activities became increasingly tied to a web of artificial revenues, expenditures, and decisions of financial nature, is one of those disruptive elements of the late 20 and 21st century world economy. Evidence of its impact, particularly a negative one on the investment in fixed capital through practices such as shareholder value-oriented management, has been gathered for several western economies but the Portuguese case remains largely marginal. It is the aim of this dissertation to conduct an exploratory investigation on how a set of indicators of financialization and shareholder value have their impact felt on the investment in fixed capital in Portugal, specifically the one carried out by manufacturing industries.
Analysing a panel data dataset comprised between 2010 and 2015 with statistical information gathered by the national bureau of statistics, INE, the results are mixed. Through a linear regression model and a pooled OLS with robust estimators estimation method, I conclude that there’s indeed a negative impact in fixed capital stocks produced by dividend distribution and firms receiving interest and similar revenues. On the other hand, there’s a surprising positive impact of financial investments conducted by firms and the amount of interest they pay, alongside similar expenditures. Given some data limitations, particularly the small number of observations, the econometric procedure is sensitive and these results require future inquiry to further strengthen the conclusions.
JEL Classification:
E22 – Investment; Capital; Intangible Capital; Capacity
O16 – Financial Markets; Saving and Capital Investment; Corporate Finance and Governance
Keywords:
Financialization; Investment; Fixed Asset; Dividends
III
Resumo
Com o surgir dos mercados financeiros, vários comportamentos dos agentes económicos sofreram mudanças. A financeirização, processo pelo qual as actividades económicas se tornaram crescentemente interligadas e movidas por elementos de natureza financeira, é um desses elementos disruptivos da economia mundial do final do século 20 até aos dias de hoje. Vários estudos para as economias ocidentais confirmam uma influência negativa da financeirização no investimento em capital fixo através de práticas típicas do seu espectro, como uma gestão das empresas vocacionada para a remuneração dos detentores do capital. Contudo, o caso Português continua pouco explorado. Esta dissertação tem como objectivo levar a cabo uma investigação sobre como indicadores representativos da financeirização e da gestão vocacionada para os detentores do capital impactam o investimento em capital fixo levado a cabo pelas indústrias transformadoras em Portugual.
Através da análise de dados de painel relativos ao periodo temporal 2010-2015 com informação estatística recolhida pelo INE, os resultados da investigação são mistos. Através de um modelo de regressão linear e um método de estimação pooled OLS com estimadores robustos, é possível concluir que existe um impacto negativo da distribuição de dividendos e dos juros e rendimentos similares obtidos no stock de ativos fixos. No sentido inverso, o impacto dos investimentos financeiros e dos juros e despesas similares suportadas é positivo. Devido a algumas limitações, nomeadamente a escassez de observações, a análise econométrica é sensível a outros métodos de estimação e os resultados obtidos requerem uma análise futura para efeitos de fortalecimento/refutação das conclusões retiradas.
Classificação JEL:
E22 – Investimento; Capital; Capital Intangível; Capacidade
O16 – Mercados Financeiros; Poupança e Investimentos em Capital; Corporate Finance e Governance
Palavras-Chave:
IV
Acronyms
2SLS – two-stage Least Squares
BLUE – Best Linear Unbiased Estimators GDP – Gross Domestic Product
GMM – Generalised Method of Moments IMF – International Monetary Fund
INE – Instituto Nacional de Estatística (National Bureau of Statistics) OLS – Ordinary Least Squares
R&D – Research and Development
SCIE – Sistema de Contas Integradas das Empresas (System of enterprises’ integrated
accounts)
U.K. – United Kingdom U.S. – United States
V
Acknowledgements
At this closing chapter of my academic path in ISCTE-IUL, some people cannot go without mention for their decisive contributions in making me the man I am today and shaping the character and emotional pillars that ultimately allowed me to carry on through all types of hardships and achieve not only the conclusion of this dissertation but also this stage in life.
To my beloved sister Filipa who has been a mother for longer than I can remember and has to live with the best and worst versions of me. To my mother, father, brother and grandmother for the encouragement, advice and support. To Ana Sofia Gonçalves, Marta Amorim and Carolina Nunes for being my second family in Lisbon ever since I came here a young man of 18. To Frederico Chaves, David Rito and João Gomes for keeping my inner child alive. To Hugo Laranjeira for his true friendship and honesty for praising my rights and deviate me from my wrongs. To André Barbas for reminding me that home is still worth a smile. To Oskar Hjorth and Jorge Lopes for the endurance, brotherhood and keeping each other from giving up this Masters. To Paula Moldovan, Pedro Viana and Dolores for guiding me throughout the last year while working in ISCTE. To Prof. Luís Martins for the final push. To my supervisor, Prof. Ana Cristina Costa for all the support, advice, resourcefulness and bringing the mountain to
Muhammad when Muhammad wouldn’t go to the mountain.
To all the aforementioned and countless others, friends, colleagues, professors, my deepest gratitude.
“If more of us valued food and cheer and song above hoarded gold, it would be a merrier world.” - J.R.R. Tolkien
VI Index Abstract ... II Resumo ... III Acronyms ... IV Acknowledgements ... V Index ... VI
Index of Tables ... VII
Index of Equations ... VIII
1. Introduction ... 1
2. Literature Review ... 3
2.1 A rather shy performance of Investment ... 3
2.2 Financialization and the rise of shareholder value governance ... 3
2.3 Expectations, fragile foundations of the yield theory and volatility... 7
2.4 The savings levels ... 9
3. The Model ... 12
3.1 Foundations ... 12
3.2 Data, limitations and econometric methodology ... 13
3.2.1 Data ... 13
3.2.2 A brief description of the world of manufacturing industries in Portugal... 15
3.2.3 Econometric methodology ... 18
3.3 Variables ... 20
3.4 Results and discussion ... 27
4. Conclusions and future investigation opportunities ... 31
5. References ... 33
VII
Index of Tables
Table 1 - Ownership structure of German listed public limited companies, data for May 2014; Data Sources: Deutsche Bank ... 6 Table 2 - Ownership structure of DAX companies, data for May 2014; Data Sources: Deutsche Bank ... 6 Table 3 – Identification of the panel data regressors’ subscripts; all denominations according to official INE nomenclature ... 14 Table 4 – Proportion of gross added value from manufacturing firms with advanced competitive factors on the total gross added value of manufacturing firms; Data Sources: INE ... 17 Table 5 – Proportion of manufacturing firms with advanced competitive factors on the total number of manufacturing firms; Data Sources: INE ... 17 Table 6 - Pooled OLS main estimation results ... 28
VIII
Index of Equations
(1) Formalization of the investment function ………..…...….12
(2) Linear regression model ………...18
(3) Expected fixed assets – business turnover relationship……….….…...…23
(4) Expected fixed assets – net income relationship ……….………….……..24
(5) Expected fixed assets – labor costs relationship………..……...25
(6) Expected fixed assets – interest received and similar revenues relationship ….25 (7) Expected fixed assets – interest paid and similar expenditures relationship...26
(8) Expected fixed assets – financial investments relationship …….…………....27
1
1. Introduction
The rise and triumph of financial markets brought winds of change into the discussions and elements gravitating around investment. For many decades, the growth of an enterprise was best translated by the amount of fixed capital it was able to generate or invest on, which would allow it to escalate output with ever more advanced factors of production. The determinants of such output and of the mechanism that would allow it to grow in the first place, investment, were then of a real nature.
With the possibility to recur to artificial mechanisms in order to confer a virtual value of real goods, services and factors of production, tradable in non-physical markets and with a reduced need of intermediaries to engage in transactions, financial markets posed as an exciting novelty and quickly became indispensible in the grand scheme of things that was the backbone of the capitalist economies of the world, engulfing even nations where governing parties upheld political theories that condemned such things.
As technology evolved, more and more businesses and industries became connected and the speed of transactions exploded. The amount of money circulating virtually throughout the whole globe and the possibility to quickly buy and sell whatever financial product one would hold and quickly earn the associated payout planted the seed of a dangerous idea on the minds of managers and capital owners: why invest in physical capital and wait for the long-run to collect the returns while with a moderate skill or even recurring to some professional broker I could have an exponential multiplication of my invested financial resources in the short-run (sometimes,
immediate-run)?
It is no surprise that we started to observe trends of increased financialization of our economies and firms increasingly deviated from investment projects in fixed capital to actively participate in financial markets and re-shape their structures and managerial procedures to perform well in such platforms. As a consequence, the levels of investment have started to decline in western developed economies. This dissertation constitutes my attempt at conducting an exploratory analysis of these trends in Portugal, where similar studies haven’t been carried out with the volume of many of our European or American counterparts.
2 In the Literature Review, I start by contextualizing the investment slowdown and possible explanations that have been identified by other authors, at the same time introducing some data and facts about what has been identified in this subject for other countries. While doing it, some of the most important theories behind the neoclassical conception of investment are mobilized as well as a crucial topic for my investigation, shareholder value.
Afterwards, Section 3 introduces the construction, limitations and estimation of the model that will allow me to materialize into hypothesis testing an impact of financialization and shareholder value in fixed capital investment, particularly the one carried out by Portuguese manufacturing firms. This is done so through the creation of a linear regression equation with two real determinants of investment and five variables to account for financialization and shareholder value. For each variable, data is gathered from INE and arranged in a panel data setting for the time-window 2010-2015, comprising the third IMF intervention in the Portuguese economy and a steep recession and overall troublesome times for the economy. The model is thus estimated through a pooled OLS technique with robust estimators to account for the identified heteroscedasticity.
Section 4 then encloses the main conclusions that emerged from the model estimation and lays the path for future opportunities to improve this study and further reinforce the findings it reaches or refute them.
3
2. Literature Review
2.1 A rather shy performance of Investment
With growing profits from firms, it would be expected that investment had known a boom that would follow, somehow proportionately, the described profitability. Onaran
et al. (2009) contradict this belief regarding the US and major European economies
(U.K., France and Germany) by identifying a declining investment-profit ratio in those countries, thus deeming the causal relationship between higher profits and growing investment levels not so obvious as one would think.
In the Portuguese economy, investment, and more specifically the gross fixed capital formation levels, experienced an ascending trajectory with particular vigor between the mid-eighties up until the new millennia, having reached a peak in 2001. From there onwards, investment slows down and actually starts decreasing, especially with the occurrence of the 2008 financial crisis which brings it down to levels that had only been seen before in 1990.
What could be behind this? We will explore the hypothesis, dwelling in the realm of financialization, of a rise of shareholder value governance as a deterrence factor for investment decisions, with firms focusing on remunerating their shareholder structures rather than retaining and reinvesting profits.
Furthermore, and remembering the macroeconomic investment theories of the likes of Keynes (1936), we shall also analyze on Section 1.4. the performance of savings levels for selected economies, given the explanatory power of this indicator in the context of the determinants of investment.
2.2 Financialization and the rise of shareholder value governance
Although a rather recent occurrence, growing in importance mainly since the 90’s, the financialization of the developed economies is a solid explanation for the slowing down of capital accumulation and, consequently, disappointing investment levels as found by Orhangazi (2007) and Stockhammer (2010). Diving deeper in the concept of financialization, Lazonick and O’Sullivan (2000) introduce the hypothesis that the focus
4 of corporation management regarding the application of its surplus’ was now directed towards shareholder remuneration rather than investing in existing/new businesses. We are then in the presence of a possible triumph of shareholder value in corporate governance and a dissemination of capital throughout numerous agents in the financial markets. But what is shareholder value? Williams (2000) points out a reasonable answer. She maps the origins of the concept as a denomination of what became a trend in the machinery of the business world of Britain and U.S. in the early 1990’s: downsizing firms with the promise of higher profits in return. She also raises the hypothesis that firms would now place more effort in attaining good financial performance indicators that aren’t directly related with actual core-business performance with the objective of looking attractive in financial markets.
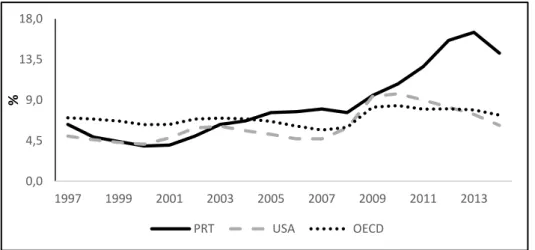
With a former driving force of capitalist prosperity based on the “retain and reinvest” logic, what happens to the growth framework of the western market economies? Should the system place a growing focus on financialization and lay the prosperity foundations of businesses and economies on market interactions of mainly speculative order and short-term orientation, we are definitely more exposed to the volatility of business cycles and the social cohesion aspect is put in jeopardy: unemployment levels increase in fragile economies, income inequalities expand and labor compensations stagnate or even decrease as portrayed by Figures 1 and 2.
Figure 1– Labor compensation per hour worked (annual change); Data Sources: OECD
The Portuguese case is particularly relevant with labor compensations per hour worked plummeting constantly since 2007, only to be interrupted with a steep increase in 2013
-4,0 -2,0 0,0 2,0 4,0 6,0 8,0 1996 1997 1998 1999 2000 2001 2002 2003 2004 2005 2006 2007 2008 2009 2010 2011 2012 2013 2014 2015 %
France Germany Portugal
5 before re-taking a downward trajectory in 2014 and upward in 2015. The behavior of the indicator occurring in 2013 demands explanation. OECD data shows that the average annual hours worked in the country increased from 1.849 in 2012 to 1.859 in 2013. Therefore, the positive evolution of the ratio cannot be attributed to its denominator as it has increased. The reason behind what happened lies with an increase of the average annual wages from 16.196 € to 16.652€, current prices, having decreased to 16.405€ in 2014 and marginally increasing again in 2015.
But is this exclusively an Anglo-Saxon trend? To keep the analysis from having an absurd extension, we will consider the two economic engines of mainland Europe, France and Germany. Jürgens et al. (2000) found evidence of a similar shift in priorities for the German economy. In the late 1980’s, the country possessed a “network economy” in which most firms (especially the bigger ones with greater capital availability) and banks were common to have shareholding positions in each other, being committed to keep this a strong and lasting cross-relationship. This was extremely important to avoid an extreme dispersion of German capital out of the country’s borders, provide a balanced set of inputs for decision-making and keep the international stock market pressures at bay or at least diminished in their influence over corporate governance.
Nevertheless, the nineties brought winds of change. The shareholder value mindset found its way into the minds of managers and became a growing priority regarding firm’s targets. The shift is explained by the author with the occurrence of a diminishing weight of the big industrial companies’ holding of public shares. Non-financial companies were in 1998 the largest share owners in the country while insurance
0,0 4,5 9,0 13,5 18,0 1997 1999 2001 2003 2005 2007 2009 2011 2013 % PRT USA OECD
6 companies and investment funds, major players in Anglo-Saxon economies, had a comparatively much smaller importance in share ownership.
Owners 2014 Residents of which 42,9% Households 11,8% Institutional Investors 29,4% Non-financial investors 18,3% Financial investors 11,1% Banks 2,7% Mutual funds 6,3% Insurers 0,9%
Other financial investors 1,3%
Non-residents 57,1%
Table 1 - Ownership structure of German listed public limited companies, data for May 2014; Data Sources: Deutsche Bank
Minor recessions and overall volatile times regarding economic growth troubled Germany during the 90’s and this produced effects in the country’s stock market. By being the dominant players there, the German manufacturing industries were exposed in a considerable extension to the negative effects of the economic instability and had their financial vulnerabilities revealed. At the same time, financial globalization was flourishing and foreign financial institutions and non-financial companies were entering in force the German stock market. The result was a state of company ownership marked by increasing exposures to foreign investors and a loss of strength of the cross-shareholding dynamics as seen in Tables 1 and 2.
Owners 2014 Residents of which 36,3% Households 12,9% Institutional Investors 21,7% Non-financial investors 9,8% Financial investors 11,9% Banks 3,3% Mutual funds 7,7% Insurers 0,5%
Other financial investors 0,3%
Non-residents
of which
63,7%
EU (excluding Germany) 33,8%
Table 2 - Ownership structure of DAX companies, data for May 2014; Data Sources: Deutsche Bank
The French case, although ending in a similar setting of vast exposure to foreign investors through their increasing share ownership (Faccio and Lang, 2002), differs from the German on the catalyzers of the transformation process. While the German
7 managers from non-financial sectors of economic activity decided to start paying more attention and progressively adopt the principles of shareholder value management, it was the outside pressure from the flooding of foreign investors in the French stock market that contaminated the French industrial capital.
The French had also possessed an intimately connected network relationship between firms through cross-share ownership, a reality that came to be with the help of more flexible laws regarding capital property and a certain withdrawal of the government from the productive industries. Nevertheless, French managers, facing historical domestic low returns on capital and the pressure from the increasing openness of financial markets to worldwide transactions, realized that the old system had become obsolete as the main target of the capitalist logic of capital investment was not being met under these circumstances: to maximize the return on investment (Morin, 2000). Regarding Portugal, in the aftermath of the dictatorship period the country had a general lack of infrastructures and severe industrialization and modernization needs. The development of financial markets and the aid provided by European institutions in the context of European integration diversified the financing options to conduct investment. This amounted to the so far historically high levels of savings in the country.
With low interest rates, firms were able to enjoy the positive aspect of financialization: to debt-leverage their activities. Financialization thus did have a positive impact, at least initially, to increase investment levels in Portugal (Lagoa et al., 2013). Nevertheless, we still lack appropriate evidence if indeed there was a shift of corporate governance towards shareholder value in Portugal with an impact on investment. This will be assessed on Section 2 further ahead.
2.3 Expectations, fragile foundations of the yield theory and volatility
We now inquire ourselves whether there are theoretical explanations built in economic theory that might justify the slowdown in investment, with a focus in physical capital, in this particular context of shareholder value management orientation. Considering that Keynes (1936) holds two key factors as determinants of investment, the prospective yield of investment (expected return that the investor will obtain in each period of the
8 asset’s life) and an asset supply-price, the first seems of particular importance in the context of this analysis.
The prospective yield of investment is based on an expectation of what might be the actual return in the future while the supply-price translates current-state information about the feasibility of producing the asset. Expectations then play a leading role in the investment process and a simplistic analysis of the current yield of the capital assets would blatantly ignore the effects of future events (and our confidence on our own beliefs) on market equilibria.
We know from early consumer behavior theory and critique of the likes of Bauer (1960) that agents do take in account future events on today’s decisions, being that incorporation of concepts often translated in terms of risk and different stances over it, specifically: aversion, neutrality or acceptance (Pratt, 1964; Arrow, 1965). The hidden danger is that statistical sciences and forecasting methods are extremely useful until the moment their foundations collapse and the unexpected strikes (Taleb, 2007).
Keynes (1936) has no problem acknowledging the severe limitations and fragile founding pillars of the prospective yield. Modigliani and Miller (1958) even criticized the theoretical economist of the time approach to explain investment due to neglecting the true nature of the impact of uncertainty over investments and consequently not capturing the whole dimension of the “cost of capital”. By typically associating an interest rate of bonds (thus building the assumption of zero risk) to investment functions, the yield delivers a rather predictable cash-flow in each period, which is not exactly what happens in the real world and even the approximations made to narrow that reality gap, like the incorporation of the “risk discount”, are deemed not enough. Unpredictability in business ventures was of a much lesser dimension and different nature in times when those enterprises were constituted and/or driven forward by a limited and often closed circle of agents committed to carry onwards their investment project. The separation of management and ownership brought an end to this resilience to a certain extent and allowed enough room for volatility to thrive and acquire a decisive role in the mechanics of the investment process, as Keynes (1936) and Stockhammer (2010) found.
With deregulated markets and higher exposure to risk, embarking on physical capital investments grew less and less attractive. If we think about it, what is easier to dispose
9 of, in case of failure or uncertainty scenarios: a set of assets that can be quick-sold at the stock market (even if at the cost of a lower price than the one they were acquired for) or an industrial complex with its physical capital structure and labor force?
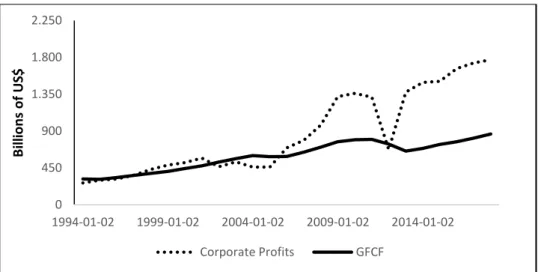
This line of thought matches Kalecki’s (1954) risk theory regarding investment in which fixed capital investments had a higher risk profile, aggravated by increasing proportions of entrepreneurial capital incorporated in it. It is then no surprise that since the early 90’s, in the U.S., the levels of gross fixed capital formation have grown at a pace considerably lower than profits, having also been surpassed by the latter in terms of monetary volume as we can see in Figure 3 below.
Figure 3 - Corporate Profits (After Tax) and Gross Fixed Capital Formation in the US, Seasonally Adjusted and projections until 2018; Data Sources: FRED
We then raise the hypothesis that the inclusion of expectations into investment decisions allows room for unpredictability to thrive, delivering a higher risk profile to fixed capital investments. With the risk factor aggravated by the incorporation of entrepreneurial capital, investors resort to shareholder remuneration or shift their investments to assets that although might have a risky profile are capable to deliver greater returns, as happened in the French and German cases previously described.
2.4 The savings levels
Remembering the Neoclassical capital accumulation equations presented by Robert Solow (1956a) and Trevor Swan (1956b), as well as Keynes’ (1936) investment theory with the decisive contribution of Myrdal (1939) to clarify the concepts of ex ante and ex
0 450 900 1.350 1.800 2.250 1994-01-02 1999-01-02 2004-01-02 2009-01-02 2014-01-02 B ill io n s o f US $ Corporate Profits GFCF
10
post, savings play a decisive role in the matters at hand. It is through the share of
income that is not spent in consumption that households manage to accumulate capital to conduct future investment decisions.
Although in the context of exploring income inequalities, according to Piketty (2014), a country that has a slow pace of economic growth but manages to save a considerable portion of its income can still, in the long-term, accumulate a significant capital stock. It is then of the outmost importance to analyze the performance of savings in the previously mentioned economies, as well as in Portugal, the center of the empirical analysis in sections ahead.
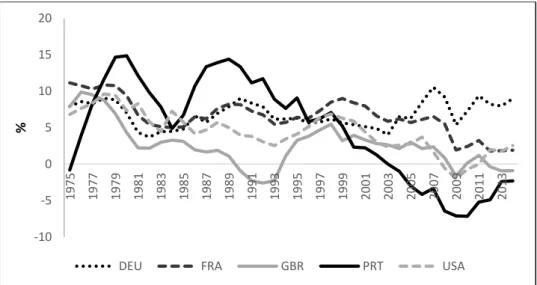
Figure 4: Adjusted savings: net national savings (% of GNI); Data Sources: The World Bank
Figure 5 - Gross Fixed Capital Formation (constant 2010 US $) in Portugal; Data Sources: The World Bank
Figure 4 illustrates that there seems to be a slowdown in savings, or at least a stagnation if we compare the time extremes, particularly in Germany. Combined with Figure 5, the Portuguese case is particularly interesting. If from what we have seen before we could
-10 -5 0 5 10 15 20 1975 1977 1979 1981 1983 1985 1987 1989 1991 1993 1995 1997 1999 2001 2003 2005 2007 2009 2011 2013 %
DEU FRA GBR PRT USA
0 10.000.000 20.000.000 30.000.000 40.000.000 50.000.000 60.000.000 70.000.000 $
11 have the temptation to claim without a rather deep empirical analysis that a given country is combining an increasing degree of financialization with a poor savings performance, thus producing negative consequences in investment (in our case with the analysis focusing on gross fixed capital formation), Portugal appears to be the perfect candidate to fit the hypothesis.
From having extraordinary savings levels during the 70’s and 80’s (although with periodic decreasing levels matching the economic turmoil the country traversed, culminating in two IMF bailouts) Portugal witnessed a major drop that only recently appeared to be halted. It was nevertheless too late to avoid savings (as a percentage of national income) reaching negative levels. The country is now struggling to raise such values and re-enter positive ground that hasn’t been experienced since circa 2003. Given these circumstances, it is no surprise that one solid explanation for the rather modest investment levels of the present is the depletion of the previously accumulated capital stock and the difficulties in replenishing it through savings. In conclusion, regarding savings and observing the referred figures, it is no surprise that investment levels may have possessed a shy performance over the last decades given the performance of this macroeconomic indicator, especially for the Portuguese economy.
12
3. The Model
3.1 Foundations
Having contemplated the contemporaneous debates around investment with a focus in fixed capital, specifically how its classic determinants fare today in face of growing financialization of the economy, this section is dedicated to put to the test the hypothesis raised in the literature review. Such hypothesis consists on understanding if there is in fact an impact of financialization on the investment in fixed capital in Portugal, and if so, if the impact is of a positive nature, contradicting what has been observed in economies such as the U.S., U.K., Germany or France, or negative and thus following the trend of what has been highlighted in similar investigations.
To materialize this in an actual process of investigation and analysis, I choose to undergo an econometric estimation of an equation that can test for the question raised. Therefore, it is imperative to combine a set of economic indicators raging from unquestionable determinants of investment to variables that can account for trends of financialization. Considering what has been discussed previously in the Literature Review and taking in consideration the additional contributions of Lavoie (1992) and Blanchard et al (1986) on real and financial determinants of investment, the equation I will build draws inspiration from Orhangazi (2007) in terms of selected variables and correspondent arrangement. We will then consider an investment function given by
(1) ( )
With all variables being of a yearly nature and reporting to the Portuguese economy, A stands for the stock of the fixed assets in each year, S denotes the business turnover, W identifies labor costs, Ni the end-of-period net income, Ir and Ip interest and similar revenues/expenditures received and paid, correspondingly, while F denotes financial investments and D anticipated dividends to be distributed among shareholders. S and Ni are mobilized as determinants of investment reflected on the existing fixed assets stock,
A, while W, Ir, Ip, F and D account for financialization indicators. All these indicators
will then have to reflect the performances of sectors of the Portuguese economy that are worth looking into in this context.
13 As we are interested in impacts of financialization on the creation of fixed capital, there’s little relevance to look into what is happening with financial enterprises since they aren’t the ones whose business philosophy revolves around creating such type of added value and are more than natural candidates to display obvious signs of financialization. Public-owned enterprises are also out of my target group as they do not comprise the largest share of creation of fixed capital in the country. Therefore, the econometric analysis will have as a target for the hypothesis validation/rejection data collected from non-financial enterprises.
3.2 Data, limitations and econometric methodology
3.2.1 Data
Due to some limitations of data measurement, the original intent of studying these variables of non-financial enterprises at a macroeconomic level for a large time period was set aside to make way for a narrower scope on the methodology. The most significant limitation was data availability for a long time period. Using as my statistical source the Portuguese bureau of statistics (INE – Statistics Portugal), the measurement of the considered variables has suffered a number of changes throughout the years. The rather archaic and limited statistical measurement of the XX century was only properly addressed in 1995 when INE set in motion a process of data compilation and harmonization regarding the country’s corporations, resulting in the publication of the statistics report Sistema de Contas Integradas das Empresas (SCIE) for years to follow. SCIE addressed a number of relevant indicators but was still a very crude tool when compared to what was the reality of statistic bureaus of the major European economies or the U.S. It was replaced by a new type of report in 2005, Empresas em Portugal, which is still being adopted up to this day. Both publications had in enquiries on the firms their data gathering mechanism but, given the methodology changes that have occurred from one being replaced by the other (and even within the same type of report), it proved tremendously hard to have a homogeneous set of variables for the initial design of the time span (1995-2015).
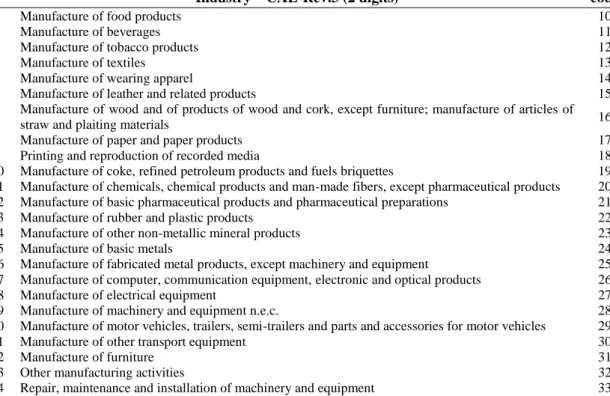
14 Given the context, I decided to directly request the data from INE. To have a balanced panel with homogeneity in terms of the covered periods for all chosen variables, I had to re-develop the model for a six year period (2010-2015) since half of the variables only had data available from 2010 onwards. With a very limited number of observations, to guarantee an adequate degree of statistical quality, I diverged my attention to more specific sectors within the world of non-financial corporations, diving in the first categorization of industries within the manufacturing industries’ general classification. Table 3 below lists the correspondence between the id component of the panel data arrangement, the i subscript in equation (2), and the industries analyzed.
i Industry – CAE-Rev.3 (2 digits) code
1 Manufacture of food products 10
2 Manufacture of beverages 11
3 Manufacture of tobacco products 12
4 Manufacture of textiles 13
5 Manufacture of wearing apparel 14
6 Manufacture of leather and related products 15
7 Manufacture of wood and of products of wood and cork, except furniture; manufacture of articles of
straw and plaiting materials 16
8 Manufacture of paper and paper products 17
9 Printing and reproduction of recorded media 18
10 Manufacture of coke, refined petroleum products and fuels briquettes 19
11 Manufacture of chemicals, chemical products and man-made fibers, except pharmaceutical products 20
12 Manufacture of basic pharmaceutical products and pharmaceutical preparations 21
13 Manufacture of rubber and plastic products 22
14 Manufacture of other non-metallic mineral products 23
15 Manufacture of basic metals 24
16 Manufacture of fabricated metal products, except machinery and equipment 25
17 Manufacture of computer, communication equipment, electronic and optical products 26
18 Manufacture of electrical equipment 27
19 Manufacture of machinery and equipment n.e.c. 28
20 Manufacture of motor vehicles, trailers, semi-trailers and parts and accessories for motor vehicles 29
21 Manufacture of other transport equipment 30
22 Manufacture of furniture 31
23 Other manufacturing activities 32
24 Repair, maintenance and installation of machinery and equipment 33
Table 3 – Identification of the panel data regressors’ subscripts; all denominations according to official INE nomenclature
Therefore, I obtained a panel data configuration that could allow room for specific characteristics of these industries instead of a time series approach, while at the same time extending the number of observations to 144.
15
3.2.2 A brief description of the world of manufacturing industries in Portugal
Before moving to the econometric methodology section, I shall conduct first a brief outlook on the universe of the Portuguese manufacturing industries, complemented with some extra facts in Section 2.3.
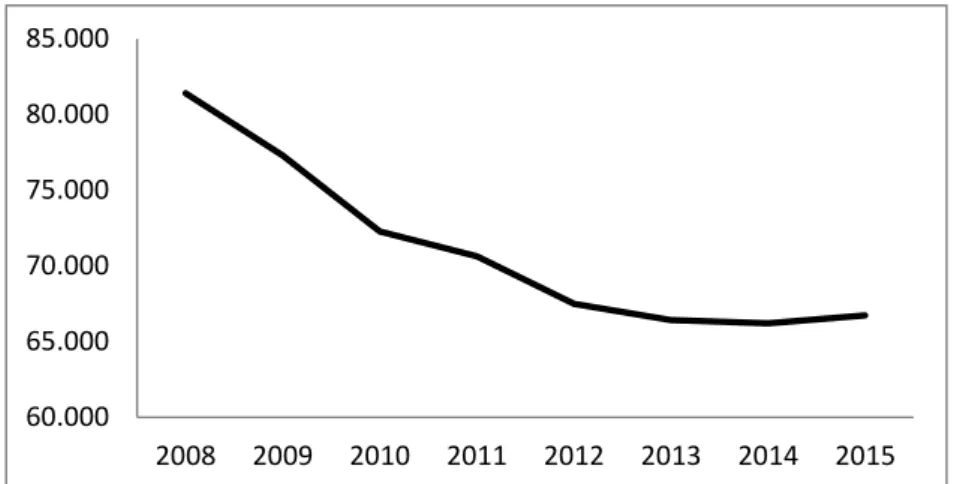
Figure 6 – Number of firms within manufacturing industries in Portugal; Data Sources: INE
Starting with the number of firms active on the economy, Figure 6 shows us that ever since the breakout of the financial and economic crisis their number has shrunk in Portugal, going from 81.387 firms in 2008 to 66.729 in 2015 (a decrease of a total of 14.658 firms). This clearly illustrates the hardships the whole economy has traversed throughout this period, being the manufacturing industries no exception. In depth, Figure 7 illustrates the number of deaths and births1 of manufacturing firms, thus laying
down the net impact and demographic dynamics.
1 By death of an enterprise we consider an activity ceasing due to dissolution of a combination of
production factors that does not involve additional enterprises, thus excluding merging, acquisition or restructuring scenarios (INE Metadata). Intuitively, the opposite holds for a birth.
60.000 65.000 70.000 75.000 80.000 85.000 2008 2009 2010 2011 2012 2013 2014 2015
16
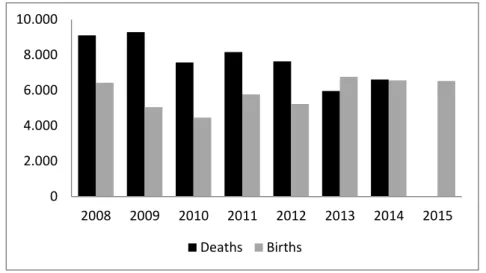
Figure 7 – Number of deaths and births of Portuguese manufacturing firms; Data Sources: INE
It is clear that this economic sector has struggled to thrive under recent economic conditions and was almost subject to a survival of the fittest adaptation. Given the loss of purchasing power of national economic agents and consequential shrinkage of domestic demand, those that ended up following a successful path or at the very best hold on against the storm were undoubtedly the ones whose primary markets were foreign and were able to export the largest shares of their production.
What this data also allows us to conclude is that the year of 2013 seems to be the turning point regarding the economic recovery of the country, illustrated in this case by a more balanced net impact of deaths versus births although there is no disclosed information regarding the latter for 2015. This shortcoming hardens the task of identifying a pattern change in this indicator and so we will have to wait for future data to be measured in order to confirm or deny such shift.
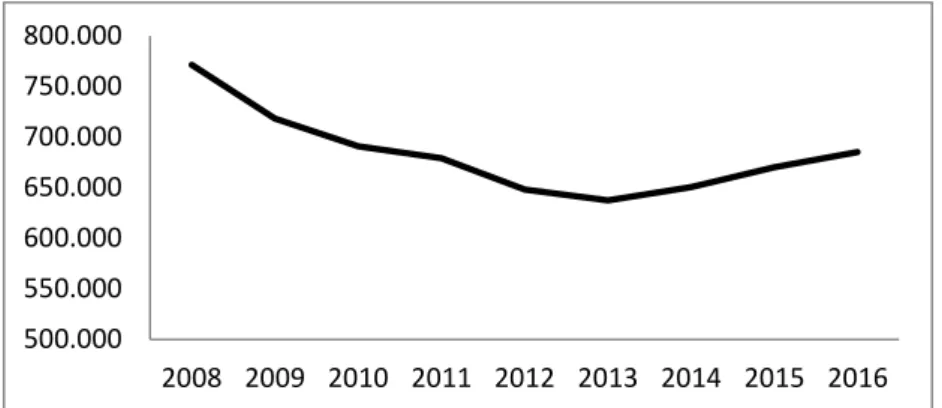
Both as a consequence of the diminishing number of firms, strategic devaluation of labor force and automation-based new methods of production, the number of people employed by these enterprises was also dealt a massive blow, accompanying the general trend of the economy in which unemployment rose to historical levels in this time window, including the all-time record of 16,2% in 2013.
0 2.000 4.000 6.000 8.000 10.000 2008 2009 2010 2011 2012 2013 2014 2015 Deaths Births
17
Figure 8 – Employed personnel by Portuguese manufacturing firms; Data Sources: INE
Now, regarding the profile of manufacturing firms in terms of the quality of their production factors and degree of technological edge, the path toward increased competitiveness is still long and steep. Firms with advanced competitive factors represent more than half of the gross added value of manufacturing firms, confirming their profile of paramount importance in creating value for the Portuguese economy. Within this category we find the enterprises with the codes 18, 20, 21, 22, 23, 24, 25, 26, 27, 28, 29, 30 and 33 according with Table 3 in the previous section.
Year 2008 2009 2010 2011 2012 2013 2014 2015
% 54,55 55,25 54,37 54,76 54,21 53,60 53,98 52,99
Table 4 – Proportion of gross added value from manufacturing firms with advanced competitive factors on the total gross added value of manufacturing firms; Data Sources: INE
Nevertheless, they fail to be the most numerous within the world of manufacturing industries and seem to be stuck on a proportion of circa 42%. If the Portuguese economy needs this sector to be more competitive and help fuel the country’s ambition to retake a steady growth path, it cannot afford to have the priorities of its managers shifting from investing in human capital, R&D and fixed capital to remunerating shareholders or pursue financial investments of short-run returns.
Year 2008 2009 2010 2011 2012 2013 2014 2015
% 42,41 42,80 43,12 43,14 42,96 42,46 42,19 42,10
Table 5 – Proportion of manufacturing firms with advanced competitive factors on the total number of manufacturing firms; Data Sources: INE
500.000 550.000 600.000 650.000 700.000 750.000 800.000 2008 2009 2010 2011 2012 2013 2014 2015 2016
18
3.2.3 Econometric methodology
Following the usual panel data configuration, the regression I will adopt has the linear formal form
(2) with
To estimate the model, I opted to follow a pooled ordinary least squares (OLS) estimation method. Although I mentioned that some inspiration was drawn from Orhangazi (2007) in terms of the variables chosen and equation arragement, it doesn’t go so far as to adopt the same econometric procedure for the model estimation, namely the usage of the Arellano-Bond (1991) generalised method of moments (GMM).
While GMM is a good estimation method for panel data settings in which one is confronted with a larger id dimension than time periods (n>t), endogeneity of explanatory variables and presence of fixed effects, it is best suited for dynamic models in which we often find the presence of a lagged dependent variable on the right-hand side of the equation (giving rise to autocorrelation problems).
Although some of those characteristics and issues might be present in my model as I will discuss in the next few paragraphs, the real asset of GMM is dealing with a dynamic nature of a model since endogeneity is often coped with through the usage of two-stage least squares (2SLS) or instrumental-variables regression methods. Before proceeding with a description of the variables and commenting on the obtained results, some lines must be dedicated to the shortcomings and issues present in this model and specifically in the estimation technique.
As seen in Figure 9 in the Appendix, a Breusch-Pagan/Cook-Weisberg test for heteroscedasticity deemed that the OLS estimators aren’t BLUE (best linear unbiased estimators). This immediately reveals that one or more of three specification errors might be occurring, namely the omission of relevant explanatory variables, an incorrect functional form or correlation between explanatory variables and the errors of the model.
19 Regarding any possible missing explanatory variables that are relevant to the model, a high level of the R2 of the model could dismiss that possibility since it confers to the independent variables being mobilized a strong explanatory power. Nevertheless, the matter is tricky and might conceal a twist: it could also be the case that the model indeed lacks one or more relevant explanatory variables and to compensate it overestimates the coefficients of the existing ones.
To uncover whether there’s in fact an omission of key explanatory variables, first I used STATA’s command ovtest to perform a Ramsey RESET test whose null hypothesis is that no explanatory variables are omitted. Figure 10 in the Appendix delivers the output of such test which deems a rejection of the null hypothesis. One of the most common strategies to cope with specification errors is to rewrite the model in log-log form. This raises another issue which is the fact that two of my explanatory variables, namely D and Ni, comprise negative values for collected data and a third variable, F, several null values. Figure 11 in the Appendix illustrates my attempt to implement this solution as far as I can, meaning that I converted all but those 3 mentioned variables to logarithmic form but I ended up with no practical effect on actually solving the specification error. The hypothetical missing explanatory variables entwine with the hypothesis of an incorrect functional form of the model. Given that no exact same model has been replicated in the literature, let alone for the Portuguese economy, there’s no possibility to back-up the model’s functional form with previously undertaken constructions. Nevertheless, as seen in the Literature Review and Section 3.1, the variables and their disposition gather a certain consensus in the literature and so I choose to proceed with the model as it is.
As for a possible correlation between explanatory variables and the errors of the model, given the limitations of the various econometric software in identifying endogeneity, particularly the one I’m using, STATA, I’m left with the option to make an assumption on whether it is present or not. Since I cannot clearly identify one or more endogenous explanatory variables in the model backed by the software, only through pure intuition, I rule out the implementation of 2SLS or instrumental variables.
Another hypothetical source of problems with the model is the nature of the data itself. If we take in consideration that, for example, the variable D (anticipated dividends) presents consecutive values raging from -1.796.284 to 4 (see Figure 12 in the
20 Appendix), such discrepancy contributes to the sensitivity of the model and possible violations of the Gauss-Markov theorem.
Given this scenario, I decided to use robust standard errors, which are valid under both homoscedasticity and heteroscedasticity, to preserve the model’s unbiasedness and efficiency as much as possible. This is the most common technique to deal with a scenario of heteroscedasticity in a linear regression setting because as Long and Ervin (2000) point out, while moving to the adoption of a weighted least squares (WLS) estimation requires increased assumptions and overall comprises harder implementation, the test statistics under the usage of robust standard errors deliver sufficiently accurate p-values.
Given that this investigation seeks out to assess the hypothetical existence and nature of a relationship between indicators of financialization and investment levels more than its scale, too much importance shouldn’t be conferred to the coefficients, rather it should be focused on the above mentioned p-values. In greater detail, the option taken for the robust standard errors estimation in STATA in this investigation was vce(robust) which provides an assumption relaxation that the errors are identically distributed.
3.3 Variables
A – fixed assets
While choosing the gross fixed capital formation levels for manufacturing firms would seem the logical and obvious choice for independent variable in the context of this model, the predictive power of the model was jeopardized in such scenario. Given the limited time-span of the available data, which is a plausible cause for the “sensitive nature” of the model to different estimation procedures, using such an indicator rendered four of the seven explanatory variables to be statistically insignificant, and thus of no use to my investigation intentions.2
While the gross fixed capital formation translates “resident producers' acquisitions, less disposals, of fixed assets during a given period plus certain additions to the value of non-produced assets realized by the productive activity of producer or institutional
2
21 units” (INE Metadata), the fact that its usage subtracts explanatory power of the regressors led me to use the fixed assets stock of manufacturing firms instead.
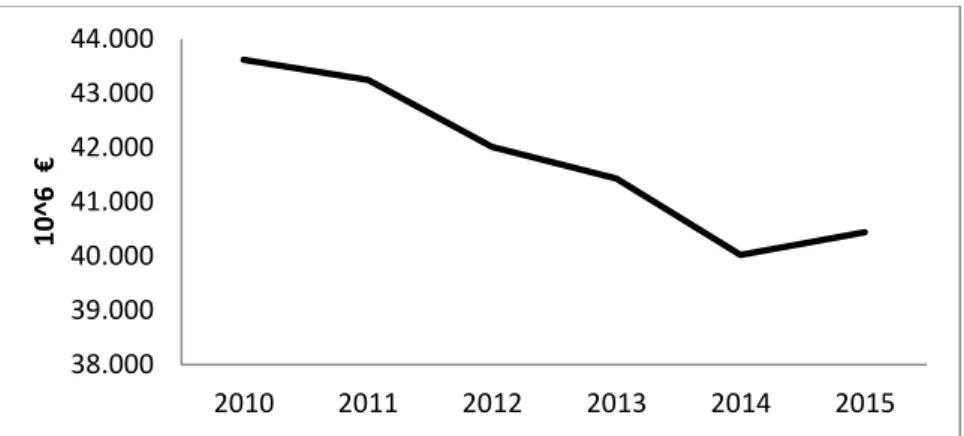
Figure 14 – Fixed assets stock of manufacturing firms in Portugal; Data Sources: INE
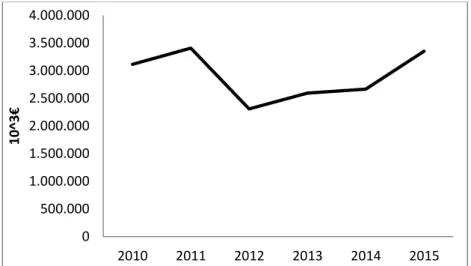
The value of the stock of fixed assets of the Portuguese manufacturing firms has remained quite constant between 2010 and 2015, with a depletion being felt from the beginning of the troika intervention up until 2013 as showcased by Figure 14. Analysing Figure 15 below, for this time period both A and the levels of gross fixed capital formation of manufacturing firms display very identical dynamics (with A lagging the gross fixed capital formation in one year regarding the negative trend inversion) and so the former poses, given my intentions, as a good substitute for the latter.
Figure 15 – Gross fixed capital formation of Portuguese manufacturing firms; Data Sources: INE
23.000.000 23.500.000 24.000.000 24.500.000 25.000.000 25.500.000 2010 2011 2012 2013 2014 2015 10^ 3 € 0 500.000 1.000.000 1.500.000 2.000.000 2.500.000 3.000.000 3.500.000 4.000.000 2010 2011 2012 2013 2014 2015 10^ 3 €
22
S – business turnover
Comprising both net sales and services that firms render as their core activities (INE – Metadata), the business turnover is one of the two variables chosen to serve as fundamental determinants of investment. Through the selling prices of goods and services being set above the production costs, firms are able to build their primary source of income and, from it, apply the generated financial resources in other expenditures, one of those being investment.
Figure 16– Total business turnover of Portuguese manufacturing firms; Data Sources: INE
As Figure 16 clearly demonstrates, the business turnover of Portuguese manufacturing firms suffered a contraction of circa 30.000 million euros between 2010 and 2013. Since exports have been on the rise since 2009 and a considerable portion of these industries have in international markets their priority in placing their products, it is down to the shrinkage of domestic demand to explain the abovementioned contraction.
Figure 17– Total exports and internal demand components, Portugal; Data Sources: PORDATA, INE
As seen in Figure 17, while exports of goods perform well, the components of domestic demand for the Portuguese economy have all traversed a downward trajectory for the
300.000.000 310.000.000 320.000.000 330.000.000 340.000.000 350.000.000 360.000.000 2010 2011 2012 2013 2014 2015 10^ 3 € 0 20.000 40.000 60.000 80.000 100.000 120.000 140.000 2010 2011 2012 2013 2014 2015 10 ^6 €
Exports of goods Private Consumption
23 considered period in my analysis. Only in 2013 they initiate a stabilization period and even mild recoveries for the cases of the private consumption and investment. In conjugation with the information on the behaviour of the business turnover, it seems fair to confirm the hypothesis that the plummeting of domestic demand is indeed a contributing factor for the contraction of the business turnover of Portuguese manufacturing firms.
Going back to the integration of the indicator in the model, I expect it to be positively correlated with the fixed assets stock of the manufacturing industries under study, delivering the relationship:
(3) A/S > 0
Ni – net income
While manufacturing industries are heavily dependent on their sales to achieve breakeven and endure as economically sustainable entities, when we talk about investment there’re two fundamental pathways: credit as fuel and capital accumulation through end-of-period surplus. Given that this analysis covers the Portuguese economy during the 2010-2015 period, due to the difficulties experienced by national economic agents during the troika intervention the credit availability for investment diminished.
Figure 18 – Indebtedness of Manufacturing and Extraction Industries in Portugal; Data Sources: INE
Figure 18 illustrates this reality and clearly highlights that firms from the manufacturing sector not only had a tougher path to obtain credit from banking institutions as they were also pressured to de-leverage their businesses. In accordance with this context, the weight of the capability to conduct investment in fixed capital of manufacturing
38.000 39.000 40.000 41.000 42.000 43.000 44.000 2010 2011 2012 2013 2014 2015 10^ 6 €
24 industries increasingly rested on the shoulders of the firms’ operational profitability and ultimate surplus/deficit.
In the days before the dawn of the financial markets era, there would be no shadow of a doubt that the existence of a net income would directly positively impact a firm’s formation of a fixed capital stock but since I’m raising the hypothesis that shareholder value might have also triumphed in Portugal, again, I could be tempted to set my expectations regarding the relationship between A and Ni as uncertain.
Nevertheless, it is unlikely that a firm which isn’t capable of running a profitable business for some time periods can conduct any investment projects at all. Even though bank-leverage could help, credit mechanisms are allowed so far as to some assurances are provided, one of them (and perhaps the most important) being that the corporation is able to pay back what it owes, and generating profits is a critical step towards that. Given this, assuming that in the long-run there can be no investment without profitability of the operational activities, I expect the following relationship to be verified:
(4) A/Ni > 0
W – labor costs
Incorporating wages and remunerations, by introducing labor costs in the model I try to bring in a dimension of financialization directly related with its impacts on workers. I highlighted before the trends of wages and remunerations stagnating while profits and productivity levels increase. Firms seek to leverage ever growing flexible labor markets to take the most out of an extremely qualified labor force for shorter periods of time of highly intensive productive activity.
Minimizing labor costs while increasing productivity is the nirvana of the twenty-first century employer. Nevertheless, the relationship between labor costs and fixed capital stocks isn’t exactly linear. Since I am dealing with manufacturing industries, a lot of them exports-oriented lower labor costs translate into lower prices of goods, making them more competitive in markets.
Should Portuguese manufacturing firms choose to minimize those costs as a price competition strategy, they generate optimal conditions for a larger surplus. But is that
25 surplus going to be reflected in a fixed capital increment? The answer isn’t clear but the previous analysis of the net income variable also led us to the conclusion that without any surplus there’s no room for investment. What I seek to find out is that if there’s an immediate positive or negative causal relationship between labor costs and the stock of fixed assets of a firm. Regarding this, my expectations are ambiguous and therefore:
(5) A/W >< 0
Ir – received interest and similar revenues
Being a source of income generated in the context of financial operations that aren’t the ones in which the core productive activity of the business belongs to, received interest and similar revenues enter the accounting sheets of manufacturing firms as a secondary revenue source and so it is hard and not so prudent to be categorized as a determinant of investment. By being that marginal element, its analysis is particularly relevant to understand how involved manufacturing firms are in activities and businesses whose generated income doesn’t result from the selling of goods and services and how does that impact the investments they conduct in fixed capital.
The nature of such influence is, however, not entirely clear. As mentioned in the literature review, firms that end up revealing behaviors that fit in what those that increasingly privilege shareholder remuneration rather than investment will most likely contribute to a negative influence over the fixed assets stock. Nevertheless, it could also be the case that manufacturing firms can build up funds with such financial extras and use them to conduct investment projects. Given this ambiguity, I cannot state a clear pre-analysis expectation and so it follows as
(6) A/Ir >< 0
Ip – paid interest and similar expenditures
Similar to received interest and similar revenues, this indicator is another flagship of financialization mobilized in my analysis. A large dimension of these financial expenditures translates two things: a significant exposure of the firms to credit mechanisms and financial operations, which on its own is a sign of a managerial behavior increasingly impacted by financialization, and a negative contribution to the
26 net income levels to be obtained by firms. Although the latter, by being reduced, could negatively impact the amount of financial resources to be dispersed among shareholders through distributed dividends, it is also another origin of the resources to be applied in fixed capital investments. Therefore, considering that the weight of depleting a real determinant of investment surpasses the benefits of hypothetically reducing the amount of income to be distributed through dividends, the ultimate effect of Ip is of a penalizing nature on creating value through an increase of the stock of fixed assets. Therefore, I expect the relationship between A and Ip to be delivered by
(7) A/Ip < 0
F – financial investments
Financial investments include, among others, capital participations as well as loans in subsidiary, jointly-controlled or associated enterprises (INE – Metadata).
Figure 19 – Financial investments of Portuguese manufacturing firms; Data Sources: INE
Figure 19 displays how, over the time period of this analysis, Portuguese manufacturing firms have allocated resources in conducting financial investments. Given that the economy was shook by the 2008 crisis and the capacity to invest was damaged, it is no surprise that this type of investment has suffered repercussions.
This indicator assumes a vital importance on the investigation at hand since such types of investment are a trademark of the financialization of enterprises and, consequently, the economy. Not only firms have to choose between remunerating shareholders or create savings to be applied in investment, within the investment decision they have to pick between several types of endeavors. Imagining those types of investment as
80.000.000 85.000.000 90.000.000 95.000.000 100.000.000 105.000.000 110.000.000 115.000.000 120.000.000 125.000.000 2010 2011 2012 2013 2014 2015 €
27 substitute goods at a consumer’s disposal, although firms have diversified investment portfolios and often combine investments in fixed capital with those of financial nature, they are competing with each other since the resources applied in one cannot be directed towards the other. Therefore, the relationship between financial investments and the stock of fixed assets is expected to follow
(8) A/F < 0
D – anticipated dividends
The main tool at a firm’s disposal to disseminate its financial surplus throughout participating entities in its capital structure is dividend distribution. Thus, anticipated dividends as a variable of shareholder value impact-assessment occupy a central spot in this discussion. The main debate within this subject lies with firms shifting their priorities to meet the shareholder and financial market demands of a short-run nature, pursuing easy returns and fast capital remuneration while discouraging profit retention with future investments in fixed capital in mind.
Given that a firm that chooses to distribute its revenues by a shareholder structure through dividends is limiting itself in terms of financial resources available to conduct investment projects in fixed capital, I expect a clear and unquestionable negative relationship between the stock of fixed assets and anticipated dividends, given by
(9) A/D < 0
3.4 Results and discussion
The following table3 illustrates the model’s output on the explanatory variables, from which an analysis on their predictive quality and results versus expected conclusions can be made.
3
28
Variable Coefficient P-Value
S 0,0789148 0,000 W 0,0504131 0,582 Ni 0,7249482 0,001 Ir -10,48005 0,017 Ip 14,7482 0,000 F 17,69028 0,001 D -5,578673 0,107
Table 6 - Pooled OLS main estimation results
Regarding the variables chosen as determinants of firms’ investment, we find little or no surprises in the obtained results. While the business turnover S has a positive but comparatively smaller role to play in influencing the fixed capital stock of manufacturing industries (a unit increase in S produces an approximate 0,08 predicted unit increase in A), it is the net income of Portuguese manufacturing firms which decisively contributes to an increase in the aforementioned stock (a unit increase in Ni produces an approximate 0,72 unit increase in A).
It is important to remember that one of the previously mentioned econometric problems in Section 2.2.3, namely the possibility of overestimation of the coefficients, can undermine to some extent the analysis. Consequently, I underline the last paragraph of the aforementioned section that it is on the signal of the relationship between the coefficients of the statistically significant regressors and the dependent variable that my primary focus is placed upon. Both regressors are statistically significant with the p-values rejecting the null hypothesis of the individual t-tests. These factors confirm the relevance of S and Ni in this context, validating my intention of including them as valid, positive real determinants of the formation of a stock of fixed assets, in coherence with what has been pointed out in the literature.
Labor costs, W, turn out as the only statistically non-significant explanatory variable with a p-value of 0,582 and therefore cannot have any conclusions drawn out from. Moving on to the variables accounting for effects of financialization on Portuguese manufacturing firms, some interesting conclusions arise given my expectations.
29 Ir is delivered as having a negative impact on A with a fairly large coefficient (a unit increase in Ir produces an approximate -10,48 predicted unit decrease in A). Furthermore, it is statistically significant as it is showcased by the p-value of 0,017. Given the two opposing hypothesis raised on the variable in section 2.3, it could be the case that the one triumphing is the one claiming that firms whose income deriving from financial operations is significant are over-exposed to financialization and therefore not so active in generating fixed capital, rather having a contribution to its depletion. This is however a possible conclusion that doesn’t rule out others that might pose as more logical which, therefore, I open up to be looked upon with increased detail and attention in future research.
On the other hand, the obtained signal for the coefficient of Ip completely contradicts my expectation of a negative relationship with A, based on the line of thought that, being the net income a real determinant of investment, an increase on a variable which ultimately contributes to a lower level of net income will also contribute to a contraction in investment, materialized on the existing fixed capital stock. With a p-value of 0,000 delivering one of the best individual significance levels of the model’s variables, similarly to Ir the value of the coefficient is particularly high (a unit increase in Ip delivers an approximate 14,74 predicted unit increase in A). With A/Ip > 0, it is challenging to identify factors that could explain the nature of this relationship.
One possible hypothesis could be that the negative effect on net income of an expenditure in interest and similar financial payments would be compensated by, say, the fact that such financial resources stay within the Portuguese economy if they would be destined to be paid to domestic lenders, fostering their liquidity and availability to lend further sums of credit to manufacturing industries whom would then apply it in investment in fixed assets. Another possibility could be the fact that larger firms have access to special credit conditions, which ultimately lead to paying interest and other financial expenditures, but at the same time allow room for conducting investment through those funds. Yet again, there’s room for future investigation on this matter once data for more time periods is available, giving us the tools to assess whether such a trend is real or the outcome of some limitation of the model.
Another crucial variable of financialization impact-assessment delivers surprising results given the initial expectations. The relationship between financial investments, F, and A emerges as positive and contradicts my expectations presented in Section 2.3.