Braz. J. of Develop.,Curitiba, v. 6, n. 8, p. 61433-61445 aug. 2020. ISSN 2525-8761
Effect of pH and temperature on hydration kinetics of barley grain
Efeito do pH e da temperatura na cinética de hidratação de grãos de cevada
DOI:10.34117/bjdv6n8-532
Recebimento dos originais:08/07/2020 Aceitação para publicação:25/08/2020
Eduardo Thiago Slomp
Master in Chemical Engineering
University of Blumenau, Department of Chemical Engineering, 3250 São Paulo Street, 89030-000 Blumenau, Brazil
E-mail: edu.slp@gmail.com
Tuany Gabriela Hoffmann
Master in Chemical Engineering
University of Blumenau, Department of Chemical Engineering, 3250 São Paulo Street, 89030-000 Blumenau, Brazil
E-mail: tuanyhoffmann@gmail.com
Daniela Remonatto
PhD in Food Engineering
University of Blumenau, Department of Chemical Engineering, 3250 São Paulo Street, 89030-000 Blumenau, Brazil
E-mail: daniremonatto@gmail.com
Sávio Leandro Bertoli
PhD in Mechanical Engineering
University of Blumenau, Department of Chemical Engineering, 3250 São Paulo Street, 89030-000 Blumenau, Brazil
E-mail: savio@furb.br
Marcela Kotsuka da Silva
PhD in Chemical Engineering
University of Blumenau, Department of Chemical Engineering, 3250 São Paulo Street, 89030-000 Blumenau, Brazil
E-mail: marcelakotsuka@furb.br
Carolina Krebs de Souza
PhD in Chemistry and Toxicology of Foods
University of Blumenau, Department of Chemical Engineering, 3250 São Paulo Street, 89030-000 Blumenau, Brazil
E-mail: carolinakrebs@furb.br
ABSTRACT
Hydration of barley grains consists of increase moisture content and plays a pivotal process of germination in malting. The objective of this work is to analyze the effect of temperature (20 to 30 °C) and pH (5 to 9) in the hydration process of barley grain from BRS Cauê cultivar. For this
Braz. J. of Develop.,Curitiba, v. 6, n. 8, p. 61433-61445 aug. 2020. ISSN 2525-8761
purpose, previous physicochemical and physiological analyses were performed on the barley grain to verify the grain quality. The water transport process during hydration were monitored by moisture content and loss of solids. The results showed that temperature had a significant statistical effect (p < 0.05) on the hydration time, where higher temperature provided faster hydration of the barley grains. On the other hand, results obtained with pH variation showed no significant statistical effect (p < 0.05) on the hydration time. Furthermore, the hydration kinetics of the barley grains was better described using a Peleg Model than a first-order kinetic model. Overall, results support the concept that temperature influences in barley hydration.
Keywords: barley, hydration process, transport phenomena, absorption, malting. RESUMO
A hidratação dos grãos de cevada consiste no aumento do teor de umidade e desempenha um processo fundamental de germinação na maltagem. O objetivo deste trabalho é analisar o efeito da temperatura (20 a 30 °C) e do pH (5 a 9) no processo de hidratação do grão de cevada da cultivar BRS Cauê. Para tanto, análises físico-químicas e fisiológicas foram previamente realizadas no grão de cevada para verificar a qualidade do grão. O processo de transporte de água durante a hidratação foi monitorado pelo teor de umidade e perda de sólidos. Os resultados mostraram que a temperatura teve efeito estatístico significativo (p < 0,05) sobre o tempo de hidratação, onde, maior temperatura proporcionou hidratação mais rápida dos grãos de cevada. Por outro lado, os resultados obtidos com a variação do pH não mostraram efeito estatístico significativo (p < 0,05) no tempo de hidratação. Além disso, a cinética de hidratação dos grãos de cevada foi melhor descrita usando um modelo Peleg do que um modelo cinético de primeira ordem. No geral, os resultados apoiam o conceito de que a temperatura influencia na hidratação da cevada.
Palavras-chave: cevada, processo de hidratação, fenômenos de transporte, absorção, maltagem.
1 INTRODUCTION
The hydration process is of significant importance in processing different grains for many industrial applications, such as cooking, extraction, fermentation, germination and malting. The malting process, applied in breweries for beer production, basically consists of an initial stage of barley grain hydration (steeping), followed by a controlled ‘germination’ stage, which activates the grain enzymatic system that will act on the starch and, when reaches a certain germination point, the process is ceased by kilning (drying) [1].
Barley grain (Hordeum vulgare L.) is the most regularly used cereal in beer production, because of the good starch-protein ratio, which provides better technical characteristics in sensory and physico-chemical properties of beer. However, for socio-economic reasons, breweries also apply other sources of starch, such as rice, corn, sorghum, oats, as well as wheat [1].
For barley grain germination to occur, it must be preceded and primed by the hydration process or steeping, which transports water in the grain by absorption via the micropyle for grain activation. In the hydration process, moisture content increases from 10-14% to 42-44%, softening and increasing the grain over a period of 24-48 h [2,3]. Hydration process has also the objective to
Braz. J. of Develop.,Curitiba, v. 6, n. 8, p. 61433-61445 aug. 2020. ISSN 2525-8761
leach substances that are undesirable in the malting process. As the hydration process of grains is a batch and time-consuming process, mechanisms involved in processing enhancement has largely increased [4].
Studies related to the hydration of barley grains have been carried out in order to optimize this stage of the malting production, by reducing hydration time and using lower temperatures to obtain 42-43% of water content in grains [5,6]. Also, steep water pH has given researchers attention, mainly because this external factor has been reported to strongly affect grain germination and growth processes thereafter [7].
For this reason, the aim of this research paper is to compare the kinetic hydration process of barley grain, under different temperature and pH conditions, to reduce barley hydration time to make the malting process more time, energy and water efficient. The results were evaluated by two models, Peleg and first-order model, in barley grain hydration.
2 MATERIALS AND METHODS
2.1 MATERIAL
The barley grain cultivar used in this study was BRS Cauê, registered by EMBRAPA (Brazilian Agricultural Research Corporation), and provided by Malteria Blumenau, from Santa Catarina state, in Brazil. Barley grains were stored in a raffia package and in a dry location to avoid an increase in moisture content.
2.2 PHYSICOCHEMICAL CHARACTERIZATION
The physicochemical characterization was done to determine grain quality. Grain size, thousand seed weight (TSW), hectoliter weight (HW) and chemical composition were executed. The grain size was determined using an electronic micrometer (0-25 mm, ZAAS) by measuring the longitudinal grain size of 121 samples. The TSW is determined by counting eight repetitions of a thousand seed samples, weighed on a scale (A1000, Marte); and results are expressed in grams. The HW was verified by weighing four samples on a hectolitre scale (Agrologic), with a capacity of a quarter liter of seeds and the results expressed in kilograms per hundred liters (kg 100 L-1).
2.3 PHYSIOLOGICAL CHARACTERIZATION
To verify the physiological status of barley grains, germination power, water sensitivity, germination energy and germination index, were asessed. Germination power was measured by placing 100 barley grains into a watch glass, which were moistened with 4 mL of 0.75% H2O2
Braz. J. of Develop.,Curitiba, v. 6, n. 8, p. 61433-61445 aug. 2020. ISSN 2525-8761
moistened with 8 mL of distilled water. The quantity of grains that germinated in the 72 h period was measured and results are expressed in percentage. The quantity of grains that germinated in the 72 h period corresponds to the germination power, where results are expressed in percentage. While, the germination energy is performed with 100 barley grains placed in Petri dishes with 2 layers of moistened paper with 4 mL of water. The test was carried out under 16 °C thorough 3 days. The germinated grains were quantified in 24, 48 and 72 h. Germination energy results were calculated according to equation 1:
𝐸𝐺 = 𝑛24ℎ + 𝑛48ℎ + 𝑛72ℎ
(Eq. 1)
where 𝐸𝐺 is the germination energy (%) and 𝑛𝑡 is the number of germinated grains at the time t. The germination index was calculated from the results of germination energy, according to equation 2.
𝐺𝐼 = 10 ( 𝑛24ℎ + 𝑛48ℎ + 𝑛72ℎ
𝑛24ℎ + 2𝑛48ℎ+ 3𝑛72ℎ) (Eq. 2)
where 𝐺𝐼 is the gemination index (%).
2.4 HYDRATION PROCESS
The hydration assessment was done in a vessel, made of polypropylene, with 30 cm of diameter and 30 cm in high. In each experiment, 3 kg of barley grains were packaged in permeable packaging (10 cm x 10 cm), with perforations, and submerged in 12 L of water. Inside of the vessel, one flexible duct (made of silicone) provided agitation, assisted by aeration (compressed air), with a flow rate of 0.005 m3 min-1. Aeration was set to operate for 15 min every 3 h. The air insertion during the hydration process helps in homogenization, providing O2 and removing CO2, which
improves endosperm hydration, as reported in the literature [8]. Also, to prevent germination during the hydration process, the water inside the tank was renewed periodically every 6 h. Figure 1 presents a schematic illustration of the hydration set up.
Braz. J. of Develop.,Curitiba, v. 6, n. 8, p. 61433-61445 aug. 2020. ISSN 2525-8761 Figure 1. Schematic illustration of the hydration process.
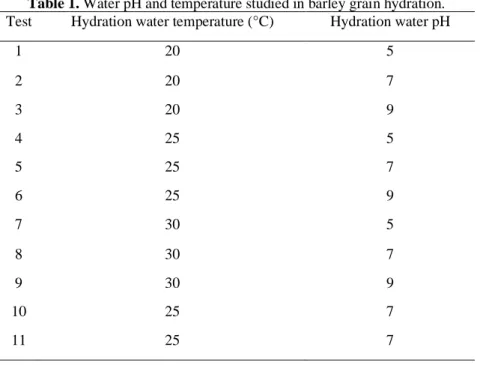
The pH of the hydration water was adjusted (5, 7 and 9), for each treatment, using buffer solutions and measured with a digital potentiometer (Orion brand, model 710A) according to A.O.A.C. [9]. Also, hydration water was maintained constant, at different temperatures (20, 25 and 30 °C), using a thermostatic bath. Also, the external temperature was controlled in an incubator with temperature adjustment to avoid external influences in this study. Experimental tests were conducted as presented in table 1.
Table 1. Water pH and temperature studied in barley grain hydration. Test Hydration water temperature (°C) Hydration water pH
1 20 5 2 20 7 3 20 9 4 25 5 5 25 7 6 25 9 7 30 5 8 30 7 9 30 9 10 25 7 11 25 7
Braz. J. of Develop.,Curitiba, v. 6, n. 8, p. 61433-61445 aug. 2020. ISSN 2525-8761
To verify barley grain hydration, moisture content was measured gravimetrically each 15 min during the first 2 h. After that, measurements were taken every hour, for a total period of 26 h. Water on the barley grain surface was removed with paper towels before analysis. Moisture content was determined in a forced convection oven (Fanem Ltda.) at 105 °C until mass stabilization, according to A.O.A.C [9]. The degree of hydration was evaluated using equation 3, based on the initial (𝑀𝑖) and final (𝑀𝑓) total mass, initial (𝑋𝑖) and final (𝑋𝑓) water content.
𝑀𝑓 = 𝑀𝑖(100 − 𝑋𝑖
100 − 𝑋𝑓) (Eq. 3)
Moisture content obtained was used to fit a polynomial equation, where the time that provides maximum grain hydration can be estimated. For this purpose, the Peleg model (Eq. 4) was fitted to the experimental results.𝑀𝑡 is the moisture content (% dry basis) as a function of time (t),
𝑀0 is the initial moisture content (% dry basis), 𝑡 is the soaking time (h), 𝐾1 and 𝐾2 are Peleg rate constant (h %-1) and Peleg capacity constant (%-1), respectively. 𝐾
1 represents the rate of water
absorption, while 𝐾2 is related to the equilibrium moisture [10]. Once the hydration process consists of water absorption, in equation 4, ‘±’ becomes ‘+’. If the process was drying or desorption, ‘-’ would be applied.
𝑀𝑡 = 𝑀0± 𝑡
𝐾1+ 𝐾2𝑡 (Eq. 4)
Sorption rate (R) can be obtained by the first derivative of the Peleg model as follows in equation 5. Also, the Peleg rate constant (𝐾1) is considered inversely related to the initial water
sorption rate at the beginning (𝑅0), as shown in equation 6.
𝑅 =𝑑𝑀𝑡 𝑑𝑡 = ± 𝐾1 𝐾1+ 𝐾2𝑡 (Eq. 5) 𝑅0 =𝑑𝑀𝑡 𝑑𝑡 |𝑡0 = ± 1 𝐾1 (Eq. 6)
Also, a first-order model was applied to predict barley grain hydration, as shown in equation 7, where 𝜃 is dimensionless moisture, 𝑀𝑠 is the saturated moisture and 𝑘 is the hydration constant
Braz. J. of Develop.,Curitiba, v. 6, n. 8, p. 61433-61445 aug. 2020. ISSN 2525-8761
that represents water incorporation velocity by the barley grain. The first-order model is widely used in hydration applications [11].
𝜃 = 𝑀𝑡− 𝑀𝑠 𝑀0− 𝑀𝑠 = 𝑒
(−𝑘𝑡) (Eq. 7)
2.5 SOLID LOSS
The solid loss was determined by the quantity of solids removed from the washing water, which is the first water change in the maceration process, added to the second water exchanged, to obtain a total loss of solids. A coarse sieve was used to remove the solids, which were weighed to obtain the total of solid loss. Results are expressed as a percentage reduction of barley dry weight compared with the initial percentage [12].
2.6 STATISTICAL ANALYSIS
The experiments were performed according to a full factorial design 32, being the factors the
hydration temperature and pH, with triplicate in factorial design central point. Data were subject to analysis of variance (ANOVA) and Tukey’s test, both at 5% level (p < 0.05) of significance (Statistica software 7.0 version).
3 RESULTS AND DISCUSSIONS
3.1 PHYSICOCHEMICAL CHARACTERIZATION
The average barley grain size was used for the hydration tests was measured and the experimental results showed a grain size of 2.62 ± 0.12 mm. According to Brazilian Regulations for
barley identity and quality (691/1996), barley grain, applied in this study, is classified as type 1 or
first quality, where whole grains of barley are retained in 2.8 and 2.5 mm mesh sieves. Thousand seeds weight (TSW) result obtained was 43.14± 0.82 g. Hectoliter weight (HW) found, in barley grains, was 64.8 ± 2.5 kg.100L-1. The characteristics observed in barley grains indicate a high yield and excellent quality grains [13].
Table 2 presents the basic chemical composition of the barley grain used in this investigation, which may influence the water absorption capacity. However, this association has been found to be complex and does not tend to be linear [14]. According to Yokoyama and Igreja [15], malting barley grain typically has a protein content of less than 12% to yield sufficient extract. Grain protein level was found to be 10.9 ± 0.2% in this study. Lipids results (1.72 ± 0.05%) were observed to be less than reported by Montanuci et al. [16], who reported an average of 2.19 ± 0.06%,
Braz. J. of Develop.,Curitiba, v. 6, n. 8, p. 61433-61445 aug. 2020. ISSN 2525-8761
for the same cultivar. According to Ordinance no. 691 (November 22, 1996) of the MAPA, the moisture content in barley grain, must be less than 13%, as observed in this study it was 10.55 ± 0.03%. The ash and starch content of the barley grains was 1.64 ± 0.02% and 38.67 ± 1.51%, respectively, which was consistent with the levels found in the literature [16, 17]. In general, the results obtained in this study are in agreement with the average values presented in the literature and the barley presented a remarkable malting quality.
Table 2. Chemical composition of barley grain in wet basis (results are expressed as mean ± standard deviation). Barley composition Result (%)
Protein 10.88 ± 0.24 Lipids 1.72 ± 0.05 Moisture content 10.55 ± 0.03 Ash 1.64 ± 0.02 Starch 38.67 ± 1.51 3.2 PHYSIOLOGICAL CHARACTERIZATION
The barley germinative energy obtained in this study was 92.33 ± 0.47%, indicating the amount of grains that germinate when subjected to water. Also, determines the grains that have already passed their dormancy period and if they are able to germinate. The germination power value was 96.22 ± 1.32%. When germination power is less than 95%, mainly because of poor harvesting process or storage, endosperm modification is negatively affected [18, 19]. The germination index was 3.91 ± 0.02%, showing that barley shows a low dormancy depth. According to Frančáková and Líšková [20], high germination index values refer to the high quality and homogeneity of malt. Water sensitivity, reported in this study, was 27.71 ± 2.42%, which according to Kunze [21], the barley sample was classified as water sensitive, and so it was recommended to aerate in dry periods longer than submerged in water.
3.3 HYDRATION KINETICS
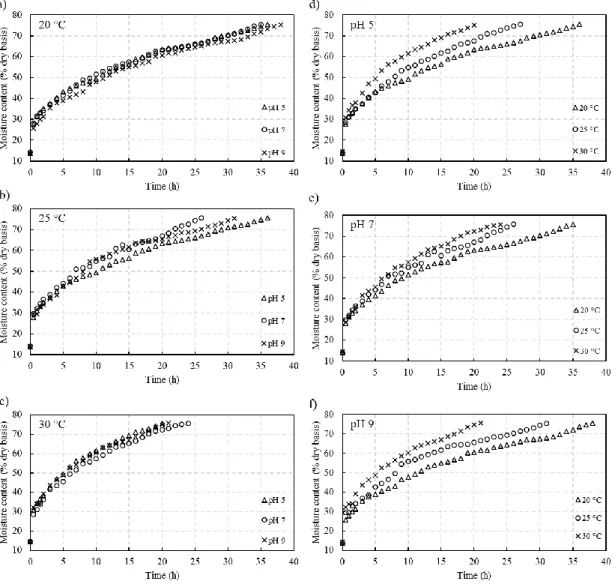
Figure 2 presents the hydration isotherms, resulted from water transfer into the barley grain by the hydration process, at different conditions of temperature and pH. ANOVA results show that temperature significantly affects the hydration process, where higher temperature accelerates the absorption of water in the grain, reducing the immersion time of the product. Increases in temperature has already been reported in the literature to have a positive effect on grain hydration [22-27]. However, Hsu [28] related the diffusion of water in solid endosperm as a control parameter to moisture increase regardless of the process conditions.
Braz. J. of Develop.,Curitiba, v. 6, n. 8, p. 61433-61445 aug. 2020. ISSN 2525-8761
Figure 2. Experimental data of the barley grain hydration process at different temperatures (a-b) and pH (d-f).
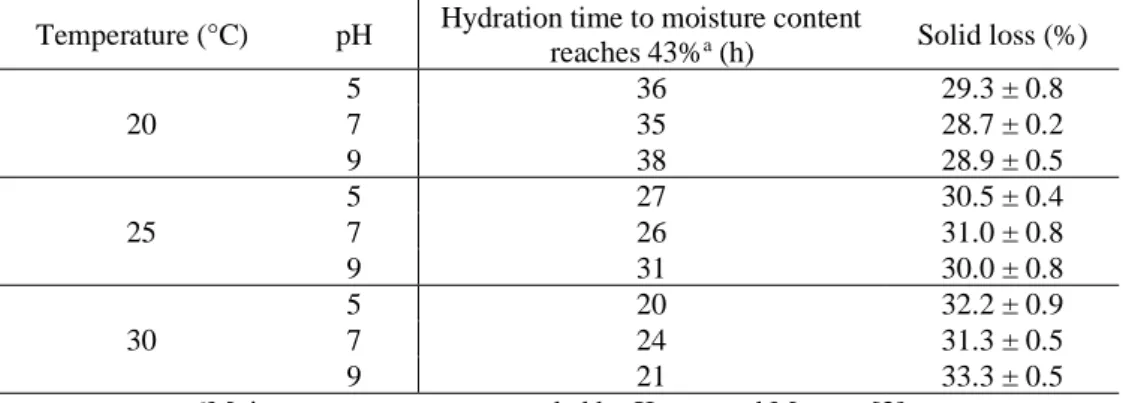
Also, it can be observed that hydration kinetics was faster in the initial hydration stages. According to figure 2, this period lasts approximately 10 hours. Once moisture has increased significantly in grains, mainly through physical mechanisms, water transfer gradually slowed down until saturation had been approached. According to Mayer and Evenari [29], during this period of rapid water absorption in the first phase of the hydration degree, there is a higher loss of solids due to the insertion of water. When water penetrates and diffuses into grains, due to the driving force, the soluble solids dissolve in water, which contributes to higher solid loss at the begging of the hydration process [30]. Table 3 presents the percentage of solid loss at the end of the hydration process and the time required to moisture grain reaches 43%, for each test condition. Higher temperature provided greater solid loss in barley grains, on the other hand, hydration time was shorter.
Braz. J. of Develop.,Curitiba, v. 6, n. 8, p. 61433-61445 aug. 2020. ISSN 2525-8761 Table 3. Hydration time and solid loss for different temperature and pH.
Temperature (°C) pH Hydration time to moisture content
reaches 43%a (h) Solid loss (%)
20 5 36 29.3 ± 0.8 7 35 28.7 ± 0.2 9 38 28.9 ± 0.5 25 5 27 30.5 ± 0.4 7 26 31.0 ± 0.8 9 31 30.0 ± 0.8 30 5 20 32.2 ± 0.9 7 24 31.3 ± 0.5 9 21 33.3 ± 0.5
aMoisture content recommended by Kunze and Manger [2].
In the second phase, water absorption is very slow and may cease completely. This phase can occur from 10 to approximately 20 hours of the hydration process, according to Brookes et al. [31]. In the last and third phase, water is absorbed in a constant linear rate until mass transfer reduction, when equilibrium is reached, correlated with grain metabolism and the visible onset of germination. The third phase can be correlated to the filling of voids in the grain, by water molecules, and the lack of more chemical links, between the grain constituents and water [32, 33].
The variation of pH from soaking water demonstrates to have no statistical influence in grain hydration time. At the higher temperature level (30 °C), in this research, neutral pH shows to has a negative response in water uptake in barley grain. The relation between high temperature and alkaline conditions was already reported in the literature to promote an increase in moisture grain at a shorter time, which is provided through the effects on protein ionization and pectin solubilization [7].
3.4 FITTING MODELS
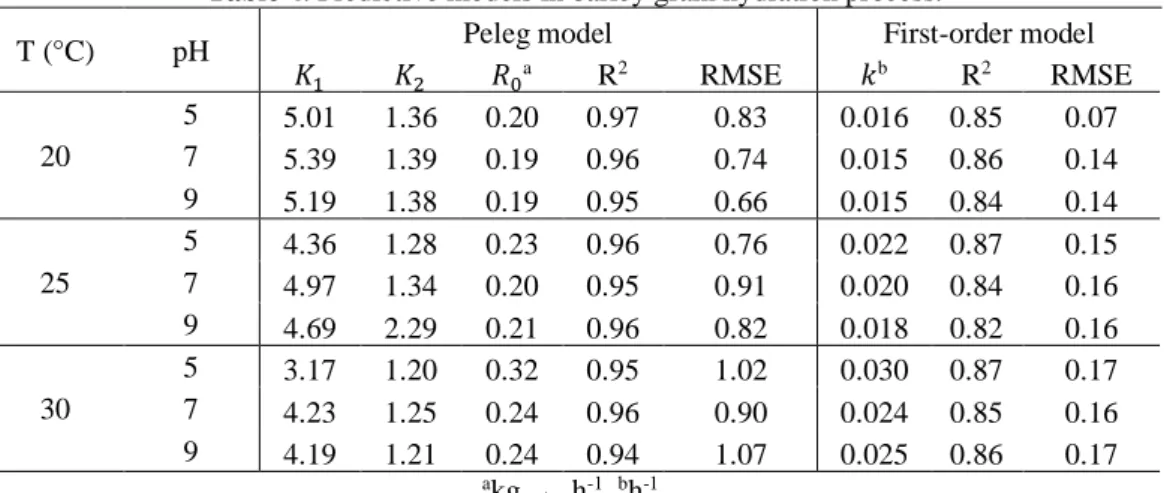
Peleg and a first-order model were applied in order to predict barley grain hydration time during the soaking batch. Table 4 presents results for both parameters models: coefficients of determination and root mean square error (RMSE). Peleg model demonstrates better quality in fitting the predicted model to experimental data than the first-order model. According to Khazaei and Mohammadi [34], the constant 𝐾1 is influenced by the mass transfer rate, where the lower 𝐾1 value, the higher the initial rate of water absorption. While the constant𝐾2 is correlated to the water absorption capacity, indicating that the lower 𝐾2 value, the greater the absorption capacity of the grain at equilibrium.
Braz. J. of Develop.,Curitiba, v. 6, n. 8, p. 61433-61445 aug. 2020. ISSN 2525-8761 Table 4. Predictive models in barley grain hydration process.
T (°C) pH Peleg model First-order model
𝐾1 𝐾2 𝑅0a R2 RMSE 𝑘b R2 RMSE 20 5 5.01 1.36 0.20 0.97 0.83 0.016 0.85 0.07 7 5.39 1.39 0.19 0.96 0.74 0.015 0.86 0.14 9 5.19 1.38 0.19 0.95 0.66 0.015 0.84 0.14 25 5 4.36 1.28 0.23 0.96 0.76 0.022 0.87 0.15 7 4.97 1.34 0.20 0.95 0.91 0.020 0.84 0.16 9 4.69 2.29 0.21 0.96 0.82 0.018 0.82 0.16 30 5 3.17 1.20 0.32 0.95 1.02 0.030 0.87 0.17 7 4.23 1.25 0.24 0.96 0.90 0.024 0.85 0.16 9 4.19 1.21 0.24 0.94 1.07 0.025 0.86 0.17 akg water h-1. bh-1.
Results show that the Peleg constant parameter 𝐾1 has a standard behavior decreasing with the increase in temperature, which indicates that 𝐾1 is inversely proportional to the temperature. Also, neutral pH resulted in higher 𝐾1value and when pH was set distant from neutral conditions (acid or alkaline), the opposite was observed (𝐾1 decreased). The same behavior was verified for Peleg constant parameter 𝐾2. Several studies, conducted with corn, millet, sorghum, red beans, soybeans and amaranth grains also showed decreasing 𝐾1 values with temperature increase [10, 14, 27, 35]. Montanuci et al. [6] found Peleg constant parameters values close to this study with the same cultivar (BRS Cauê). While, in first-order hydration kinetics, the hydration constant (𝑘) increases according to the increase in temperature, as observed also by Montanuci et al. [6].
4 CONCLUSIONS
The temperature had a significant influence on hydration kinetics BRS Cauê cultivar of barley grain, while pH showed no significant effect on grain hydration. Hydration curves were divided into three phases, highlighting the initial rapid water absorption, the second phase of greater stabilization in the hydration rate, and the slow and constant absorption phase. Peleg model presented better adjustment than the first-order kinetics model, satisfactorily describing the hydration characteristics of barley grains. Peleg constant parameters 𝐾1 and 𝐾2 have a decreasing pattern with the increase in temperature. These findings reinforce that temperature plays a pivotal role in the hydration process of barley grains.
REFERENCES
1. Boulton, C.; Quain, D.: Brewing yeast and fermentation, Oxford: Blackwell, 2006.
2. Kunze, W.; Manger, H.: Technology Brewing and Malting (3rd edn.). Berlin: Versuchs- und Lehranstalt für Brauerei, 2004.
Braz. J. of Develop.,Curitiba, v. 6, n. 8, p. 61433-61445 aug. 2020. ISSN 2525-8761
3. Montanuci, F. D.; Jorge, L. M. M.; Jorge, R. M. M.: Effect of time and temperature on the hydration process of barley grains, International Journal of Heat and Mass Transfer, 51 (2015), pp. 363-372.
4. Miano, A. C.; Augusto, P. E. D.: The Hydration of Grains: A Critical Review from Description of Phenomena to Process Improvements. Comprehensive Reviews in Food Science and Food Safety, 17 (2018), pp. 352-370.
5. Basunia, M. A.; Abe, T.: Adsorption isotherms of barley at low and high temperatures, Journal of food engineering, v. (2005), pp. 129-136.
6. Montanuci, F. D.; Perussello, C. A.; Jorge, L. M. M.; Jorge, R. M. M.: Experimental analysis and finite element simulation of the hydration process of barley grains, Journal Food Engineering, 131 (2014), pp. 44-49.
7. Haladjian, N.; Fayad, R.; Toufeili, I.; Shadarevian, S.; Sidahmed, M.; Baydoun, E.; Karwe, M.: pH, temperature and hydration kinetics of faba beans (Viciafaba L.). Journal Food Processing and Preservation, 27 (2013), pp. 9-20.
8. Briggs, D. E.; Kelly, L.: Barley maturity and the effects of steep aeration on malting, Journal of Institute Brewing, 98 (1992), pp. 329-334.
9. Association of Official Analytical Chemists (AOAC) (2005). Official methods of analysis of AOAC (18rd edn.). Arlington, VA: AOAC.
10. Peleg., M.: An empirical model for the description of moisture sorption curves, Journal Food Science, 53 (1988), pp. 1216-1217.
11. Gowen, A.; Abu-ghannam, N.; Frias. J.; Oliveira, J.: Influence of pre-blanching on the water absorption kinetics of soybeans, Journal Food Engineering, 78 (2007), 965–971.
12. Maskan, M.: Effect of maturation and processing on water uptake characteristics of Wheat, Journal Food Engineering, 47 (2001), pp. 51-57.
13. Guarienti, M.: Qualidade industrial do trigo (2rd edn.), Passo Fundo: Embrapa, 1996.
14. Sopade, P. A.; Ajisegiri, E. S.; Badau, M. H.: The use of Peleg’s equation to model water absorption in some cereals grain during soaking, Journal Food Engineering, 15 (1992), pp.269-283.
15. Yokoyama, L. P.; Igreja, A. C. M.: Principais lavouras da região Centro-Oeste: variações no período 1975-1987, Pesquisa Agropecuária Brasileira, 27 (1992), pp. 727-736.
16. Montanuci, F. D.; Jorge, L. M. M.; Jorge, R. M. M.: Kinetic, thermodynamic properties, and optimization of barley hydration, Food Science Technology, 33 (2013), pp. 690-698.
17. Fujita, A.H.; Figueroa, M. O. R.: Composição centesimal e teor de b-glucanas em cereais e derivados, Ciência e Tecnologia de Alimentos, 23 (2003), pp. 116–120.
18. Bamforth, C. W.; Barclay, A. H. P.: Malting technology and the uses of malt, Barley: Chemistry and Technology, 1993.
19. Proudlove, M. O.; Baxter, D.: The structure of barley endosperm - an important determinant of malt modification, Journal of the Science of Food and Agriculture, 79 (1999), pp. 37-46. 20. Frančáková, H.; Líšková, M.: Dormancy of malting barley in relation to physiological
parameters of barley grain, Acta Fytotechnica et Zootechnica, 12 (2009), pp. 20–23.
21. Kunze, W.: Technology Brewing and Malting (2rd edn.). Berlin: Versuchs- und Lehranstalt für Brauerei, 1999.
22. Quast, D. G.; Silva, S. D.: Temperature dependence of hydration rate and effect of hydration on the cooking rate of dry legumes, Journal Food Science, 42 (1977), pp. 1299–1303.
23. Kon, S.: Effect of soaking temperature on cooking and nutritional quality of beans, Journal Food Science, 44 (1979), pp. 1329-1334.
24. Sopade, P. A.; Obekpa, J. A.: Modelling water-absorption in soybean, cowpea and peanuts at three temperatures using Peleg equation, Journal Food Science, 55 (1990), pp. 1084-1087. 25. Hung, T. V.; Liu, L. H.; Black, R. G.; Trewhella, M. A.: Water absorption in chickpea and field
Braz. J. of Develop.,Curitiba, v. 6, n. 8, p. 61433-61445 aug. 2020. ISSN 2525-8761
26. Seyhan-gürtas, F.; Ak, M. M.; Evranuz, E. O.: Water diffusion coefficients of selected legumes grown in turk as affected by temperature and variety, Turkish Journal of Agriculture and Forestry, 25 (2001), pp. 297-304.
27. Maskan. M.: Effect of processing on hydration kinetics of three wheat products of the same variety, Journal Food Engineering, 52 (2002), pp. 337–341.
28. Hsu, K. H.: A diffusion model with a concentration-dependent diffusion coefficient for describing water movement in legumes during soaking, Journal Food Science, 48 (1983), pp. 618-622.
29. Mayer, A. M.; Evenari, M.: The Activity of organic acids as germination inhibitors and its relation to pH, Journal of Experimental Botany, 4 (1953), pp. 257-263.
30. Bayram, M.; Kaya, A.; Oner, M. D.: Changes in properties of soaking water during production of soy-bulgur, Journal Food Engineering, 61 (2004), pp. 221-230.
31. Brookes, P. A.; Lovett, D. A.; Macwilliam, J.C.: The steeping of barley. review of the metabolic consequences of water uptake, and their practical implications, Journal of Institute Brewing, 82 (1976), pp. 14-26.
32. Borges, C. W. C.; Jorge, L. M. M.; Jorge, R. M. M.: Kinetic modeling and thermodynamic properties of soybean cultivar (BRS257) during hydration process, Journal Food Process Engineering, 40 (2017), pp. 1-8.
33. Marques, B. C.; Jorge, L. M. M.; Jorge, R. M. M.: Hydration kinetics, physicochemical composition, and textural changes of transgenic corn kernels of flint, semi-flint, and dent varieties, Food Science and Technology, 34 (2014), pp. 88-93.
34. Khazaei, J.; Mohammadi, N.: Effect of temperature on hydration kinetics of sesame seeds (Sesamum indicum L.), Journal Food Engineering, 91 (2009), pp. 542-552.
35. Resio, A. C.; Aguerre, R. J.; Suarez, C.: Hydration kinetics of amaranth grain, Journal Food Engineering, 72 (2006), pp. 247–253.