www.ccarevista.ufc.br ISSN 1806-6690
Kinetics study and modelling of sorghum grain hydration
1Estudo e modelagem da cinética de hidratação de grãos de sorgo
Danielli Alessandra Reino Olegário da Silva2
, Luiz Mário de Matos Jorge3
and Regina Maria Matos Jorge2*
ABSTRACT - Sorghum grains were soaking to evaluate the effects of time and temperature on moisture and process modelling was maked with different mathematical equations. Then, sorghum BRS 310 and BRS 655 were hydrated at 30 °C, 40 °C, 50 °C and 60 °C, for 12 hours. The hydration kinetics modelling with empirical equations of Peleg and Page and phenomenological equations of Diffusion and Omoto-Jorge were considerad. The time and temperature affected significantly the hydration kinetics of grain sorghum. The Peleg and Diffusion models showed the best fitting for soaking and, therefore, these models were used to create generalized models. The effective diffusion coefficient of water during the grain sorghum hydration ranged from 2.02x10⁻¹¹ to 6.34x10⁻¹¹ m².s-1 for BRS 310 and from 2.76x10⁻¹¹ to 4.38x10⁻¹¹ m².s-1 for
BRS 655 with activation energies of 11.52 and 31.21 kJ.mol-1, respectively.
Key words:Sorghum bicolor. Water diffusivity. Water absorption.
RESUMO - Neste estudo, grãos de sorgo foram hidratados para avaliar os efeitos do tempo e temperatura na umidade e modelar o processo com diferentes equações matemáticas. Para esse fim, as cultivares de sorgo BRS 310 e BRS 655 foram submetidas à hidratação nas temperaturas de 30 ºC, 40 ºC, 50 ºC e 60 ºC, por um período de 12 horas. O processo de hidratação foi modelado com as equações empíricas de Peleg e Page e com os modelos fenomenológicos de Difusão e Omoto-Jorge. O tempo e a temperatura afetaram significativamente a cinética de hidratação dos grãos de sorgo. Os modelos de Peleg e de Difusão apresentaram ajustes mais satisfatórios para o processo e, por isso, foram generalizados. O coeficiente de difusão efetivo de água nos grãos durante a hidratação variou de 2,02.10-11 a 6,34.10-11 m².s-1 para a cultivar BRS 310 e de 2,76.10-11 a
4,38.10-11 m².s-1 para a BRS 655 com energias de ativação de 31,21 e 11,52 kJ.mol-1, respectivamente.
Palavras-chave:Sorghum bicolor. Difusividade de água. Absorção de água.
DOI: 10.5935/1806-6690.20190006 *Author for correspondence
Received for publication in 01/03/2016; approved in 14/03/2018
1Parte da Dissertação do primeiro autor apresentada no PPGEAL da Universidade Federal do Paraná e do Projeto de Pesquisa de autoria do terceiro
autor com financiamento do CNPq
2Departamento de Engenharia Química, Programa de Pós-Graduação em Engenharia de Alimentos, Universidade Federal do Paraná/UFPR,
Curitiba-PR, Brasil, [email protected], [email protected] (ORCID ID 0000-0003-3561-3555)
INTRODUCTION
Sorghum is the fifth most produced cereal in the world, behind only rice, corn, wheat and barley (FOOD AND AGRICULTURE ORGANIZATION OF THE UNITED NATIONS, 2015). This grain is often recommended as a safe food for celiac patients because it does not have the gluten proteins present in cereals of
the genus Triticum sp. such as wheat, rye, and barley.
Therefore, sorghum can be used in a variety of gluten-free foods such as beers, porridge, couscous, parboiled sorghum, starch and fermented and unfermented sorghum-based products, common in many countries in Africa, Asia and Central America (ARENDT; ZANNINI, 2013).
The pre-processing of sorghum for food manufacturing, such as starch, malt and flour, usually involves a stage of hydration of the grains. The moisture gain during hydration directly affects the quality of the
final product (MIANOet al., 2018).
Thus, research on the hydration behavior of sorghum grain is very important for the process control and optimization. Mathematical models have often been used for this purpose because they are able to predict water absorption as a function of time and temperature of hydration. Studies with different models are relevant to identify the one that describes the process more appropriately (BALBINOTI; JORGE, JORGE, 2018).
Empirical equations such as the Peleg model (BADAU; NKAMA; JIDEANI, 2005; KASHIRI; KASHANINEJAD; AGHAJANI, 2010; PATERO; AUGUSTO, 2015) and Page (KASHIRI; GARMAKHANY; DEHGHANI, 2012), and theoretical Diffusion (FAN; CHU, SHELLENBERGER, 1963) were used in the hydration modelling of sorghum grains. However, the use of the Omoto-Jorge model and the comparative study employing several mathematical models, in order to find the best fit for the hydration of sorghum grains, have not yet been reported in the literature.
Thus, the objective of this work was to identify, among several mathematical models, the one that best describes the water absorption during hydration of sorghum grains, evaluating the effect of time and process temperature. To that end, two cultivars of sorghum of different classes were used: one of red sorghum grain, used in the manufacture of foodstuffs for human and animal consumption and a cultivar of brown grains of forage sorghum with characteristics directed to the production of animal silage, BRS 310 and BRS 655 respectively. Grains belonging to two distinct classes were used to identify if cultivars with very different characteristics had the same behavior during hydration kinetics and thusly, a single equation was promising to model a larger quantity of
sorghum cultivars. In addition, the water diffusivity in the grains and the activation energy of the hydration process were obtained.
MATERIALS AND METHODS
Samples
Hybrids BRS 310 (red grain sorghum) and BRS 655 (brown grain sorghum), two of the most produced sorghum cultivars in Brazil, were used in this study. The samples were cultivated in the Center-West of Brazil, crop 2014.
Hydration process
For the sorghum grain hydration experiment, approximately 500 g of sample of each cultivar were immersed in distilled water in a proportion of 1:3 (m/v) and hydrated for a period of 12 hours at temperatures of 30 °C, 40 °C, 50 °C and 60 °C. Samples were taken in triplicate and surface dried at 30-minute intervals over the first four hours and 60 minutes in the remainder of the experiment. The moisture (wet basis) was obtained by the oven-dry method at 105 °C for 24 hours in triplicate (ASSOCIATION OF OFFICIAL ANALYTICAL CHEMISTS, 2012).
Modelling
There are many models that may be appropriate to describe the hydration of cereals and vegetables. On choosing the model best fit model, small deviations from experimental data and the model simplicity of the model must be taken into account. Empirical models have been extensively used for their simplicity, while theoretical or phenomenological models bring greater physical significance to the equation (KASHIRI; KASHANINEJAD; AGHAJANI, 2010).
Empirical models
Peleg’s model
The non-exponential empirical model most commonly used to describe the hydration of vegetables and grains was developed by Peleg (1988) to predict the soaking of powdered milk and rice grains (Equation 1).
(1)
Where: t is the time (h); Mt, the moisture at time t (%
w.b.); M0, initial moisture (% w.b.); k1, the constant
rate of Peleg (h.% w.b-1.) and k
2, the Peleg capacity
Page’s Model
In 1949, Glen E. Page developed an equation to describe the drying of corn grains (Equation 2), which is currently one of the most used to describe the hydration of foods (CUNEO; OLIVEIRA; OLIVEIRA, 1998).
(2)
Where: Mt is the moisture at time t (% w.b.); Me is the
equilibrium moisture (% w.b.); M0 the initial moisture (%
w.b.); t is the time (h); kp (h-1) is the absorption rate of the
process and N is a dimensionless constant.
Phenomenological Models
Omoto-Jorge’s model
A phenomenological model was developed by Omoto, Andrade and Jorge (2009) to describe the hydration of peas from a mass balance in the grain in a transient regime based on the mass transfer by convection.
Considering a mass flow NA = KS(ρeq- ρA), where ρA is the
mass water concentration in the grain (g.cm-³), ρ
eq is the
mass water concentration in the equilibrium (g.cm-³) and K
s
is the mass transfer coefficient (cm.min-1), considering
the spherical grain of radius r, and the initial condition
ρA = ρA0 at t = 0:
(3)
Diffusion Model, Effective Diffusion Coefficient and Activation Energy
Considering Fick’s diffusion laws and mass balance on the grain surface, the diffusion in a spherical body, whereas the transport of water only in the radial direction, can be represented by Equation 4 (CRANK, 1975).
(4)
Where:M is the humidity;a is the radial coordinate (m)
and t the time (h).
Assuming the sorghum grain have spherical geometry, particle volume is constant, effective diffusion
coefficient (Def) independent of concentration, grain
surface comes to equilibrium instantaneously right after its immersion and following initial and boundary conditions:
• Initial condition: grain moisture is uniform, M0;
• Boundary condition: the grain surface maintains
equilibrium moisture, Me.
The analytical solution for Equation 4 is Equation 5.
(5)
Where: r is the radius of the grain (m).
The dependence between grain diffusivity and hydration temperature can be described by Arrhenius equation (Equation 6).
(6)
Where: Def is the effective diffusivity (m².s-1), D
0 is the
proportionality constant (m².s-1), E
a is the activation
energy (kJ.mol-1), T is the temperature (K) and R is the
gas constant.
Validation and model choice
The validation of the models was performed by Analysis of Variance (ANOVA) and residue analysis. The adjustment level was evaluated by the coefficient of determination (R²) and by the deviation analysis performed by means root mean square error (RMSE) (7) and the relative mean error (P) (8).
(7)
(8)
Where: Mexp is the moisture measured experimentally,
Mpre is the moisture predicted by the model, n is the
number of experimental points and GRL is the degree of freedom.
Statistical Analyses
The effect of time and temperature on water uptake by the grains was determined using the analysis of variance (ANOVA) at 95% significance level, with analysis of differences between the means by the Tukey test, also at 95% sginificance level.
RESULTS AND DISCUSSION
Hydration kinetics
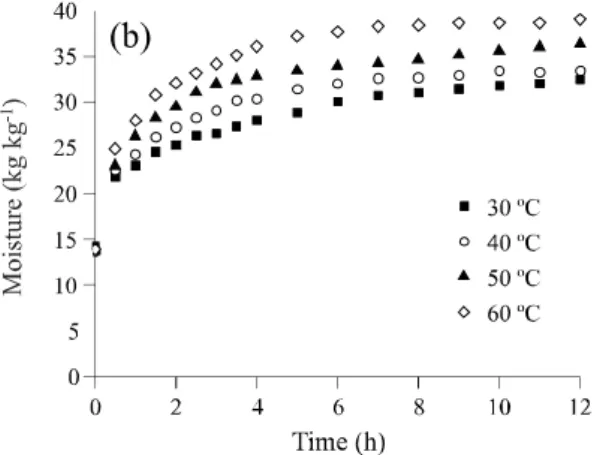
The moisture content in sorghum BRS 310 (Figure 1a) and BRS 655 (Figure 1b) during hydration at different temperatures show a initial high rate of water
absorption (g h-1) that decreases with the approximation
Several mass transport mechanisms are responsible for the migration of water into the grain during the soaking, such as capillarity, liquid diffusion and vapor diffusion. However, the hydration process has been considered a phenomenon mainly controlled
by liquid diffusion (OLI et al., 2004; PRASAD;
VAIRAGAR; BERA, 2010; RESENDE; CORRÊA, 2007).
On the other hand, the high initial absorption rate probably occurs due to the effect of capillarity that accelerates water penetration into the grain (FAN; CHU; SHELLENNBERGER, 1963; KASHIRI; GARMAKHANY; DEHGHANI, 2012; PRASAD; VAIRAGAR; BERA, 2010). Firts, the grain channels and cracks allow a rapid inflow of water, increasing the initial absorption rate. Thus, until the complete saturation of the porous structure, the water absorption is extremely accelerated (BECKER, 1960; KASHANINEJAD; DEHGHANI; KASHIRI, 2009). In addition, the diffusion of water inside the grain is also fast because the initial driving force of the process is higher (KASHIRI; GARMAKHANY; DEHGHANI, 2012; PRASAD; VAIRAGAR; BERA, 2010).
After the first hour of hydration, there was a reduction in the amount of water absorbed, which is probably due to the saturation of the grain pores, which reduces the effect of capillarity, and to the increase of water concentration inside the grain, which decreases the gradient of concentration in the grain (KASHANINEJAD; DEHGHANI; KASHIRI, 2009; KASHIRI; GARMAKHANY; DEHGHANI, 2012; PRASAD; VAIRAGAR; BERA, 2010).
Thus, the immersion time of the sorghum grains interfered significantly in the moisture gain for both
cultivars (p<0.05). Sorghum also absorbed more water at higher temperatures during hydration (p<0.05). These observation are in agreement with other researchs (MONTANUCI; JORGE; JORGE, 2013; RESENDE; CORRÊA, 2007). This fact occurs because the temperature increase expands and softens the grain, increasing the water absorbed (KASHANINEJAD; DEHGHANI; KASHIRI, 2009).
Then, the hydration temperature affects the moisture of the sorghum grains BRS 310 and BRS 655 and can be used to reduce the process time required for the grain to absorb the desired amount of water.
Hydration kinetics modeling
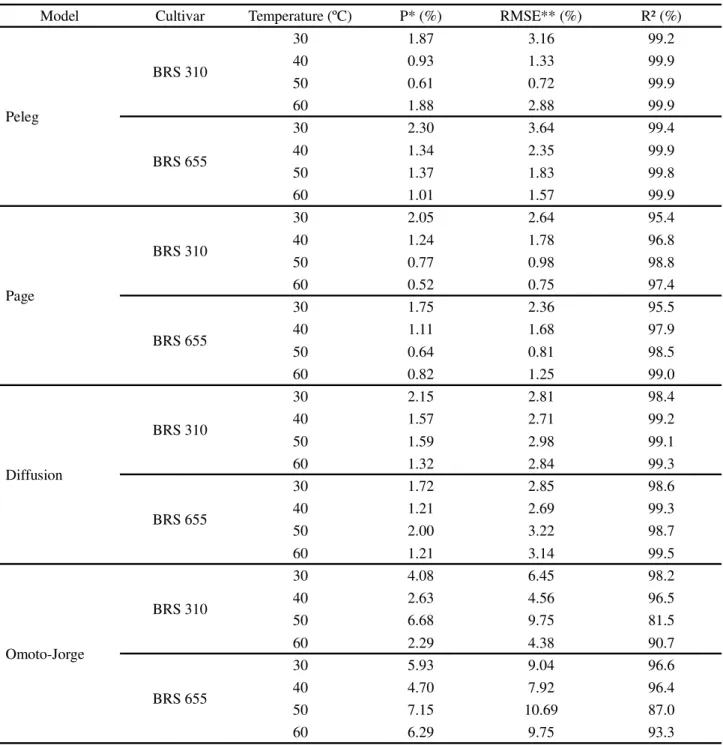
The four equations selected for the sorghum hydration process (Peleg, Page, Diffusion and Omoto-Jorge) presented values of calculated F value greater than F statistic from the Analysis of Variance at 95% and 99% significance level. These proving that the regression is significant and the residuals are small. In addition, the residuals were randomly dispersed as a function of time, validating the models studied in this work. The values of coefficient of determination (R²), root mean square error (RMSE) and relative mean error (P) can be observed in Table 1.
The models presented R² between 81.5% and 99.9% and the Peleg model obtained the highest values among the models used. In order for a model to be considered acceptable to describe the process, the value of the relative mean error (P) should be less than 10% and the root of the mean error value (RMSE) less than 5% (MAIORANO; MANCINI; REYNERI, 2010). Moreover, when P is less than 5%, a better fit is assigned to the model (LOMAURO; BAKSHI; LABUZA, 1985).
Table 1 - Parameters of the models as a function of the hydration temperature of sorghum grains
* Relative average error; ** Square root of mean square error
Model Cultivar Temperature (ºC) P* (%) RMSE** (%) R² (%)
Peleg
BRS 310
30 1.87 3.16 99.2
40 0.93 1.33 99.9
50 0.61 0.72 99.9
60 1.88 2.88 99.9
BRS 655
30 2.30 3.64 99.4
40 1.34 2.35 99.9
50 1.37 1.83 99.8
60 1.01 1.57 99.9
Page
BRS 310
30 2.05 2.64 95.4
40 1.24 1.78 96.8
50 0.77 0.98 98.8
60 0.52 0.75 97.4
BRS 655
30 1.75 2.36 95.5
40 1.11 1.68 97.9
50 0.64 0.81 98.5
60 0.82 1.25 99.0
Diffusion
BRS 310
30 2.15 2.81 98.4
40 1.57 2.71 99.2
50 1.59 2.98 99.1
60 1.32 2.84 99.3
BRS 655
30 1.72 2.85 98.6
40 1.21 2.69 99.3
50 2.00 3.22 98.7
60 1.21 3.14 99.5
Omoto-Jorge
BRS 310
30 4.08 6.45 98.2
40 2.63 4.56 96.5
50 6.68 9.75 81.5
60 2.29 4.38 90.7
BRS 655
30 5.93 9.04 96.6
40 4.70 7.92 96.4
50 7.15 10.69 87.0
60 6.29 9.75 93.3
Thus, the Peleg, Page and Diffusion models were able to predict the hydration process with good adjustments because they presented values of P and RMSE of less than 5% (MAIORANO; MANCINI; REYNERI, 2010).
In order to choose the most appropriate model, the one with the highest coefficient of determination (R²) and the lowest values of P and RMSE (KASHANINEJAD
et al., 2007; PRASAD; VAIRAGAR; BERA, 2010) are
taken into account. The Peleg model showed the highest R² values for both cultivars, while the Page, Peleg and Diffusion models showed lower SE, RMSE or P at certain temperatures.
to develop a generalized equation of the process for obtaining the best adjustments.
Generalized models
A generalized model provides information on grain moisture during the hydration step as a function of time and temperature, and is of interest to the industry of starch, malt and sorghum flour.
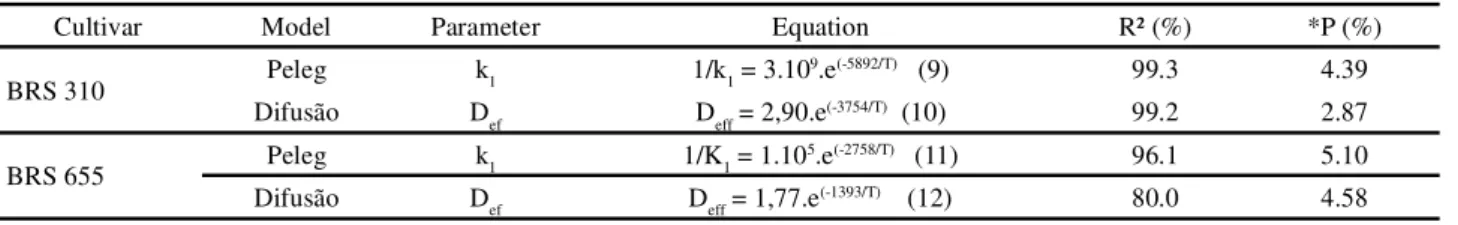
In order to obtain the generalized models of Peleg and Diffusion, the parameters of each model proportional to the rate of absorption of water in the grain
(k1 for Peleg and Def for the model of Diffusion) could
be related to the temperature with Arrhenius equation, by means of Equations 9 and 10 for the Peleg model, and 11 and 12 for the diffusion model, with good fit (Table 2).
The equations obtained R² values greater than 80% and relative mean error (P) less than 6% for the two sorghum cultivars (Table 2).
To obtain the generalized Peleg model, the
parameter k2could be related to temperature by a linear
equation (RESENDE; CORRÊA, 2007). The R² values were greater than 95% and P values were lower than 7% (Table 3).
The generalized Peleg and Diffusion models are presented in Figures 2 and 3 for cultivars BRS 310 and BRS 655, respectively.
Both generalized models were also validated because they presented random residuals and calculated F values larger than the F statistic values, according to
Table 3 -k2parameter of the Peleg generalized equation for the hydration of sorghum grains
* Average relative error
Figure 2 -Generalized model of Peleg (a) and Diffusion (b) for the moisture as a function of the hydration time of the sorghum grains of cultivar BRS 310 at different temperatures
Cultivar Model Parameter Equation R² (%) *P (%)
BRS 310 Peleg k1 1/k1 = 3.109.e(-5892/T) (9) 99.3 4.39
Difusão Def Deff = 2,90.e(-3754/T) (10) 99.2 2.87
BRS 655 Peleg k1 1/K1 = 1.105.e(-2758/T) (11) 96.1 5.10
Difusão Def Deff = 1,77.e(-1393/T) (12) 80.0 4.58
* Average relative error
Table 2 -Parameters of Peleg and Diffusion generalized models
Cultivar Parameter Equation R² (%) P (%)
BRS 310 k2 k2 = -2x10⁻⁴T + 5.45x10⁻² (13) 95.2 6.07
Figure 3- Generalized model of Peleg (a) and Diffusion (b) for moisture as a function of time during the hydration of sorghum grains of cultivar BRS 655 at different temperatures
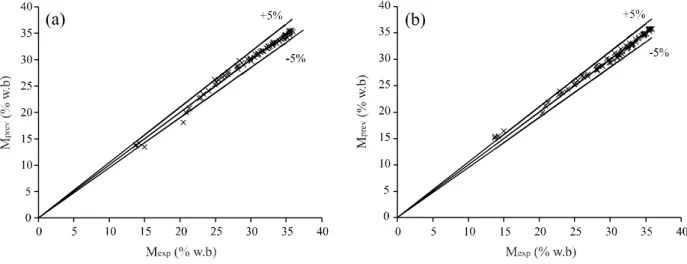
Figure 4- Comparison between experimental (Mexp) and predicted (Mprev) moisture values for the Peleg (a) and Diffusion (b) generalized models of BRS 310 with 5% deviation
ANOVA at the 95% and 99% significance level. The Peleg and Diffusion models were generalized successfully, with their parameters presenting mean relative error and root mean square error values lower than 3%. The Peleg model presented P values of 1.29% and 1.53% for cultivars BRS 310 and BRS 655, respectively, whereas for the Crank model, the P value was 1.70% for cultivar BRS 310 and 1.81% for cultivar BRS 655. Similarly, the Peleg model presented deviations from the root mean square error (2.14% for BRS 310 and 2.53% for BRS 655) slightly lower than the Diffusion model (2.8% for BRS 310 and 3.12% for BRS 655), but with very similar and excellent fits for both.
presented higher but very similar deviations and, because it is phenomenological, it has greater physical meaning. This model provide the effective diffusion coefficient, an important parameter for optimization of industrial processes and equipment projects, showing to be the most suitable to the hydration of grains in the cultivars presented.
Effective Diffusion Coefficient (Def) and Activation
Energy
Def is an important property used to optimize the
processes involving water transport inside the grains. Def
value is named apparent because it comprises all the factors involved in the process, besides being the representation of the water diffusivity by a simple average property (YILDIRIM; ÖNER; BAYRAM, 2011).
The effective diffusion coefficient of the BRS 310 sorghum grain increased during hydration with increasing temperature (Table 4), as observed in soybean
(GOWENet al., 2007), rice (KASHANINEJAD et al.,
2007) and chickpeas (PRASAD; VAIRAGAR; BERA, 2010). However, for the cultivar BRS 655 its value decreased from 40 ºC to 50 ºC, a temperature drop also reported by Thakur and Gupta (2006) in brown rice grains and Montanuci, Jorge and Jorge (2015) in barley.
The diffusion coefficients ranged from 2.017 x
10-11 to 6.342 x 10⁻¹¹ m2 s-1 for cultivar BRS 310 and from
2.755x10⁻¹¹ to 4.387 x 10⁻¹¹ m2 s-1for cultivar BRS 655.
Becker (1960) observed values of 3.63 x 10⁻¹¹ m2 s-1 in wheat
grains, Montanuci, Jorge and Jorge (2015) and Mayolleet al.
(2012) values between 5.14 x 10⁻¹² and 10.80 x 10⁻¹² m2 s-1 in
barley grains and Kashiri, Kashaninejad and Aghajani (2010)
* Effective diffusion coefficient
Table 4- Effective diffusion coefficient of the Diffusion model as a function of the hydration temperature of the sorghum grains
Cereal Variety Temperature (ºC) *Ea (kJ mol-1) Author
Sorghum ICSV 111 10-50 3.88 Badau, Nkama e Jideani (2005)
Sorghum - 10-50 24.21 Kashiri, Kashaninejad e Aghajani (2010)
Sorghum White Kafir 0-100 8.34 Fan, Chu e Shellenberger (1963)
Atlas 8.42
Wheat - 11.98 Maskan (2002)
Corn
DKB 245PRO
40-67
31.95
Marques, Jorge e Jorge (2014)
DKB 390PRO 31.96
DKB 240PRO 34.07
Barley BRS ELIS 10-35 51.67 Montanuci, Jorge e Jorge (2015)
Sorghum BRS 310 30-60 31.21 This work
BRS 655 11.52
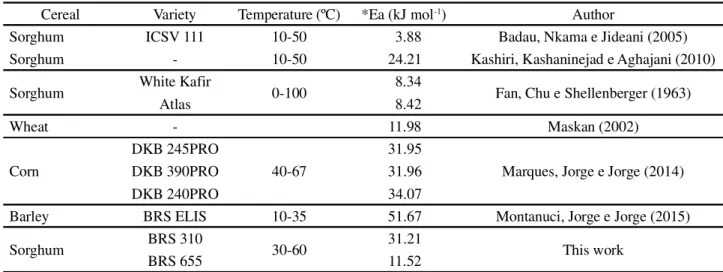
Table 5 - Activation energy of the hydration process of some cereals in different temperature ranges
* Activation Energy
values from 2.22 x 10⁻¹² to 8.32 x 10⁻¹² m2 s-1 in sorghum grains.
Close values show that cereals have similar effective
diffusion coefficients (KASHANINEJADet al., 2007).
The activation energy (Ea) of the grain hydration
was obtained from the relation between the Def and
the temperature by Arrhenius equation (Equation
6) (KASHANINEJAD et al., 2007; KHAZAEI;
MOHAMMADI, 2009; PRASAD; VAIRAGAR, (2006). The fit for this relationship was adequate, with a determination coefficient higher than 80% for both cultivars and P values lower than 5% (Table 2).
Typical Ea values observed in some researchs
are presented in Table 5 along with the results obtained
in this work. The estimated values of Ea for sorghum
grains studied were 31.21 kJ.mol-1 for cultivar BRS 310
Cultivar Temperature (ºC) *Def (10-11m2 s-1)
BRS 310
30 2.017 ± 0.008
40 3.098 ± 0.010
50 4.113 ± 0.015
60 6.342 ± 0.025
BRS 655
30 2.755 ± 0.012
40 3.907 ± 0.012
50 3.802 ± 0.015
and 11.52 kJ.mol-1 for cultivar BRS 655, which obtained
lower Ea, indicating its lower sensitivity to the temperature
change in the hydration process carried out between 30 °C and 60 °C.
Compared with other cereals (Table 5), the
estimated Ea of sorghum grains of cultivar BRS 655
presented a similar value in relation to wheat grains (MASKAN, 2002), while cultivar BRS 310 obtained
Ea value close to observed by Marques, Jorge and Jorge
(2014) in corn grains. Both cultivars showed lower
Ea values than those observed in grains of barley by
Montanuci, Jorge and Jorge (2015).
Sorghum grain showed activation energies close to that of cultivar BRS 655 (FAN; CHU; SHELLENBERGER, 1963). Badau, Nkama and Jideani
(2005) observed a lower value of Ea (3.88 kJmol-1), while
Kashiri, Kashaninejad and Aghajani (2010) found an Ea
of 24.21 kJ.mol-1 in hydration at temperatures ranging
from 10 °C to 50 °C in sorghum grain too.
It is clear that the differences between the activation energies of the hydration process are more expressive among the cultivars within the same species than among
the different cereals. Differences in Ea values may occur
due to variations in the chemical composition and grain structure between the cultivars (MONTANUCI; JORGE; JORGE, 2013).
CONCLUSIONS
1. Hydration time and temperature affect the moisture of the sorghum grains studied and a higher temperature decreased the time required to reach the desired moisture between 30 °C and 60 °C;
2. Empirical equations of Peleg and Phenomenological equations of Diffusion and Omoto-Jorge were validated to model the process, under the conditions and cultivars studied, by the F test, randomness of the residues and
high R2 value. The Omoto-Jorge model had never been
fitted before for the hydration of sorghum grains; 3. Peleg and Diffusion model obtained the best fits in
the moisture prediction of the sorghum grains during the hydration. In addition, they were generalized, with similar deviations to predict water absortion as a function of process time and temperature, each model with its advantages: Peleg model is simpler while Diffusion model has physical meaning and it is able to provide the diffusion coefficient of the process;
4. The effective diffusion coefficient increased from
2.02 m2s-1 to 6.34 m2s-1 in BRS 310 sorghum and
from 2.76 to 4.39 m2s-1 in BRS 655 sorghum with
the increase of hydration temperature from 30 °C to 60 °C;
5. The effective diffusion coefficients could be related to the temperature by Arrhenius equation. The activation
energy (Ea) of the hydration process was 11.52 kJ mol-1
for cultivar BRS 655 and 31.21 kJ mol-1 for cultivar
BRS 310;
6. In this work, it was verified that two sorghum cultivars with distinct characteristics and classifications were well represented during hydration by the Diffusion and Peleg models. This result shows that these two models are promising for the industrial process of hydration of other sorghum cultivars.
REFERENCES
ARENDT, E. K.; ZANNINI, E. Sorghum. In: ARENDT, E.
K.; ZANNINI, E. Cereal grains for the food and beverage industries. 1. ed. Cambridge: Woodhead Publishing, 2013. cap. 8. p. 283-305.
ASSOCIATION OF OFFICIAL ANALYTICAL CHEMISTS. Offical methods of analysis. Washington, 2012.
BADAU, M. H.; NKAMA, I.; JIDEANI, I. A. Water-absorption characteristics of various pearl millet cultivars and sorghum grown in Northen Nigeria.Journal of Food Process Engineering, v. 28, n. 3, p. 282-298, 2005.
BALBINOTI, T. C. V.; JORGE, L. M. M; JORGE, R. R. Modeling the hydration step of the rice (Oryza sativa) parboiling process. Journal of Food Engineering, v. 216, p. 81-89, 2018.
BECKER, H. A. On the absorption of liquid water by the wheat kernel.Cereal Chemistry, v. 37, p. 309-323, 1960.
CRANK, J. The mathematics of diffusion. 2. ed. London: Oxford University Press, 1975.
CUNHA, L. M.; OLIVEIRA, F. A. R.; OLIVEIRA, J. C. Optimal experimental design for estimating the kinetic parameters of processes described by the Weibull probability distribution function.Journal of Food Engineering, v. 37, n. 2, p. 175-191, 1998.
FAN, L.-T.; CHU, P.-S.; SHELLENBERGER, J. A. Diffusion of water in kernels of corn and sorghum.Cereal Chemistry, v. 40, n. 4, p. 303-313, 1963.
FOOD AND AGRICULTURE ORGANIZATION OF THE UNITED NATIONS. Statistics Division. Disponível em: <http:// faostat3.fao.org/browse/Q/QC/E>. Acesso em: 10 mar. 2015. GOWEN, A. et al. Influence of pre-blanching on the
water absorption kinetics of soybeans. Journal of Food Engineering, v. 78, n. 3, p. 965-971, 2007.
KASHANINEJAD, M. et al. Study of hydration kinetics and
processing.Journal of Food Engineering, v. 79, n. 4, p. 1383-1390, 2007.
KASHANINEJAD, M.; DEHGHANI, A. A.; KASHIRI, M. Modeling of wheat soaking using two artificial neural networks (MLP and RBF).Journal of Food Engineering, v. 91, n. 4, p. 602-607, 2009.
KASHIRI, M.; GARMAKHANY, A. D.; DEHGHANI, A. A. Modelling of sorghum soaking using artificial neural networks (MLP).Quality Assurance and Safety of Crops & Foods, v. 4, n. 4, p. 179-184, 2012.
KASHIRI, M.; KASHANINEJAD, M.; AGHAJANI, N. Modeling water absorption of sorghum during soaking. Latin American Applied Research, v. 40, n. 4, p. 383-388, 2010.
KHAZAEI, J.; MOHAMMADI, N. Effect of temperature on hydration kinectics of sesame seeds (Sesamum indicum L.).
Journal of Food Engineering, v. 91, n. 4, p. 542-552, 2009. LOMAURO, C. J.; BAKSHI, A. S.; LABUZA, T. P. Evaluation of food moisture sorption isotherm equations: Part I: Fruit, vegetable and meat products. LWT - Food Science and Technology, v. 18, n. 2, p. 111-117, 1985.
MAIORANO, A.; MANCINI, M. C.; REYNERI, A. Water interactions in maize grain during maturation: differences among commercial hybrids.Maydica, v. 55, n. 3/4, p. 209-217, 2010.
MARQUES, B. C.; JORGE, L. M. M.; JORGE, R. M. M. Hydration kinetics, physicochemical composition, and textural changes of transgenic corn kernels of flint, semi-flint, and dent varieties.Food Science and Tchenology, v. 34, n. 1, 2014. MASKAN, M. Effect of processing on hydration kinetics of three wheat products of the same variety. Journal of Food Engineering, v. 52, n. 4, p. 337-341, 2002.
MAYOLLE J. E.et al. Water diffusion and enzyme activities
during malting of barley grains: a relationship assessment. Journal of Food Engineering, v. 109, n. 3, p. 358-365, 2012.
MIANO, A. C. et al. Correlating the properties of different
carioca bean cultivars (Phaseolus vulgaris) with their hydration
kinetics. Food Research International, v. 107, p. 182-194, 2018.
MONTANUCI, F. D.; JORGE, L. M. de M.; JORGE, R. M. M. Kinetic , thermodynamic properties , and optimization of barley hydration.Food Science and Technology, v. 33, n. 4, p. 690-698, 2013.
MONTANUCI, F. D.; JORGE, L. M. M.; JORGE, R. M. M. Effect of time and temperature on the hydration process of barley grains.Heat and Mass Transfer, v. 51, n. 3, p. 363-372, 2015.
OLI, P. et al. Parboiled rice: understanding from a materials science approach.Journal of Food Engineering, v. 124, p. 173-183, 2014.
OMOTO, E. S.; ANDRADE, C. M. G.; JORGE, R. M. M.. Modelagem matemática e análise da hidratação de grãos de ervilha.Ciência e Tecnologia de Alimentos, v. 29, n. 1, p. 12-18, 2009.
PATERO, T.; AUGUSTO, P. E. D. Ultrasound (US) enhances the hydration of sorghum (Sorghum bicolor) grains.Ultrasonics Sonochemistry, v. 23, p. 11-15, 2015.
PELEG, M. An empirical model for the description of moisture sorption curves.Journal of Food Science, v. 53, n. 4, p. 1216-1219, 1988.
PRASAD, K.; VAIRAGAR, P. R.; BERA, M. B. Temperature dependent hydration kinetics of Cicer arietinum splits. Food Research International, v. 43, n. 2, p. 483-488, 2010.
RESENDE, O.; CORRÊA, P. C. Modelagem matemática do processo de hidratação de sementes de feijão.Acta Scientiarum Agronomy, v. 29, n. 3, p. 373-378, 2007.
THAKUR, A. K.; GUPTA, A. K. Water absorption characteristics of paddy, brown rice and husk during soaking.Journal of Food Engineering, v. 75, n. 2, p. 252-257, 2006.
YILDIRIM, A.; ÖNER, M. D.; BAYRAM, M. Fitting Fick’s model to analyze water diffusion into chickpeas during soaking with ultrasound treatment.Journal of Food Engineering, v. 104, n. 1, p. 134-142, 2011.