Pathways of adult student-workers in higher education: explaining the
risks of early dropout, late dropout and graduation
Pedro Carreira
aAna Sofia Lopes
a aSchool of Technology and Management, CIGS (Management for Sustainability Research Centre), Leiria Polytechnic Institute
Correspondence details:
[email protected] and [email protected]
Campus 2, Morro do Lena - Alto do Vieiro, 2411 - 901 Leiria - Portugal, Tel. +351 244 820 300
Abstract
In Portugal, student-workers represent 8.5% of higher education students. They are mainly adults with a less favourable socioeconomic and professional background that return to school while working and after experiencing some years in the labour market so as to find a new profession or a job promotion. However, due to their particular characteristics and time restrictions, adult student-workers observe high dropout rates, justifying the need of identifying their determinants of dropout and graduation risks in a separate way. With this purpose, we match five sources to obtain a unique five-year longitudinal dataset with extensive information on individual, degree and employment variables of 976 student-workers from Leiria Polytechnic Institute, Portugal. We then use event history analysis, with competing risks, to investigate if and when the event of dropping out or graduation occurs and how a set of covariates affects the risk of each event. In addition, we distinguish between those that drop out with few accumulated credits (labelled as early dropouts) and those that drop out despite having a significant number of credits completed (late dropouts). We found that early dropouts depend more on academic failure, school-residence distance, personal motivation and employment variables, while late dropouts are more influenced by other factors such as marital status and degree characteristics.
Among policy recommendations, beyond the frequently referred actions to reduce academic failure, we highlight the adoption of measures to avoid stopout behaviour, the adequate definition of the schedule and composition of classes (daytime classes and higher proportions of student-workers in the classroom, and with distinct academic performance, seem to reduce dropout risk), and the curriculum appreciation at the admission moment (some employment variables seem to contribute to increase the probability of graduation while others seem to contribute to enhance the risk of dropout), including criteria for regional preference and personal motivation.
JEL Codes: I23, I21, C21
Keywords: adult education, higher education, event history analysis, competing risks, dropout risk, early
1
1. Introduction
The skills acquired during graduation in higher education are reflected in higher labour productivities, increasing the competitiveness of firms and allowing higher wages (as it is claimed by human capital theory pioneered by Becker, 1962). For example, in Portugal, and according to OECD (2016), the average wage of a full-time worker with higher education is 68% higher than the average wage of a worker with the upper secondary level. Moreover, graduated individuals have a lower risk of unemployment, a higher chance of being successful entrepreneurs and a higher self-fulfilment perception.
Despite its importance, higher education may contribute to increase socioeconomic inequalities, as students with a more favourable socioeconomic background are more likely to enrol. Indeed, while 29.2% of the parents of higher education students in Portugal detained the higher education level themselves in 2010 (Costa & Duarte, 2012), the percentage of population between 40 and 64 years-old with a higher education diploma was only of 10.2% in that year (Portuguese population census of 2011). Adult education can however weaken this effect and play an important role in social mobility, as it allows people coming from disadvantageous backgrounds to have a new opportunity to enrol in higher education. For example, in the case of undergraduate student-workers of Leiria Polytechnic Institute (IPLeiria) in 2009/10, 56% of their parents have at most four years of schooling, whereas this percentage is only of 19% for non-worker students.
In order for adult education to reduce socioeconomic inequalities and contribute to social mobility in an effective way, it is necessary not only to promote the participation of adult workers in higher education but also to create conditions for them to be able to complete their degree. In one hand, policy makers often encourage non-traditional students to enrol in higher education, “partly because of the emphasis on lifelong learning, but on the other hand they do not seem to be concerned about understanding their needs and circumstances, thereby maintaining an institutional system designed for a very different type of student” (Gilardi & Guglielmetti, 2011). This paradoxical situation justifies the need of having studies focusing on understanding the factors that explain the probabilities of graduation, dropout and persistence of adult student-workers and on providing policy indications aimed to reduce their dropout rate and increase their graduation chances, without reducing participation.
Dropout behaviour has been intensively studied over the last decades (Tinto, 1975, 1988, 1993; Bean, 1980; Murtaugh, Burns & Schuster, 1999; DesJardins, Ahlburg & McCall, 1999; Johnes & McNabb, 2004; Stratton, O’Toole, & Wetzel, 2008; Arias Ortiz & Dehon, 2013). However, the literature focus essentially on traditional (young and non-worker) students even though dropout rates are observed to be higher for non-traditional students, particularly for adult student-workers. These students are indeed very distinct from traditional students. In one hand,
2
they are employed and older, parents and married more often, which imposes higher professional duties and household responsibilities, thus reducing the time available for school. On the other hand, they are likely to have more established soft skills, such as communication or time management skills for example, derived from their professional and life experience. In addition, the motivations for adult student-workers to enrol in higher education are very heterogeneous, varying from simple self-satisfaction to goals related with progression within their current professional career or with pursuing a new (more rewarding) career. Therefore, the typical determinants of dropout and graduation risks may have particular effects or magnitudes for adult student-workers that do not fit in the pattern of traditional students, making the structural stability of pooled models (i.e. that include all students, traditional and non-traditional) a remote possibility and justifying adult student-workers to receive a separate treatment. This constitutes the main goal of our paper.
In order to determine the factors that drive the graduation and dropout risks of adult student-workers in higher education, we use duration analysis (or event history analysis), with three competing risks. Beyond the event of graduation, we distinguish between dropouts that occur when the student has completed less than 34 credits (i.e. when he/she is still formally a 1st year
student in terms of the curricular structure of the degree), labelled as early dropouts, and dropouts that occur when the student has completed 34 or more credits (i.e when he/she is formally a 2nd
or 3rd year student), labelled as late dropouts. This allows to investigate if, for adult
student-workers, the factors that explain late dropouts are different than those explaining early dropouts, which is an additional research question of the present paper.
On the explanatory variables, in accordance to the majority of the literature, we consider individual variables such as gender, marital status, nationality, scholarship, part-time studying, socioeconomic background, geographical proximity between residence and school and admission regime. Additionally, we control for degree variables such as the field of study of the degree, the average and dispersion of final GPA within the degree, the average and dispersion of students’ age within the degree, and the proportion of student-workers within the degree, among others. Finally, we also account for specific employment variables that are new to the literature, namely if the student exercises a qualified or unqualified job, if the professional activity is being developed as an employer (self-employment) or as an employee, the relation between the field of study and the professional activity, and the legal size (micro, small, medium or large organization) and business sector of the employer. This will allow to extend knowledge on the factors that affect the risks of graduation and dropout in higher education for the case of adult student-workers, and thus to help central education authorities and higher education institutions identifying ways to improve the academic achievement of these students.
3
The structure of the paper is as follows. In section 2, we describe the construction of the dataset and its variables and analyse some summarizing descriptive statistics. In section 3, we present the modelling strategy. The results are then exhibited and discussed in section 4 and, finally, the main conclusions and policy implications are drawn in section 5.
2. Data and descriptive statistics
This study uses longitudinal data on the 976 individuals that enrolled, as student-workers, in an undergraduate degree of IPLeiria, in the academic year of 2008/09 or 2009/10, under the National Access Regime for Higher Education (CNAES - Concurso Nacional de Acesso ao
Ensino Superior) or under the M23 admission regime (that does not require completion of
secondary school and is exclusive for students over 23 years old), representing around 3.4% of all student-workers that enrolled in undergraduate degrees in Portugal those years.1 We follow
these students over nine and eight years, respectively, i.e. until the academic year of 2016/17, allowing us to observe if and when a certain student-worker was able to achieve graduation, if and when he/she interrupted the studies, either only for some years (stopout behaviour) or in a permanent basis (dropout - early or late), or if he/she is still persisting, which resulted in an initial dataset with a total of 3010 person-period observations.
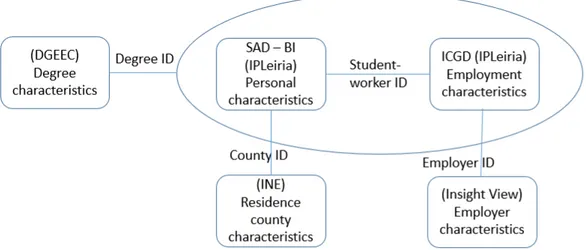
The database was built by crossing data from several sources and by adding some constructed variables (Figure 1). First, as students are traceable by an identification number, we joined in a single database the nine annual databases (2008/09 to 2016/17) of Sistemas de Apoio
à Decisão - Business Intelligence (SAD-BI), from IPLeiria, mainly containing individual personal
and background information. Second, again using a common identification number, we match the database with Inquérito Caixa Geral de Depósitos (ICGD), which provides information on employment variables. Third, as the employer’s name is identified in ICGD database, we used the Iberinform Insight View online platform to extract information on the legal size (or dimension) and business sector of the employer organizations. Next, it was added longitudinal information at the degree level from the databases of DGEEC – Direção-Geral de Estatística da Educação e
Ciência (Ministry of Education and Science, Portugal). Finally, socioeconomic information of the
residence county of students was obtained through Instituto Nacional de Estatística (INE). The database was reorganised afterwards “to construct a person-period dataset which includes a record for each time period in which the individual is at risk” of an event (DesJardins
et al., 1999), i.e. for each year of enrolment, so that event history analysis tools can be applied.
1 “Entry cohort is used, instead of the leaving cohort, in order to standardize for time-varying influences”
4
The description of the variables included in the final data set is given in the Appendix - Table A.1.
Figure 1. Database composition
A specific difficulty that is present in all studies that investigate student attrition is the definition of dropout, particularly the distinction between students interrupting their studies permanently (the ideal definition of dropout) and students who are only interrupting for a few years (stopouts). As the observation period is finite, the ideal definition of dropout is not implementable, making most studies to consider dropouts as the cases when students interrupt their studies without returning to school within a certain time period (usually of two years or more). In our case, we consider dropout students to be the ones that interrupted their studies before achieving graduation and have not returned to IPLeiria within the observation period, with the interruption period being of at least three academic years. As for the students that are observed for eight years dropouts can occur only in the first five, we restrict our database to its first five years, ending up with a total of 2806 person-period observations and assuring that all events of interest are observed in any time period in an unbiased way. According to Heublein (2014), the timing must be chosen “in such a way that” in the last year “the share of students that are still in higher education is not greater than 20%” of the initial students in the dataset, which is verified in our case, as year 5 contains less than 15% of the initial individuals. Under this restriction, all students that do not observe any event in the first five years constitute censored observations.
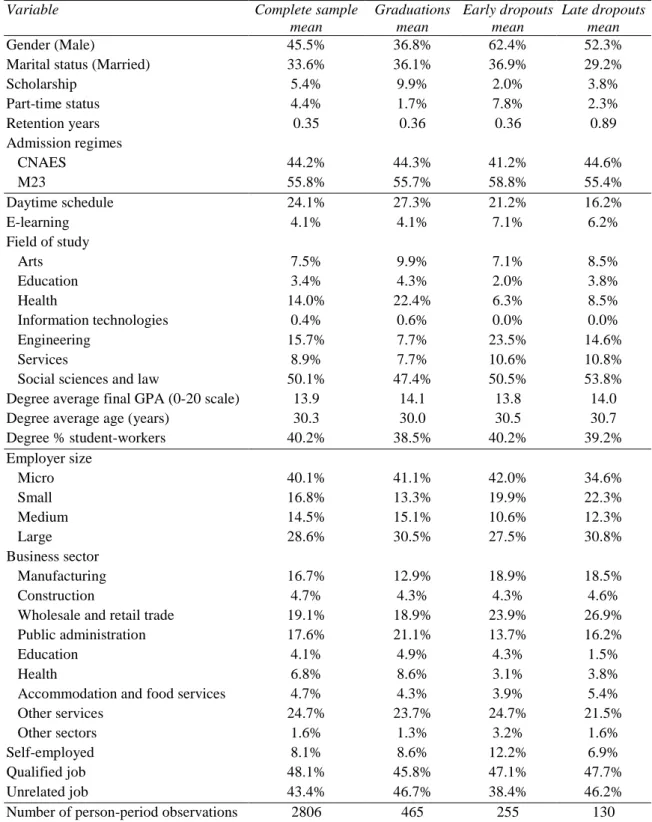
The summary statistics (means) of selected variables within the dataset are presented in Table 1. The statistics are computed considering the complete sample of person-period observations (column 1) and the restricted subsamples of person-period observations in which each of the events of graduation (column 2), early dropout (column 3) and late dropout (column 4) occurs.
5
Table 1. Summary statistics Variable Complete sample
mean Graduations mean Early dropouts mean Late dropouts mean Gender (Male) 45.5% 36.8% 62.4% 52.3%
Marital status (Married) 33.6% 36.1% 36.9% 29.2%
Scholarship 5.4% 9.9% 2.0% 3.8% Part-time status 4.4% 1.7% 7.8% 2.3% Retention years 0.35 0.36 0.36 0.89 Admission regimes CNAES 44.2% 44.3% 41.2% 44.6% M23 55.8% 55.7% 58.8% 55.4% Daytime schedule 24.1% 27.3% 21.2% 16.2% E-learning 4.1% 4.1% 7.1% 6.2% Field of study Arts 7.5% 9.9% 7.1% 8.5% Education 3.4% 4.3% 2.0% 3.8% Health 14.0% 22.4% 6.3% 8.5% Information technologies 0.4% 0.6% 0.0% 0.0% Engineering 15.7% 7.7% 23.5% 14.6% Services 8.9% 7.7% 10.6% 10.8%
Social sciences and law 50.1% 47.4% 50.5% 53.8%
Degree average final GPA (0-20 scale) 13.9 14.1 13.8 14.0
Degree average age (years) 30.3 30.0 30.5 30.7
Degree % student-workers 40.2% 38.5% 40.2% 39.2% Employer size Micro 40.1% 41.1% 42.0% 34.6% Small 16.8% 13.3% 19.9% 22.3% Medium 14.5% 15.1% 10.6% 12.3% Large 28.6% 30.5% 27.5% 30.8% Business sector Manufacturing 16.7% 12.9% 18.9% 18.5% Construction 4.7% 4.3% 4.3% 4.6%
Wholesale and retail trade 19.1% 18.9% 23.9% 26.9%
Public administration 17.6% 21.1% 13.7% 16.2%
Education 4.1% 4.9% 4.3% 1.5%
Health 6.8% 8.6% 3.1% 3.8%
Accommodation and food services 4.7% 4.3% 3.9% 5.4%
Other services 24.7% 23.7% 24.7% 21.5%
Other sectors 1.6% 1.3% 3.2% 1.6%
Self-employed 8.1% 8.6% 12.2% 6.9%
Qualified job 48.1% 45.8% 47.1% 47.7%
Unrelated job 43.4% 46.7% 38.4% 46.2%
Number of person-period observations 2806 465 255 130
It can be observed that 45.5% of the observations in the complete sample correspond to male students and that the percentage rises to 62.4% and 52.3% if only early and late dropout observations are considered, respectively, indicating that dropout behaviour is more frequent among males, particularly early dropouts. Also, 33.6% of the observations are from married students, who have a higher relative presence in the graduations and early dropouts subsamples,
6
and a lower relative presence in the late dropouts subsample. Moreover, financial support through scholarships seems related to high graduation rates and low dropout rates. On the contrary, the part-time status seems to be related with low graduation and high early dropout rates, while retention is naturally associated with higher dropout rates.
Although the main admission regime in Portugal, for the traditional students, is CNAES, the M23 admission regime is the most frequent among student-workers at IPLeiria. As displayed in Table 1, 55.8% of the observations in the sample are from students that enrolled under the M23 admission regime and 44.2% from students that enrolled under the CNAES regime. Comparing the four columns, it is possible to observe that the proportion of M23 observations increases when we restrict to the early dropouts subsample, meaning that the M23 admission regime may be associated with higher early dropout rates than CNAES. Note however that the admission regime seems not to have a relevant impact with respect to the chances of graduation and to the risk of late dropout.
In Portugal, and at IPLeiria in particular, undergraduate degrees can operate under a daytime schedule (i.e. classes occurring between 8 am and 8 pm) or under a post-work schedule (classes between 6 pm and 12 pm). In addition, they can also operate on an e-learning environment (in which there are no traditional classroom lectures). Table 1 suggests that graduation rates are higher and dropout rates are lower for students enrolled in daytime schedule degrees than for students that enrol in post-work or e-learning degrees. Indeed, enrolling in a daytime degree is often a signal of higher time flexibility of the professional agenda and/or of greater availability.
On employment variables, 8.1% of the observations in the sample are from self-employed students, with the proportion increasing to 12.2% if only early dropout observations are considered, and 48.1% of students exercise qualified jobs. It is also possible to observe differences between the three subsamples concerning the distribution of students by business sector in which they are employed. Students employed in the public administration, education and health sectors show higher graduation rates and lower dropout rates. On the contrary, students employed in the manufacturing and trade business sectors exhibit lower graduation rates and higher dropout rates. With respect to the employer legal size, there are more students employed in large or micro organizations, which can be explained by the facts that there is a huge majority of micro firms in Portugal and that the small number of large firms in Portugal are really big employers. In an overall analysis, it seems that the larger the organization they work, the better the academic performance of the students, as the proportion of medium and large organizations increase in the graduations subsample and decrease in the early dropouts subsample, and the proportion of small and micro organizations increase in the early dropouts subsample, as compared to the complete sample.
7
The variable unrelated job is a dummy constructed by the authors. Its value is 1 for the students whose job has no relation at all with the scientific field of the degree they are enrolled, and 0 otherwise, i.e., if there is some relation between the job and the field of study. For example, a student enrolled in a marketing degree working as an electrician got a value of 1, while a student in the same degree but exercising commercial functions got a value of 0. One observes that the percentage of students with unrelated jobs is higher in the graduations subsample (46.7%) than in the complete sample (43.4%). In addition, studying in a degree unrelated with the profession seems to decrease the early dropout rate.
3. Modelling
In this section, we describe the modelling strategy so as to explore the determinants of dropout and graduation probabilities. With this respect, we follow Scott & Kennedy (2005) and Arias Ortiz & Dehon (2013), and use event history analysis, also known as duration analysis or survival analysis, with competing risks, in the discrete-time setting.
The benefits of event history analysis, which models when the events occur, as opposed to most traditional methods that model only whether the events occur, are well documented in Willett & Singer (1991). First, it allows the risk of each event to vary across time, which is very likely to occur in the case of graduation and dropout as, for example, the risk of early dropout is higher in the first year than in subsequent years (given that the cost of dropping out for the individual increases with time), while the risk of graduation is naturally higher in periods near the normal duration of the degrees. Second, it is possible to analyse both the effects of time-varying covariates and time-constant covariates whose effect on the probability of each event can vary with time. Third, all individuals are jointly considered, without need to separate the individuals who experienced a particular event from the rest of the individuals, such as in two-sample comparisons for example, thus avoiding the definition of subjective cut-off points to separate the individuals. Finally, it allows to include and analyse censored data (individuals that observe no event during the time period in observation) in addition to the individuals who observe an event. DesJardins et al. (1999) and Murtaugh et al. (1999) were among the first to apply event history analysis to study dropouts and/or graduations. However, they considered a single risk framework, which has the caveat of ignoring that dropout and graduation are correlated, as they compete to be the outcome for each individual. For example, a graduated individual is no longer at risk of dropping out as well as an individual that drops out from school is no longer at risk of graduating. Hence, the risks of graduation and of dropping out are interdependent and have to be jointly estimated under a competing risks approach, as concluded by DesJardins, Ahlburg & McCall (2002), who showed that when there are interdependencies between graduations and dropout, single-risk models may be inappropriate and lead to spurious conclusions.
8
We consider a discrete-time setting as it may be more appropriate for our data, as it is clustered either at the begining or at the end of each lective year. This is usually the case for educational data, as the precise time of ocurrence is in general unknown and the information tend to be clustered at the end of years, semesters or quarters. Using continuous-time models, like Cox regression, would be problematic if the probability of two observations sharing the same event time is not small enough (Arias Ortiz & Dehon, 2013; Scott & Kennedy, 2005; Singer & Willett, 1993; Singer & Willett, 2003), thus making discrete-time settings preferable. Moreover, Scott & Kennedy (2005) show that an event history analysis model that combines competing risks with discrete-time can be estimated using a multinomial logistic regression, which makes the considered approach more accessible.
We thus propose the following hazard model for individual i (i=1,…,976) of event k (k=1,2,3, with 1 standing for graduations, 2 for early dropouts and 3 for late dropouts) at year t (t=1,…,5):
ℎ , = ∑ ⋯
! ⋯ ! " ! ! ! "#
$
!% , (1)
where Xit, Zit and Wit are the vectors of individual, degree and employment covariates,
respectively (including both constant and time-varying variables), βj, γj and δj are the vectors of
parameters associated with the covariates and the outcome j, and Di1,…,Di5 are time period
dummy variables identifying each year (Di1=1 if the observation for individual i comes from the
first year of enrollment, and Di1 = 0 if the observation comes from any subsequent year of
enrollment). The intercept parameters αk1,…,αk5 capture the baseline level of hazard (the hazard
probabilities when the value of all covariates is zero) in each year. The vectors of parameters βk,
γk and δk measure the effects of the covariates on the baseline hazard function, on a logit scale.
Taking logistic transformations on both sides of Equation 1, we get:
log )* +,,* -,, . = /+ 0 + ⋯ + /+202 + 3 45 + 6 75 + 8 95 ", (2)
where hi(0,t) is the hazard of the non-event defined as 1 − ∑=>? ℎ <, . Is it now visible that the
covariates are linearly related with the logistic transformation of the hazard ratio and not directly with the hazard probabilities. Note that the ratio ℎ , /ℎ 0, , usually referred as the outcome-specific hazard ratio, measures the risk of experiencing event k relatively to the risk of observing no event (the reference category in our multinomial logit model).
On the specific explanatory variables included in the model, the vector of individual covariates Xit contains the following variables: gender (male), marital status (married male and
married female), nationality (foreign), scholarship, school-residence distance, residence county schooling level, residence county purchasing power, first call admission, first option, admission regime (CNAES; M23 is the baseline regime for comparison), part-time status, retention years
9
and stopout. The vector of degree covariates Zit includes the variables: daytime schedule,
e-learning, field of study (arts, education, health, information technologies, engineering, services; social sciences and law is the baseline field of study), degree total number of students, degree average final GPA, degree final GPA standard deviation, degree average age, degree age standard deviation, and degree percentages of student-workers, same gender, part-time, scholarship and foreign students. Finally, the vector of employment variables Wit includes the size of the employer
organization (micro, medium, large; small is the baseline) and its business sector (manufacturing, construction, wholesale and retail trade, public administration, education, health, other services, accommodation and food services; other sector is the baseline), self-employment (male and female), qualified job (male and female) and unrelated job (male and female).
4. Results
In this section, we present and discuss the results obtained after applying the methodology described above. We analyse first the hazard functions and the output of the multinomial logit model estimation afterwards.
4.1 Hazard functions
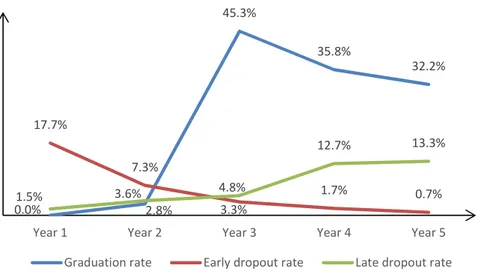
In Figure 2, we display the hazard functions in order to visualise the evolution of the risk of each event (graduation, early dropout or late dropout) over time. The hazard or risk of a certain event occurring in time t is the probability that the event occurs in time t conditional that the non-event has happened in each period before t. We thus compute, for each year, the proportion of students that observed each event among the students still persisting. For example, in year 1, with all the 976 initial student-workers at risk, 0 students achieved graduation, 173 dropped out with less than 34 completed credits, 15 dropped out even though they completed 34 or more credits, implying hazards of 0%, 17.7% and 1.5%, respectively, and 37 chose to enrol in a different undergraduate program at IPLeiria under an admission regime other than CNAES or M23, which we treated as censored observations. In year 2, there are thus 751 students at risk, which are the initial students that did not graduate nor dropped out in year 1, and that didn’t become censored observations. The hazards for year 2 are determined considering this new set of individuals.
Expectedly, the early dropout rate is decreasing with time and the late dropout rate is increasing with time. The proportion of late dropouts becomes higher than the proportion of early dropouts in year 3.
10
Figure 2. Dropout and graduation hazard functions
The graduation hazard function observes a peak in the third year of enrolment, which is in line with the normal duration of a degree and is a signal of academic success of student-workers. That the graduation hazard is not zero in year 2 comes from the fact that some credits may be loaded to the students at the enrolment moment due to previous formation.
4.2 Multinomial logit model
The multinomial logit model described in the previous section was estimated under maximum likelihood using Stata and Gretl. The fitted model predicts correctly 75.8% of the true events/outcomes over the 2806 observations considered in the regression, corresponding to a statistically significant McFadden R2 of 39.7% (log-likelihood ratio = 1789.02, p-value = 0.0000).
The results are presented in Tables 2, 3 and 4. Table 2 displays the estimated coefficients and the level of significance of time and individual covariates, while Tables 3 and 4 stand for the effects of degree and employment variables, respectively. Each estimated coefficient is to be interpreted as follows: when its associated covariate increases by one unit (while holding everything else constant), the outcome-specific hazard ratio is multiplied by the exponential of the coefficient (Arias Ortiz & Dehon, 2013).
Time dummies
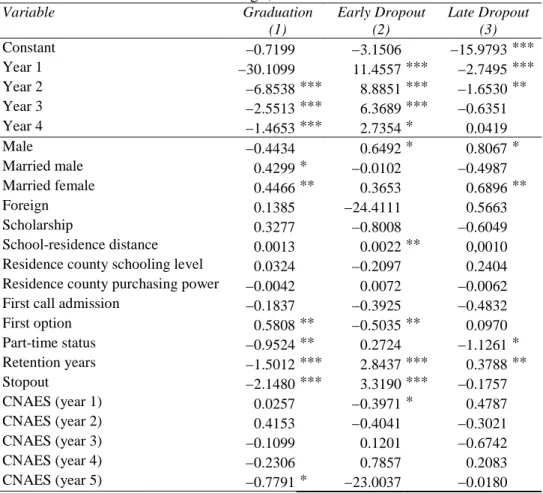
By estimating a model were the residual category is the fifth year of enrolment, we observe that all year coefficients are negative and statistically significant for the risk of graduation (except for year 1, as it has no observed graduations), reflecting that, when controlling for all covariates, the probability of graduation increases systematically with enrolment time until year 5. In coherence with the hazard functions, when controlling for all covariates, the probability of
0.0% 2.8% 45.3% 35.8% 32.2% 17.7% 7.3% 3.3% 1.7% 0.7% 1.5% 3.6% 4.8% 12.7% 13.3%
Year 1 Year 2 Year 3 Year 4 Year 5
11
dropping out early is decreasing with the number of enrolment years and significantly higher in any of the years 1 to 4 relatively to year 5, and the probability of dropping out late is increasing with the number of enrolment years until year 4, and significantly lower in years 1 and 2 than in year 5.
Table 2. Effects of time/individual variables Multinomial Logit, 2806 observations
Variable Graduation (1) Early Dropout (2) Late Dropout (3) Constant −0.7199 −3.1506 −15.9793 *** Year 1 −30.1099 11.4557 *** −2.7495 *** Year 2 −6.8538 *** 8.8851 *** −1.6530 ** Year 3 −2.5513 *** 6.3689 *** −0.6351 Year 4 −1.4653 *** 2.7354 * 0.0419 Male −0.4434 0.6492 * 0.8067 * Married male 0.4299 * −0.0102 −0.4987 Married female 0.4466 ** 0.3653 0.6896 ** Foreign 0.1385 −24.4111 0.5663 Scholarship 0.3277 −0.8008 −0.6049 School-residence distance 0.0013 0.0022 ** 0,0010 Residence county schooling level 0.0324 −0.2097 0.2404 Residence county purchasing power −0.0042 0.0072 −0.0062 First call admission −0.1837 −0.3925 −0.4832
First option 0.5808 ** −0.5035 ** 0.0970 Part-time status −0.9524 ** 0.2724 −1.1261 * Retention years −1.5012 *** 2.8437 *** 0.3788 ** Stopout −2.1480 *** 3.3190 *** −0.1757 CNAES (year 1) 0.0257 −0.3971 * 0.4787 CNAES (year 2) 0.4153 −0.4041 −0.3021 CNAES (year 3) −0.1099 0.1201 −0.6742 CNAES (year 4) −0.2306 0.7857 0.2083 CNAES (year 5) −0.7791 * −23.0037 −0.0180
*p-value<0.1, **p-value<0.05, ***p-value<0.01
Individual characteristics
On individual characteristics, we observe that female student-workers have a lower probability of dropping out than males and that marriage seems to increase graduation prospects. However, for women, marriage also increases the risk of dropping out with 34 or more credits, which can be associated with maternity and high household responsibilities. Also, living far from school increases the probability of early dropout. This may be explained by their higher time and financial costs, as compared to students that live closer to school. Moreover, none of the variables that describe the socioeconomic context of the student at the residence county level were found to be influent for the probability of either concluding the degree or dropping out.
When controlling for the other covariates, the attribution of scholarships is found not to have an impact on the academic achievement of student-workers. Similar results are found with respect to the variables first call admission and nationality (foreign).
12
The graduation chances are higher and the early dropout risk is lower when students enrol in their most preferred degree (first option), which is naturally associated with a higher personal motivation for the degree.
Students with more retention and/or stopout years have a lower graduation hazard and a higher early dropout hazard. Expectedly, the lack of academic progression may either postpone an eventual graduation to the outside the observation period or lead to a permanent interruption due to decreased motivation. Late dropouts seem to be less affected by academic performance, though. Indeed, retention contributes less intensively to increase late dropout risk than to increase early dropout risk and the estimated coefficient for the influence of the stopout variable on the late dropout hazard ratio is not statistically significant.
Part-time status may have a mixed impact on the academic achievement of adult student-workers. In one hand, it seems to contribute to decrease the risk of late dropout, but in the other hand it also decreases the probability of graduation. Being a policy instrument essentially devoted to increase participation and decrease dropout rates, its benefits seem to be questionable.
A variable subject to particular attention by policy makers is the admission regime. In order to study the effects of the admission regimes over time, the CNAES variable was included in the model considering its interactions with time. The main result is that CNAES student-workers have a lower early dropout risk in year 1 than the baseline M23 students. However, one also observes that the admission regime seems to be relevant for the risk of dropping out only in the first year of enrolment, as its effect vanishes afterwards. This means that, after being integrated, CNAES and M23 students perform similarly.
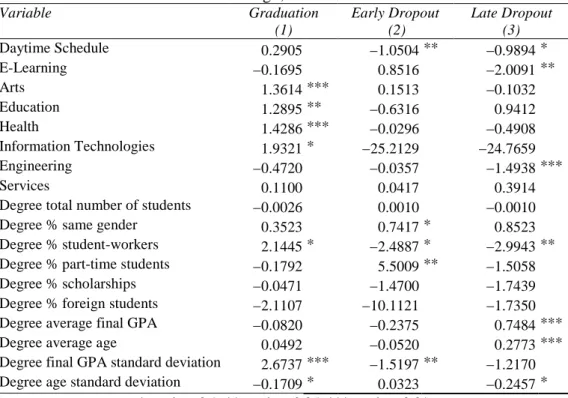
Degree characteristics
Table 3 exhibits the results for the degree variables. First, student-workers enrolled in degrees with a daytime schedule observe a lower risk of dropping out than those attending classes in a post-work time schedule, which may reflect, as previously referred, their greater availability for school and/or a higher time flexibility of their professional agenda. Enrolling in an e-learning degree may also imply a lower late dropout risk than enrolling in a degree with post-work classes, even though there is some evidence (not statistically significant) that it may increase the risk of an early dropout.
Second, on the field of study, students enrolled in arts, health, education and information technologies seem to have higher chances of graduating than students enrolled in the baseline field of study (social sciences and law), while engineering students appear less likely to drop out late.
Third, enrolling in degrees with higher proportions of student-workers seems to increase the probability of graduation and decrease the probability of dropping out, which reflects the
13
importance of academic integration. Moreover, degrees with higher proportions of part-time students and students of the same gender are more prone to early dropouts. In addition, degrees with higher average final GPA and with higher average age of the students seem to be more susceptible to late dropouts, while a higher dispersion of final GPA within the degree (i.e. higher heterogeneity between the academic performance of the students) increases the chances of graduation and decreases the risk of early dropout, and a higher dispersion of age decreases the chances of graduation and the risk of late dropout.
Table 3. Effects of degree variables Multinomial Logit, 2806 observations
Variable Graduation (1) Early Dropout (2) Late Dropout (3) Daytime Schedule 0.2905 −1.0504 ** −0.9894 * E-Learning −0.1695 0.8516 −2.0091 ** Arts 1.3614 *** 0.1513 −0.1032 Education 1.2895 ** −0.6316 0.9412 Health 1.4286 *** −0.0296 −0.4908 Information Technologies 1.9321 * −25.2129 −24.7659 Engineering −0.4720 −0.0357 −1.4938 *** Services 0.1100 0.0417 0.3914
Degree total number of students −0.0026 0.0010 −0.0010
Degree % same gender 0.3523 0.7417 * 0.8523
Degree % student-workers 2.1445 * −2.4887 * −2.9943 ** Degree % part-time students −0.1792 5.5009 ** −1.5058 Degree % scholarships −0.0471 −1.4700 −1.7439 Degree % foreign students −2.1107 −10.1121 −1.7350 Degree average final GPA −0.0820 −0.2375 0.7484 ***
Degree average age 0.0492 −0.0520 0.2773 ***
Degree final GPA standard deviation 2.6737 *** −1.5197 ** −1.2170 Degree age standard deviation −0.1709 * 0.0323 −0.2457 *
*p-value<0.1, **p-value<0.05, ***p-value<0.01
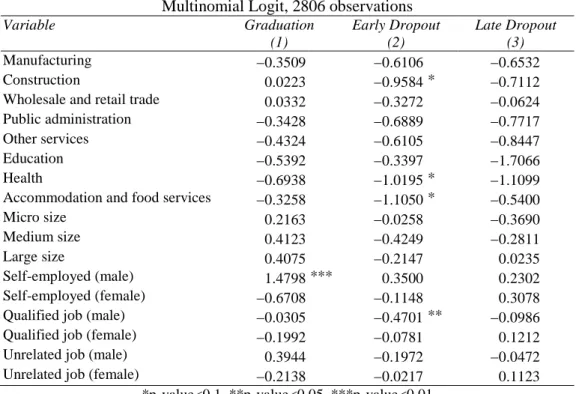
Employment variables
The results for the employment variables are exhibited in Table 4. The business sector of the employer seems to be important for the probability of dropping out early. This is indeed the case for those working in construction, health, or accommodation and food services, which have reduced early dropout intensity as compared to the other sectors. On the contrary, the size of the employer organization is found not to be relevant for the academic achievement of adult student-workers.
In case of male adult student-workers, being self-employed or/and exercising a qualified job contributes positively for academic achievement. The former contributes to increase the hazard of graduation and the latter to decrease the probability of dropping out early. For female
14
student-workers, though, the qualification level of the job and self-employment seem not to be relevant for academic achievement.
Table 4. Effects of employment variables Multinomial Logit, 2806 observations
Variable Graduation (1) Early Dropout (2) Late Dropout (3) Manufacturing −0.3509 −0.6106 −0.6532 Construction 0.0223 −0.9584 * −0.7112
Wholesale and retail trade 0.0332 −0.3272 −0.0624 Public administration −0.3428 −0.6889 −0.7717
Other services −0.4324 −0.6105 −0.8447
Education −0.5392 −0.3397 −1.7066
Health −0.6938 −1.0195 * −1.1099
Accommodation and food services −0.3258 −1.1050 * −0.5400
Micro size 0.2163 −0.0258 −0.3690
Medium size 0.4123 −0.4249 −0.2811
Large size 0.4075 −0.2147 0.0235
Self-employed (male) 1.4798 *** 0.3500 0.2302
Self-employed (female) −0.6708 −0.1148 0.3078 Qualified job (male) −0.0305 −0.4701 ** −0.0986 Qualified job (female) −0.1992 −0.0781 0.1212
Unrelated job (male) 0.3944 −0.1972 −0.0472
Unrelated job (female) −0.2138 −0.0217 0.1123 *p-value<0.1, **p-value<0.05, ***p-value<0.01
The academic achievement of adult student-workers appears not to be affected by the relation between the profession and the field of study of the degree. At a first glance, one would expect that professional experience in the field helps students in their academic progress. However, student-workers that enroll in an degree with no relation at all with their profession are often aiming to find a new (more rewarding) career, rather than investing on progression or skill updating within their current professional career. According to the human capital theory pioneered by Becker (1962), these students foresee more benefits resulting from graduation and thus make more efforts to achieve it, which countervails the beneficial effect of professional experience.
5. Conclusion and Policy Implications
The existence of a high dropout rate in higher education is one of the main concerns of both central education policy decision makers and higher education institutions, as it implies significant losses for the individuals, society and economy. The percentage of students that drop out from tertiary education is even higher among adult student-workers, which may be explained not only by time constraints (they dedicate a significant amount of time to their jobs, thus reducing the time available for school activities), by the time gap between conclusion of secondary school
15
and enrolment in higher education and/or by extended family responsibilities that result from eventual marriage and parenting, but also by the lack of specific education policies directed to them, as they are generally more fitted for the traditional students.
Despite the above, little research has been conducted on analysing dropout and graduation rates for the particular case of adult student-workers. Therefore, in our paper, we looked for the factors that can explain the propensities of adult student-workers to either graduate, drop out or persist in higher education, with the additional contribution of distinguishing the students who drop out with a large number of completed credits from those who drop out with few completed credits. Indeed, regarding the latter, the results show that the predictors are substantially different between the two types of dropout. Early dropouts depend more on academic failure, distance between residence and school and personal motivation for the degree, while late dropouts are less dependent on academic failure and on employment variables and more dependent on factors as marital status (in the case of females) and degree characteristics, for example.
As we considered a large set of individual, degree and employment covariates, with some of them controlled by policy makers, education institutions or students themselves, we are now able to offer several policy indications that can contribute to reduce dropout rates and/or increase graduation rates among adult student-workers.
First of all, and in line with most of the literature on traditional students, it is of vital importance to provide some assistance to the adult student-workers with low academic performance, particularly in the first year of enrolment, where the risk of early dropout is higher. This may include recuperation programs or additional tutorial hours with the teachers, for example. Also, education institutions must design strategies to prevent stopout behaviour among adult student-workers, as it restricts the prospects of future academic achievement.
Next, while offering post-work class schedules is important for the participation of adult student-workers in higher education, scheduling daytime classes to the students who can attend them may contribute to decrease dropout rates. Also, e-learning courses, usually associated with high dropout rates among traditional students, may be important to prevent late dropouts among adult student-workers.
A higher school-residence geographical distance appears to enhance the risk of early dropout among adult student-workers. Criteria for regional preference in the admission process are thus recommendable for these students.
We also found that, among adult student-workers, men are more likely to drop out than women and that they are, in general, more influenced by employment variables, as for example self-employment and job qualification level. For women, marriage seems to increase the risk of late dropout, which may reflect their traditionally higher devotion to household responsibilities.
16
As such, policies designed to transform and adjust the higher-education system so as conciliate better the job-study-family dimensions, according to gender differences, are required.
On the admission regimes, the main conclusions are that adult student-workers enrolling through CNAES represent a lower risk of early dropout in the first year and that the effect of the admission regime on graduation and dropout hazard ratios of adult student-workers loses significance after the first year of enrolment. Even though this partly supports the established result that CNAES students drop out less often and graduate more frequently that led to the common practice by central education authorities of privileging them in terms of admission vacancies, the fact that M23 student-workers perform as well as CNAES student-workers after year 1 may justify a more even distribution of vacancies across admission regimes, particularly for the degrees designed for student-workers.
Still on the admission process, in the case of adult student-workers, a high personal motivation for the degree seems key to academic achievement. Therefore, whether they are applying to the degree as their first option is recommendable as a criterion for the admission of these students.
Even though their main aim is to increase participation in higher education, part-time status and financial aid (scholarships) must be reassessed as instruments to decrease dropout behaviour and increase graduation chances of adult student-workers. Giving higher financial benefits to the students together with higher performance requirements to obtain and preserve them would probably lead to more graduations.
Regarding the employment variables, self-employment and job qualification level are shown to be relevant for academic achievement of adult student-workers, particularly for men, as well as the size and business sector of the employer, which is valuable information to be used by higher education institutions when assessing the curriculum of the candidates in the admission process.
Finally, it was possible to observe that adult student-workers have higher graduation prospects and dropout less often when enrolled in a degree with a higher dispersion of final GPA and/or with a higher proportion of student-workers, in this last case reflecting the importance of academic integration for this particular type of students. When forming classes, education institutions can take this into account, for example by making efforts to join student-workers and students with distinct academic performances in the same classroom.
Acknowledgements
The authors gratefully acknowledge Leiria Polytechnic Institute, particularly the presidency and the strategic planning office, for the authorization to use their internal databases, which were essential for our investigation.
17
6. References
Arias Ortiz, E., & Dehon, C. (2013). Roads to Success in the Belgian French Community’s Higher Education System: Predictors of Dropout and Degree Completion at the Université Libre de Bruxelles. Research in Higher Education, 54(6), 693–723. https://doi.org/10.1007/s11162-013-9290-y
Bean, J. P. (1980). Dropouts and Turnover: The Synthesis and Test Of A Causal Model of Student Attrition. Research in Higher Education, 12(2), 155–187.
https://doi.org/10.1007/BF00976194
Becker, G. S. (1962). Investment in Human Capital: A Theoretical Analysis. Journal of
Political Economy, 70(5, Part 2), 9–49. https://doi.org/10.1086/258724
Costa, A., & Duarte, J. (2012). Social Mobility through Higher Education. In 3rd International
Workshop Sharing Best Practices in R&D and Education Statistics. Lisbon.
DesJardins, S., Ahlburg, D., & McCall, B. (1999). An event history model of student departure.
Economics of Education Review, 18(3), 375–390.
https://doi.org/10.1016/S0272-7757(98)00049-1
DesJardins, S., Ahlburg, D., & McCall, B. (2002). A Temporal Investigation of Factors Related to Timely Degree Completion. The Journal of Higher Education, 73(5), 555–581. https://doi.org/10.1080/00221546.2002.11777168
Gilardi, S., & Guglielmetti, C. (2011). University Life of Non-Traditional Students:
Engagement Styles and Impact on Attrition. The Journal of Higher Education, 82(1), 33– 53. https://doi.org/10.1080/00221546.2011.11779084
Heublein, U. (2014). Student Drop-out from German Higher Education Institutions. European
Journal of Education, 49(4), 497–513. https://doi.org/10.1111/ejed.12097
Johnes, G., & McNabb, R. (2004). Never Give up on the Good Times: Student Attrition in the UK. Oxford Bulletin of Economics and Statistics, 66(1), 23–47.
https://doi.org/10.1111/j.1468-0084.2004.00068.x
Murtaugh, P. A., Burns, L. D., & Schuster, J. (1999). Predicting the Retention of University Students. Research in Higher Education, 40(3), 355–371.
https://doi.org/10.1023/A:1018755201899
Naylor, R., & Smith, J. (2004). Determinants of educational success in higher education. In G. Johnes & J. Johnes (Eds.), International Handbook on the Economics of Education (pp. 415–461). Edward Elgar Publishing. https://doi.org/10.4337/9781845421694.00005 OECD. (2016). Portugal - Country Note - Education at a Glance: OECD indicators. OECD
Publishers.
18
Risks Event History Analysis in Education Research. Journal of Educational and
Behavioral Statistics, 30(4), 413–442. https://doi.org/10.3102/10769986030004413
Singer, J. D., & Willett, J. B. (1993). It’s About Time: Using Discrete-Time Survival Analysis to Study Duration and the Timing of Events. Journal of Educational and Behavioral
Statistics. https://doi.org/10.3102/10769986018002155
Singer, J. D., & Willett, J. B. (2003). Applied longitudinal data analysis: Modeling change and
event occurrence. Oxford university press.
Stratton, L. S., O’Toole, D. M., & Wetzel, J. N. (2008). A multinomial logit model of college stopout and dropout behavior. Economics of Education Review, 27(3), 319–331. https://doi.org/10.1016/j.econedurev.2007.04.003
Tinto, V. (1975). Dropout from higher education: A theoretical synthesis of recent research.
Review of Educational Research, 45(1), 89–125.
Tinto, V. (1988). Stages of student departure: Reflections on the longitudinal character of student leaving. The Journal of Higher Education, 59(4), 438–455.
Tinto, V. (1993). Toward a theory of doctoral persistence. Leaving College. Rethinking the
Causes and Cures of Student Attrition, 230–256.
Willett, J. B., & Singer, J. D. (1991). From Whether to When: New Methods for Studying Student Dropout and Teacher Attrition. Review of Educational Research, 61(4), 407–450. https://doi.org/10.3102/00346543061004407
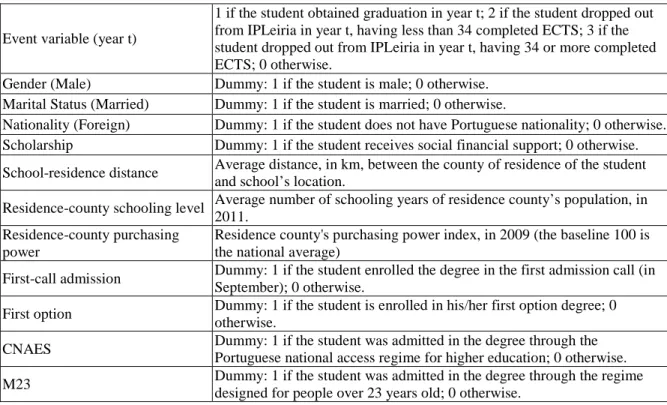
7. Appendix
Table A.1. Description of the variables
Event variable (year t)
1 if the student obtained graduation in year t; 2 if the student dropped out from IPLeiria in year t, having less than 34 completed ECTS; 3 if the student dropped out from IPLeiria in year t, having 34 or more completed ECTS; 0 otherwise.
Gender (Male) Dummy: 1 if the student is male; 0 otherwise. Marital Status (Married) Dummy: 1 if the student is married; 0 otherwise.
Nationality (Foreign) Dummy: 1 if the student does not have Portuguese nationality; 0 otherwise. Scholarship Dummy: 1 if the student receives social financial support; 0 otherwise. School-residence distance Average distance, in km, between the county of residence of the student
and school’s location.
Residence-county schooling level Average number of schooling years of residence county’s population, in 2011.
Residence-county purchasing power
Residence county's purchasing power index, in 2009 (the baseline 100 is the national average)
First-call admission Dummy: 1 if the student enrolled the degree in the first admission call (in September); 0 otherwise.
First option Dummy: 1 if the student is enrolled in his/her first option degree; 0 otherwise.
CNAES Dummy: 1 if the student was admitted in the degree through the Portuguese national access regime for higher education; 0 otherwise. M23 Dummy: 1 if the student was admitted in the degree through the regime
19
Part-time status Dummy: 1 if the student has the part time status in year t; 0 otherwise. Retention years Number of accumulated retention years.
Stopout Number of accumulated enrolment interruptions.
Daytime Schedule Dummy: 1 if the classes of the degree occur between 8 a.m. and 6 p.m.; 0 otherwise.
E-Learning Dummy: 1 if the student-worker is enrolled in an e-learning degree; 0 otherwise.
Field of study - Arts Dummy: 1 if the degree is in the field of arts; 0 otherwise. Field of study - Education Dummy: 1 if the degree is in the field of education; 0 otherwise. Field of study - Health Dummy: 1 if the degree is in the field of health; 0 otherwise. Field of study - Social Sciences
and Law
Dummy: 1 if the degree is in the field of social sciences or law; 0 otherwise.
Field of study - Engineering Dummy: 1 if the degree is in the field of engineering; 0 otherwise. Field of study - Information
Technologies
Dummy: 1 if the degree is in the field of information technologies; 0 otherwise.
Field of study - Services Dummy: 1 if the degree is in the field of services; 0 otherwise. Degree total number of students Number of total students in the degree.
Degree % student-workers Percentage of student-workers in the degree.
Degree % same gender Percentage of students with the same gender of the student in the degree. Degree % part-time students Percentage of part-time students in the degree.
Degree % scholarships Percentage of scholarship students in the degree. Degree % foreign students Percentage of foreign students in the degree. Degree average final GPA Average final GPA within the degree. Degree final GPA standard
deviation Standard deviation of final GPA within the degree. Degree average age Average age of students within the degree.
Degree age standard deviation Standard deviation of the age of students within the degree.
Business sector - Manufacturing Dummy: 1 if the student works in the manufacturing sector; 0 otherwise. Business sector - Construction Dummy: 1 if the student works in the construction sector; 0 otherwise. Business sector - Wholesale and
retail trade
Dummy: 1 if the student works in the wholesale and retail trade sector; 0 otherwise.
Business sector - Public administration
Dummy: 1 if the student works in the public administration sector; 0 otherwise.
Business sector - Other services Dummy: 1 if the student works in other services sectors; 0 otherwise. Business sector - Education Dummy: 1 if the student works in the education sector; 0 otherwise. Business sector - Health Dummy: 1 if the student works in the health sector; 0 otherwise. Business sector - Accommodation
and food services
Dummy: 1 if the student works in the accommodation and food services sector; 0 otherwise.
Micro size Dummy: 1 if the size of the employer organization is classified as micro according to the legal definition; 0 otherwise.
Small size Dummy: 1 if the size of the employer organization is classified as small according to the legal definition; 0 otherwise.
Medium size Dummy: 1 if the size of the employer organization is classified as medium according to the legal definition; 0 otherwise.
Large size Dummy: 1 if the size of the employer organization is classified as large according to the legal definition; 0 otherwise.
Self-employed Dummy: 1 if the student is a self-employed worker; 0 otherwise.
Unrelated job Dummy: 1 if the student enrolls in a degree that has no relation at all with the job; 0 otherwise.
Qualified job Dummy: 1 if the student-worker exercises a qualified job according to the legal definition; 0 otherwise.