Setembro 2016
September 2016
Carolina Velhinho Pereira
Degree in Biomedical Science in Histocellular Pathology
Effect of Citrus Bioactive Compounds
on Targeting Human Colorectal Cancer Stem Cells
Dissertation to obtain master degree in Biotechnology
Supervisor: Ana Teresa Serra, PhD, iBET/ITQB-UNL Co-supervisor: Cristina Albuquerque, Senior Investigator, IPOLFG
Jury
President: Professor Doutor Pedro Miguel Ribeiro Viana Baptista Arguer: Doutora Maria LuisaMouratodeOliveiraMarquesSerralheiro Supervisor: Doutora Ana Teresa de Carvalho Negrão Serra
“Copyright”
Effect of Citrus Bioactive Compounds on Targeting Human Colorectal Cancer Stem Cells
Carolina Velhinho Pereira, FCT/UNL e UNL
Acknowledgments
Gostaria de expressar o maior agradecimento a todas as pessoas que contribuíram direta e indiretamente para a realização deste trabalho.
Primeiramente, quero agradecer à Dra. Teresa Serra e Dra. Cristina Albuquerque por logo na entrevista terem confiado que seria a pessoal ideal para integrar este projeto. Agradeço por ao longo de todo o período me terem orientado, aconselhado e transmitido novos conhecimentos nas mais diversas áreas. Importante também será agradecer a paciência inesgotável para me ajudarem a esclarecer as minhas “dúvidas laboratoriais”. Obrigada por ao longo deste ano me terem ajudado a crescer profissionalmente e por me fazerem acreditar que um dia poderei ser uma boa investigadora! À Dra. Catarina Duarte agradeço a oportunidade de permitir desenvolver o meu trabalho no grupo de Nutracêuticos e Libertação Controlada. Aos membros desde grupo: Joana Poejo, Maria João Pereira, Ana Nunes e Vanessa Gonçalves agradeço toda a ajuda, comentários e sugestões que deram. Ao Agostinho Alexandre e ao Luís Martins agradeço especialmente o divertimento na tentativa de causar inveja com a caça de Pokemóns durante o verão que trabalhei para a tese e não para o bronze e sem não esquecer o apoio que prestaram na preparação dos extractos de laranja. À Inês Silva, agradeço todo o conhecimento da cultura 3D que me transmitiu.
Tenho um agradecimento especial à Marlene Duarte e Patrícia Silva por todo o apoio, paciência, ensinamentos e ajuda ao longo da minha curta estadia do IPOLFG.
Agradeço às minhas colegas de tese, por todo o apoio e ajuda que proporcionaram nos momentos mais difíceis. Obrigada Lucília, Ana e Anyse! Especialmente, obrigada Joana pela ajuda incondicional nas mais diversas áreas, pois sem ti tudo teria sido mais difícil! Obrigada por todos os momentos engraçados que aliviaram toda a pressão.
À minha mãe, pai e mano agradeço todo o apoio e confiança que tiveram nas minhas decisões e por me ajudarem a construir um futuro que espero que seja promissor.
Kika, agradeço os instantes que me aliviaram nas fases mais difíceis. Obrigada por tudo!
Abstract
Recently, there has been an increase in the interest of the application of natural extract for cancer prevention and treatment, where phenolic compounds are associated with a high effectiveness in prevention and treatment of the disease. One of the promising targets for cancer therapy is the cancer stem cells population, which has been recognized as responsible for tumor initiating, relapse and chemo-resistance.
The main goal of this thesis was to evaluate the chemotherapeutical potential of polymethoxylated flavones (PMFs) from orange peel extracts, using HT29 3D colorectal cancer model. This model was characterized in terms of stemness and self-renewal properties.
HT29 cell spheroids were characterized along the culture time showing resemblances to the in vivo
tumors, reflecting highly rich stem population where high expression of CD44, CD133 and ALDH1 biomarkers was associated to high self-renewal capacity. Moreover, this model showed partial EMT characteristics.
Orange peel extract showed anticancer potential in HT29 cell aggregates by inhibiting cell proliferation and inducing cell cycle arrest and apoptosis. Self-renewal ability was also affected with association to decreasing of the expression of stemness markers. The bioactive molecules in the extract were identified as nobiletin, sinensetin, tangeretin and scutellarein tetramethylether. Among all PMFs, tangeretin exhibited the highest capability in affecting self-renewal, inducing apoptosis and cell cycle arrest and reducing the expression of mesenchymal and stemness markers. The mixture of PMFs showed similarities with the activity of orange extract although in a less effective way, suggesting the presence of other compounds that might potentiate the effect. Additionally, orange peel extract showed to interact synergistically with 5-fluorouracil decreasing the drug dosage to inhibit HT29 cell spheroids proliferation.
Results of this thesis revealed that orange bioactive compounds, including PMFs, are able to target cancer cells with stemness and self-renewal characteristics and thus can be considered as promising natural chemotherapeutic agents for colorectal cancer treatment.
Keywords
Resumo
Recentemente tem surgido um crescente interesse na prevenção e tratamento do cancro através da aplicação de compostos naturais. Nomeadamente, os compostos fenólicos têm demonstrado uma elevada eficácia nestas áreas. Um dos alvos mais promissores na terapia do cancro são as células estaminais cancerígenas, sendo esta população reconhecida como responsável pelo início, recorrência e quimio-resistência dos tumores.
O objectivo deste trabalho consistiu em avaliar o potencial quimio-terapêutico das flavonas polimetoxiladas (PMFs) presentes em extractos de casca de laranja através de um modelo 3D do cancro colorectal (HT29). Este modelo foi caracterizado a nível do carácter estaminal e capacidade de autorrenovação.
O modelo celular 3D (HT29) foi caracterizado ao longo do tempo de cultura mostrando semelhanças com os tumores in vivo, tendo uma população rica em características estaminais. A elevada expressão dos biomarcadores estaminais CD44, CD133 e ALDH mostrou ter associação com uma elevada capacidade de autorrenovação. Ainda, este modelo mostrou características de uma transição epitelial-mesenquimal (EMT) parcial.
O extrato de casca de laranja mostrou ter potencial anticancerígeno nos agregados HT29 através da inibição da proliferação celular e indução da apoptose e paragem do ciclo celular. A capacidade de autorrenovação dos agregados HT29 foi afectada em associação com a diminuição da expressão de biomarcadores estaminais. As moléculas bioativas identificadas no extracto foram: nobiletina, sinensetina, tangeretina e tetrametil-O-escutelareína. De todas as PMFs, a tangeretina foi o composto que exibiu maior capacidade em influenciar a autorrenovação, induzir apoptose e paragem do ciclo celular e em reduzir a expressão de biomarcadores mesenquimais e estaminais. A mistura das PMFs mostrou atividade semelhante com a obtida com o extrato de laranja, embora não tão eficaz o que sugere a presença de outros compostos no extrato que poderão potenciar a atividade. Ainda, o extracto de casca de laranja mostrou interagir sinergicamente com a fármaco 5-fluorouracil, levando à diminuição da dosagem do fármaco para a inibição da proliferação dos agregados HT29.
Os resultados deste trabalho revelaram que os compostos bioativos presentes na laranja, incluindo PMFs, são capazes de exercer efeito em células cancerígenas com características estaminais e de autorrenovação podendo ser considerados como promissores agentes quimio-terapêuticos naturais para o tratamento do cancro colorectal.
Palavras-chave
List of Contents
Acknowledgments ... vii
Abstract ... ix
Keywords ... ix
Resumo ... xi
Palavras-chave ... xi
List of Contents ... xiii
List of Figures ... xv
List of Tables ... xix
List of Abbreviations ... xxi
1. Introduction ... 1
1.1. Colorectal Cancer ... 1
1.1.1. Epidemiology and etiology ... 1
1.1.2. Location and characterization ... 2
1.1.3. Molecular pathways involved in carcinogenesis ... 3
1.1.4. Metastasizing process ... 4
1.1.5. The role of stem cells in colorectal carcinogenesis ... 6
1.1.6. Cancer treatment and chemoprevention ... 8
1.2. Natural compounds and CRC ... 11
1.2.1. Phytochemicals ... 11
1.2.2. Phytochemicals from citrus ... 12
1.3. Cancer models ... 14
1.3.1. Characteristics of 3D cellular models ... 14
1.3.2. 3D cell models for colorectal cancer ... 18
1.3.3. HT29 cell line-derived spheroids ... 18
1.4. Aim of the Thesis ... 20
2. Experimental Procedures ... 23
2.1. Natural Extracts ... 23
2.1.1. In Vitro Digestion ... 23
2.2. Phytochemical Characterization ... 24
2.2.1. High Performance Liquid Chromatography (HPLC) for phenolic content analysis ... 24
2.3. Cell-based Assays ... 25
2.3.1. Cell culture ... 25
2.3.2. Reagents ... 25
2.3.3. Cytotoxicity assay ... 25
2.3.5. 3D cell culture system – spheroids culture and formation ... 26
2.3.6. Antiproliferative assay using 3D cell culture system ... 27
2.3.7. Soft agar colony forming unit assay ... 28
2.3.8. Aldefluor assay by Fluorescence-activated cell sorting (FACS) analysis ... 28
2.4. Genetic-based Assays ... 30
2.4.1. RNA extraction and cDNA synthesis ... 30
2.4.2. Quantitative reverse transcription-polymerase chain reaction (RT-qPCR) ... 30
3. Results and Discussion ... 33
3.1. Screening of orange peel extracts: phytochemical characterization and antiproliferative effect ... 33
3.2. Characterization of HT29 spheroids enriched in CSCs ... 40
3.2.1. Analysis of cancer stemness markers ... 40
3.2.2. Evaluation of capacity of self-renewal ... 42
3.2.3. Involvement of key signaling pathways and EMT ... 43
3.3. Exploring the effect of OPE and PMF compounds in targeting CSCs population ... 48
3.3.1. Antiproliferative activity ... 48
3.3.2. Inhibition of self-renewal ability ... 50
3.3.3. Inhibition of aldehyde dehydrogenase activity by Aldefluor assay ... 52
3.3.4. Influence on the expression of markers of cancer stemness, EMT, cell cycle and key signaling pathways ... 53
3.3.5. Combination of 5-fluorouracil and orange peel extract ... 59
4. Conclusion ... 61
5. References ... 63
List of Figures
Figure 1.1 – Estimated new cancer cases worldwide in 2012 [1]. ... 1
Figure 1.2 – The adenoma-carcinoma sequence: main histological and molecular alterations in each stage of sporadic colon cancer progression (adapted from [14]). ... 2
Figure 1.3 – Representative model of metastatic process: acquisition of genetic/epigenetic alterations (A); epithelial-mesenchymal transition (B); intravasation to vascular circulation(C); extravasation and mesenchymal-epithelial transition with angiogenesis originating a secondary tumor (D) (adapted from [23]). ... 4
Figure 1.4 – Gene expression induced by nuclear translocation of β-catenin and its influence on the metastasizing process [27]. ... 5
Figure 1.5 – Representative models of carcinogenesis [37]. Stochastic model – cells with different phenotypes origin tumors (A). CSCs model – cells with stemness capacity are the ones capable of tumor development (B). ... 6
Figure 1.6 – Representative model of a novel approach on cancer treatment: CSCs have the ability of self-renewal and resistance to death allowing tumor relapse after treatment, which make them the most promising candidate for a therapy [37]. ... 8
Figure 1.7 – Therapeutic targets of Hallmarks of cancer [54]. ... 9
Figure 1.8 – Classification of phenolic compounds according with Liu et al. [61]. ... 11
Figure 1.9 – Spheroid organizational architecture and components distribution. CO2 and waste
metabolites tend to increase from the outer to the center of the spheroid. The O2, nutrients and
growth factor disposition tends to be reverse [98]. ... 15
Figure 1.10 – Types of three-dimensional cell models based on cells of origin (A) and type of system that can be used for spheroids culture (B). ... 15
Figure 1.11 – Main systems use for 3D cell culture: liquid overlay (A); hanging drop (B); spinner flask (C); rotary cell culture system (C); scaffolds use in bioreactors (E) (adapted from [98]). ... 16
Figure 1.12 – Immunofluorescence markers use for characterization of HT29 cell spheroids cultured by stirred system [132]. ... 19
Figure 1.13 – Work plan for the present thesis organized in three main tasks. ... 20
Figure 3.1 – HPLC chromatograms of OPE1 (blue) and OPE 2 (red) recorded at 320 nm. Legend: 1 – sinensetin; 2 – nobiletin; 3 – tangeretin. ... 33
Figure 3.2 – Antiproliferative effect of OPE 1 and OPE 2 after 24h incubation on HT29 monolayer. Results were mean ± SD (n=3). ... 34
Figure 3.3 – Antiproliferative activity of OPE 3 with two different times of incubation using HT29 cell line (A). Results were mean ± SD (at least n=2). EC50 values obtained (mean ± SD) (B). ... 35
Figure 3.4 – HPLC chromatograms of OPE 3 (black) and its gastrointestinal digested sample (grey), both at concentration of 2 mg sample/mL (recorded at 320 nm). Legend: 1 – sinensetin; 2 – nobiletin; 3 – scutellarein tetramethylether; 4 – tangeretin (A). Antiproliferative activity of OPE 3 and its digested sample in HT29 colon cancer cell line with 24h of incubation. Results in mean ± SD (n=3) (B). ... 36
Figure 3.6 – Antiproliferative effect of standard PMFs compared to OPE 3 activity using HT29 cell line with 24h incubation (at least n=2 – results were mean ± SD). ... 38
Figure 3.7 – Relative expression of stemness markers along HT29 cell culture. Results were normalized relatively to the HT29 monolayer and experiment performed in triplicate using RT-qPCR. ... 40
Figure 3.8 – Percentage of ALDH+ cells in 2D and 3D HT29 models. Results were obtained by ALDEFLUOR assay and were expressed as mean ± SD of two independent experiments. The significant differences are expressed in asterisks (ns P>0.05; * P≤0.05) by one-way ANOVA analysis for comparisons with 2D. ... 41
Figure 3.9 – Capacity of HT29 spheroids forming secondary tumors (colonies) through soft agar colony forming unit assay. After 14 days, the resulting visible colonies were counted and expressed in mean ± SD (at least n=2). The letter labels on the histogram indicate the statistical significant differences according to one-way ANOVA for multiple comparisons (* P≤0.05; ** P≤0.01; **** P≤0.0001). ... 42
Figure 3.10 – Relative expression of epithelial markers using RT-qPCR. Results were normalized relatively to the HT29 cell monolayer and experiment performed in triplicate. ... 44
Figure 3.11 – Relative expression of EMT markers using RT-qPCR. Results were normalized relatively to the HT29 monolayer and experiment performed in triplicate. ... 44
Figure 3.12 – Relative expression of Wnt signaling markers using RT-qPCR. Results were normalized relatively to the HT29 monolayer and experiment performed in triplicate. ... 45
Figure 3.13 – Dose-response curves of OPE 3 at 24h and 72h incubation using HT29 cell spheroids (results were mean ± SD (at least n=3 with hexaplicates)) (A). Comparing EC50 values of 2D and 3D HT29 culture at different incubation times (mean ± SD) (B). ... 48
Figure 3.14 – Dose-response curves of the mixture of three (NST) and the mixture of the four PMFs (NSTSc) present in OPE 3. Results were expressed in mean ± SD (at least three independent experiments performed in hexaplicates). Legend: N = nobiletin; S = sinensetin; T = tangeretin; Sc = scutellarein tetramethylether. ... 49
Figure 3.15 – Percentage of colonies formed after treatment with OPE 3 (A) and PMFs with concentration equivalent to 0.35 mg extract/mL (B). Results were mean ± SD in percentage relatively to the control (without treatment) during 14 days (n=3). The asterisks represent the statistical significant differences according to one-way ANOVA for multiple comparisons relatively to the control (ns P>0.05; * P≤0.05; ** P≤0.01; **** P≤0.0001). Legend: N = nobiletin 17.11 µM; S = sinensetin 16.24 µM; T = tangeretin 3.63 µM; Sc = scutellarein tetramethylether 10.99 µM. ... 50
Figure 3.16 – Ability of PMFs to inhibit colonies formation. Results were mean ± SD (n=3). The asterisks represent the statistical significant differences according to one-way ANOVA for multiple comparisons relatively to untreated cells (ns P>0.05; *** P≤0.001; **** P≤0.0001). Legend: N = nobiletin; S = sinensetin; T = tangeretin; Sc = scutellarein tetramethylether. ... 51
Figure 3.17 – Effect of OPE 3 in ALDH+ cell population (A) and comparing the effect of NSTSc combination with OPE at the ALDH+ population (B). Results were mean ± SD (at least n=2). The asterisks represent the statistical significant differences according to one-way ANOVA for multiple comparisons relatively to untreated cells (ns P>0.05; * P≤0.05; ** P≤0.01 *** P≤0.001; **** P≤0.0001). Legend: NSTSc = combination of nobiletin, sinensetin, tangeretin and scutellarein tetramethylether; OPE = orange peel extract. ... 52
Figure 3.19 – Relative expression of specific markers using RT-qPCR for stemness (PROM1, LGR5, CD44, SOX9) apoptosis (BIRC5) and cell cycle (p21) (A); EMT (VIM, SNAI1), invasion (EGR1), epithelial/cell adhesion (CDH1, EPCAM), and Wnt signaling (CTNNB1, AXIN2) (B) markers. It was used day 7 of HT29 cell spheroids treated with OPE 3 for 72h. Each expression level was normalized relatively to the solvent control. Results were mean ± SD with at least n=2. ... 54
Figure 3.20 – Relative expression of specific markers using RT-qPCR for stemness (PROM1, LGR5) (A) and EMT (SNAI1), epithelial/cell adhesion (CDH1) and Wnt signaling (CTNNB1, AXIN2) markers (B). It was used days 4, 7 and 12 of HT29 spheroids treated with OPE 3 for 72h. Each expression level was normalized relatively to the solvent control. Results were performed in triplicates. ... 55
Figure 3.21 – Comparing the relative expression of specific markers using RT-qPCR and different concentrations treatments using day 7 spheroids (A). Comparing the relative expression of specific markers using RT-qPCR and treatment of 1 mg extract/mL of OPE 3 to days 4,7, and 12 spheroids (B). Treatment was performed with 72h incubation, and expression levels were normalized relatively to the solvent control using triplicates by RT-qPCR. ... 56
Figure 3.22 – Relative expression of specific markers using RT-qPCR for stemness (PROM1, LGR5) (A); apoptosis (BIRC5) and cell cycle (p21, CCNA2) (B); EMT (SNAI1, VIM), invasion (EGR1) and epithelial/cell adhesion (CDH1) (C) markers. It was used day 7 HT29 spheroids treated with PMFs for 72h. Each expression level was normalized relatively to the solvent control. Results were performed in triplicates. Legend: N = nobiletin; S = sinensetin; T = tangeretin; Sc = scutellarein tetramethylether. ... 57
Figure 3.23 – Antiproliferative activity of orange peel extract, 5-fluorouracil and the combination of the two compounds (OPE + 5-FU) (A). Incubation time of 72h using HT29 spheroid model. Results were expressed in mean ± SD (n=3). Comparing EC50 values obtained (mean ± SD) (B). Legend: 5-FU = 5-fluorouracil; OPE = orange peel extract; N = nobiletin; S = sinensetin; T = tangeretin; Sc = scutellarein tetramethylether. ... 59
List of Tables
Table 1.1 – Classes of molecules involved in EMT [25]. ... 5
Table 1.2 – Putative cancer stem cell markers. ... 7
Table 1.3 – Main mechanisms of chemoprevention by flavonoids in multistage carcinogenesis [59], [61], [62]. ... 12
Table 1.4 – Most common citrus flavonoids and its effect at CRC. ... 13
Table 1.5 – Advantages and disadvantages of culture systems [98], [100]. ... 17
Table 1.6 – Resume of recent work using CRC spheroids for study whether tumor biology or effect of compounds. ... 18
Table 2.1 – Extraction conditions used to obtain natural orange peel extract (OPE). For all the extracts were used Portuguese oranges, being OPE 1 and OPE 2 obtained from the same raw material. 23
Table 2.2 – List of primers and respective concentration used for RT-qPCR assays. ... 31
Table 3.1 – PMF content of orange peel extracts and EC50 values obtained. ... 34
Table 3.2 – PMF content of orange peel extracts (OPE 3) and EC50 value obtained. ... 35
Table 3.3 – Plate efficiency of HT29 cells expressed in mean ± SD. ... 43
Table 3.4 – Cell markers expression levels along the culture of HT29 cell spheroids relatively to the cell monolayer expression. Legend: 0 = similar expression; +/ - = high/low expression; + + / - - = very high/low expression; + + + / - - - = extremely high/low expression. ... 46
Table 3.5 – EC50 values of OPE 3 and the mixtures of PMFs determined using 3D model (72h incubation). ... 49
Table 3.6 – Effect of OPE 3 and the combination NSTSc on reducing ALDH+ population in HT29 cell spheroids. Results were in mean ± SD. ... 52
Table 3.7 - Combination Index values resulting of the interactions between OPE 3 and 5-FU. Data obtained by Compusyn software resulting of the compilation of the antiproliferative percentages. ... 60
Table 6.1 – Structure of the main compounds present in natural extracts of orange [210], [211]. ... 73
Table 6.2 – Combination Index from the combination between two PMFs. Legend: N = nobiletin; S = sinensetin; T = tangeretin; Sc = scutellarein tetramethylether. ... 75
Table 6.3 – Combination Index from the possible combinations between three PMFs. Legend: N = nobiletin; S = sinensetin; T = tangeretin; Sc = scutellarein tetramethylether; + = compound added to a mixture of two other compounds. ... 75
List of Abbreviations
Abbreviation Full form
5-FU 5-fluorouracil
5HHMF 5-hydroxy-3,6,7,8,3′,4′-hexamethoxyflavone 5HPMF 5-hydroxy-6,7,8,3′,4′-pentamethoxyflavone 5HTMF 5-hydroxy-6,7,8,4´-tetramethoxyflavone
ALDH Aldehyde dehydrogenase
APC Adenomatous poliposis coli
Bcl-2 B-cell lymphoma 2
cDNA Complementary deoxyribonucleic acid
CRC Colorectal carcinoma
CSC Cancer stem cell
COX-2 Cyclo-oxigenase 2
CK18 cytokeratin 18
DAD Diode array detector
DCC Deleted in colorectal cancer
DEPC Diethylpyrocarbonate
DEAB Diethylaminobenzaldehyde
DMSO Dimethyl sulfoxide
DNA Deoxyribonucleic acid
dNTP Deoxynucleotide triphosphate
DTT Dithiothreitol
EC50 Effective dose value
ECM Extra cellular matrix
EGCG Epigallocatechin gallate
EMT Epythelial-mesenchymal transition
EPCAM Epithelial cell adhesion molecule FACS Fluorescence activated cell sorting
FAP Familiar adenomatous polyposis
FBS Fetal bovine serum
HNPCC Hereditary nonpolyposis colorectal cancer
LEF Lymphoid enhancer factor
Lgr5 Leucine-rich-repeat-containing G-protein coupled receptor 5
LOH Loss of heterozygosity
MAPK Mitogen activated protein kinases MCTS Multicellular tumor spheroids
MMP-2 Metalloproteinase 2
mRNA Messenger ribonucleic acid
N Nobiletin
NSAIDS Non-steroidal inflammatory drugs
OPE Orange peel extract
PBS Phosphate-buffered saline
PMF Polymethoxylated flavones
PROM1 Prominin 1
RCCS Rotary cell culture system
RNA Ribonucleic acid
RPMI Roswell Park Memorial Institute
RT-qPCR Reverse transcriptase quantitative polymerase chain reaction
S Sinensetin
Sc Scutellarein tetramethylether
SFE Supercritical fluid extraction
SGF Simulated gastric fluid
SIF Simulated intestinal fluid
T Tangeretin
TCF T-cell factor
TGF-β Transforming growth factor beta
TNF Tumor necrosis factor
1. Introduction
1.1.
Colorectal Cancer
1.1.1. Epidemiology and etiology
Worldwide, cancer is the second leading cause of death in developed countries and the third in developing countries, resulting in 14.1 million new cases in 2012 [1].
According to Ferlay et al., colorectal carcinoma (CRC) is the second foremost cause for cancer-related death in Europe, being the third most frequently diagnosed cancer in men (13.2% of all cancer cases) and the second in women (12.7% of all cancer cases) (Figure 1.1) [2], [3]. For the past 30 years, it has been registered an increase in incidence rate of CRC in Europe, North America, New Zealand and Australia and, a decrease in mortality rate specially in women [2], [4].
Figure 1.1 – Estimated new cancer cases worldwide in 2012 [1].
Colon cancer is a result of genetic predisposition and environmental factors consistent to developed countries lifestyle. In fact, it has been reported that a diet rich in red meat and saturated fat allied with low intake of fiber, calcium and vitamin D; obesity; sedentary lifestyle; and alcohol and tobacco consumption may lead to the development of this disease. Moreover, inflammatory diseases as Crohn’s disease and ulcerative colitis increase the probability of CRC development [5], [6]. Regarding genetic predisposition, inherited CRC syndromes have been described and some are well characterized both at clinical and molecular features. The most frequent syndromes are familiar adenomatous polyposis (FAP) and hereditary nonpolyposis colorectal cancer (HNPCC), which account for 1% and 5% of all CRC cases, respectively [7]. FAP is characterized by the presence of hundreds of adenomatous polyps distributed throughout the colon and its genetic cause is a dominant autosomal mutation at APC gene. Lynch syndrome accounts for a subset of HNPCC and is characterized by germinal mutations in DNA mismatch repair genes (mainly MLH1 and MSH2; rarely
syndrome (STK11), juvenile polyposis (SMAD4 and BMPR1A) and MUTYH-associated polyposis [7]– [9].
1.1.2. Location and characterization
Colon is a tubular organ with 1.5-1.8 m composed by 2 main portions: proximal (ascending and transverse colon) and distal (descending and sigmoid colon). It is connected to the anus through rectum [10]. Histologically, colon and rectum are constituted by: serosa (the thin out layer); muscularis mucosae, (responsible for the intestinal movements); submucosa (containing the nerves, blood vessels and connective tissue); and mucosa (closest to the lumen). The intestinal mucosa layer exhibits invaginations, known as crypts, which are comprised predominantly by differentiated cells (enterocytes, enteroendocrine cells and goblet cells) [11], [12]. In the bottom of the crypt is the stem cells niche, which are undifferentiated cells with self-renewal capacity and regulation of tissue repair and homeostasis. The division of these cells gives rise to progenitor cells that are capable of differentiating toward all epithelial lineages. Consequently, stem cells play a key role in regulating the maintenance of the normal colonic epithelium [12].
Colorectal carcinoma is characterized by the uncontrolled proliferation of epithelial tumor cells into the
muscularis mucosae layer [9]. CRC development can be summarized in the adenoma-carcinoma sequence, first proposed by Fearon et al.. In this sequence, the normal colorectal epithelium accumulates various genetic and epigenetic mutations that result in progression to an early adenoma and latter, to an invasive carcinoma. This is a multistage slow process, which evolves in 5-10 years. (Figure 1.2) [13].
Figure 1.2 – The adenoma-carcinoma sequence: main histological and molecular alterations in each stage of
sporadic colon cancer progression (adapted from [14]).
β-catenin accumulates in the nucleus, activating transcription of oncogenes as c-myc and cyclin D1, and promoting cellular proliferation [8], [15]. In the progression of early to late adenoma, an activation of oncogene KRAS (promoting proliferation and avoiding apoptosis) occurs followed by inactivation of TGF-β pathway genes, such as SMAD2, SMAD4 and the tumor suppressor DCC [16]. The next step in the transition from adenoma to carcinoma sequence, a bi-allelic inactivation of tumor suppressor
TP53 occurs [8], [16], [17].
1.1.3. Molecular pathways involved in carcinogenesis
Countless signaling pathways have been described to be involved in colon tumorigenesis and some of the genes involved in these pathways may be promising therapeutic targets [18]. The pathways referred in section 1.1.2 (Wnt, TFG-β, RAS and p53) are associated with an increased chromosomal instability characterized by LOH and chromosomal abnormalities [19]. The Wnt signaling pathway plays a key role in regulating the nuclear localization of β-catenin and maintaining the normal homeostasis in intestinal stem cells. When Wnt signaling is inactive (absence of Wnt ligand), the key effector, β-catenin is recruited by a protein complex (APC, AXIN and GSK3β) for ubiquitination and targeted for proteossomal degradation. By activating the pathway (either by presence of Wnt ligand, or mutation in the pathway genes), the protein complex cannot bind to β-catenin giving rise to a β-catenin cytoplasmic accumulation and migration into the nucleus. There, it will bind to TCF/LEF transcription factors, activating target genes transcription and increasing proliferation, differentiation, migration and adhesion of colonic cells [18], [19]. The alterations in the canonical Wnt signaling may occur in APC, AXIN2 and β-catenin proteins. In APC gene, molecular alterations resulting in functional loss or protein truncation drive constitutive activation of Wnt. AXIN2 is a negative Wnt regulator and a tumor suppressor gene. This gene is frequently mutated in sporadic CRC, contributing to Wnt negative feedback and to the disruption of β-catenin destruction complex [17], [18], [20]. Furthermore, mutations in CTNNB1 gene (encoding β-catenin) are known to block β-catenin ubiquitination and degradation. These mutations are found in approximately 48% of sporadic CRC without APC
mutation, which suggests that mutations in CTNNB1 may substitute APC mutations in early stage event of carcinogenesis [18], [19].
1.1.4. Metastasizing process
The metastatic spread of tumor cells is composed of several steps where cells acquired biochemical characteristics that enable them to escape from a primary site tumor to other place in the human body where they can proliferate giving rise to a metastatic tumor [23], [24]. Figure 1.3 elucidates the molecular mechanisms that underlie the metastatic process.
Figure 1.3 – Representative model of metastatic process: acquisition of genetic/epigenetic alterations (A);
epithelial-mesenchymal transition (B); intravasation to vascular circulation(C); extravasation and
mesenchymal-epithelial transition with angiogenesis originating a secondary tumor (D) (adapted from [23]).
Tumor cells can develop invasive and mesenchymal characteristics that facilitate tumor detachment and acquisition of a migratory capacity and plasticity. In the epithelial-to-mesenchymal transition (EMT) the capacity of cell-cell adhesion is lost, allowing tumor cells dissociation from the primary tumor and invasion of the surrounding extracellular matrix (ECM). EMT cells intravasate into the lumen of blood vessels invading the vascular basement membrane and extracellular matrix in the process of extravasation. Finally, these cells attach at a new location and re-initiate their proliferative programs at metastatic sites [23], [24]. In CRC, liver is the common site of metastasis, however the underlying cause of liver-specific metastasis of CRC is not yet well elucidated [24].
EMT is a biological process where the cell develops resistance to apoptosis, capacity to migrate and invade, and production of ECM components. In this process a polarized epithelial cell is transformed into a mesenchymal-like cell and, it is characterized by the degradation of the basement membrane where epithelial cells are attached. EMT is described as a transition phenomenon due to its reversibility – phenotypic plasticity allows mesenchymal cells conversion to epithelial. This is a normal process during embryogenesis and organ development (EMT type 1), although, it can be activated in the presence of inflammation (by wound healing and tissue repair – EMT type 2) and high-graded carcinomas (EMT type 3). In EMT type 3, tumor cells only progress once they can invade and metastasize, however, they may not lose all of the epithelial characteristics [23].
Table 1.1 – Classes of molecules involved in EMT [25].
Cell-cell adhesion Cadherins, Catenins
Cell-ECM adhesion Integrins, ECM proteins
Transcription factors Snail, SMAD LEF, Nuclear β-catenin
Growth factors TGF-β, Wnts
Extracellular proteases Matrix metalloproteinases
Cytoskeletal modulators Rho family
Wnt signaling pathway is involved not only in early stages but also in the invasive front of metastasis where the activation of Wnt signaling key effector, β-catenin, leads to the transcription of genes related to tumor aggressiveness, invasiveness, and migration [26]. Figure 1.4 shows the activation of genes responsible for i) cellular growth, ii) survival, dedifferentiation, migration and dissemination, iii) proteolysis and iv) stroma induction and angiogenesis, in response to Wnt activation [27].
Figure 1.4 – Gene expression induced by nuclear translocation of β-catenin and its influence on the metastasizing
process [27].
A crucial event in EMT is the loss of E-cadherin, the most important molecule for cell-cell adhesion, which is also regulated by β-catenin [26]. The expression of E-cadherin can be inhibited by inactivating mutations or transcriptional repression. For instance, Snail transcription factor, activated by RAS and TGF-β activated pathways [28], has been reported to repress E-cadherin transcription, being considered a EMT inducer [29]. In addition, Snail downregulates Muc-1 (epithelial mucin) and CK18 [28] and upregulates mesenchymal markers as Vimentin, fibronectin [30] and MMP-2 [31]. Another study also demonstrates the capacity of Snail to enhance invasive ability and immunosuppression accelerating EMT [32].
including TGF-β, Notch, Hedgehog, NF-κB, PI3K/Akt and RAS have been highlighted to have an important role in EMT process [33], [34].
1.1.5. The role of stem cells in colorectal carcinogenesis
Initially the stochastic model (Figure 1.5 A), predicted that any mutated cells could lead to proliferation and had the ability of developing a tumor [35]. Then, the cancer stem cells (CSCs) model arose (Figure 1.5 B), postulating the presence of a hierarchical structure within the tumor where cells with stemness properties and self-renewal capabilities are the responsible for tumor growth [36]. CSCs share properties with adult stem cells (section 1.1.2) as self-renewal, differentiation capacity, and homeostatic control [12]. Their role in carcinogenesis has been studied in the last years, and there are scientific evidences that this population of cell is the main responsible for tumor origin and relapse (as described in Figure 1.5).
Figure 1.5 – Representative models of carcinogenesis [37]. Stochastic model – cells with different phenotypes
origin tumors (A). CSCs model – cells with stemness capacity are the ones capable of tumor development (B).
CSCs model also explains the intratumoral heterogeneity originated by a single cell and, that tumor maintenance is due to the presence of stem-like niche [36]. This has been confirmed through the isolation of a subset of cells from colorectal tumors and consequent evaluation of the tumorigenic capacity when compared with the original tumor, where it was proved that CSCs are the ones with the ability of tumor growth [38]. Regardless of the concept, the microenvironment has an important role in tumor heterogeneity. Epigenetic alterations as DNA methylation, histone modifications and the presence of inflammation are the main factors for it [35].
Table 1.2 – Putative cancer stem cell markers.
Biomarkers Function References
CD44 Surface glycoprotein
Cell-cell and cell-ECM interactions Apoptosis resistance mediator
Hyaluronic acid receptor Dissemination [27], [39] CD133 Transmembrane glycoprotein Self-renewal Tumor angiogenesis (still unclear in normal mucosa)
[11], [40]
ALDH Isoenzyme
Oxidation of aldehydes Differentiation Self-protection
[41]
Lgr5 Membrane G-protein receptor
Wnt signaling mediator Not well defined in carcinogenesis [18], [19]
Several studies have reported tumorigenesis driven by cells positive for the biomolecules described in Table 1.2. CD44+ primary tumor cells showed a significantly high colony formation and proliferative index and, moreover, this population was responsible forincreasing the formation of tumor in vivo [39], [42]. Higher CD133 expression in CRC has been associated to tumor progression [43] specially in invasive front and metastasis [44]. Dalerba et al. described that the presence of CD133 associated with CD44+/EPCAMhigh/ALDH+ phenotype showed bigger tumor growth than in the isolated CD133+ cell niche [40]. Other studies confirmed CD44 as a better immature cell marker than CD133 once CD44+/CD133+ population showed higher tumorigenesis that CD44-/CD133+. However the use of both markers is important for the establishment of stemness-like niche [45], [46]. ALDH presence has been described in both normal and malignant colorectal cells and its activity increases during tumor progression. In fact, several studies revealed that increasing the number of ALDH+ cells in xenografts resulted in reduced tumor formation time and, that associating with CD44+ and/or CD133+ cells increases dramatically the tumor initiating abilities, giving rise to a tumor with a similar profile as the primary tumor [39], [47]. Finally, normal Lgr5 expression restricted to the crypt bottom is consistent with adult colon stem cells location. However, recent data observed an increasing expression of this marker in the upper zone of the colonic crypt during dysplasia, which confirmed it as an invasive cell population. Although its role at carcinogenesis is not yet well defined, Lgr5overexpression has been not only associated with early stages of tumorigenesis [48] but also with invasiveness and metastasis [49], and thus considered as a potential CSC marker.
1.1.6. Cancer treatment and chemoprevention
The majority of CRC cases are diagnosed in a stage of advanced disease (metastatic CRC), which decreases the effectiveness of treatment and consequently the survival rate. In an early stage CRC, the survival chance is around five years and it drops dramatically to two years survival in metastatic CRC [50]. Surgery remains the only curative treatment for CRC patients, associated with the standard treatments of radio and/or chemotherapy (5-fluorouracil and leucovorin, oxaliplatin, capecitabine or irinotecan) [51]. However, metastatic CRC is generally resistant to conventional therapies [50]. In CRC with liver metastasis, the combination of three drugs (5-fluorouracil, leucovorin and oxaliplatin, also known as FOLFOX) is commonly used. Other combinations between the five drugs are also possible. The combination of 5-fluorouracil, leucovorin and irinotecan (FOLFIRI) is also applied, particularly in younger patients where shows more effectiveness. The complementation of neoadjuvant chemotherapy with antiangiogenic drugs (bevacizumab and ramucirumab) and anti-EGFR therapy (cetuximab and panitumumab) is also common [11], [51]. Therapies for primary and metastatic tumors are different, which highlights the theory that metastatic cells have a more aggressive phenotype [37]. The existence of therapeutic resistance shows that tumor biology in not yet fully understood. Most of the tumor cells are not sensitive to these treatments, leading to the possibility of tumor relapse. Chemo- and radioresistance of the tumor can be explained by the presence of CSCs, due to their plasticity. Conventional treatments may not have effect on them which results in tumor relapse. Considering the CSC model for carcinogenesis (section 1.1.5), the target goal for therapy must be this cellular population in order to prevent relapse and metastasis (Figure1.6). Therefore, more effective and specific therapeutic treatments should be developed. Identifying new molecular markers and therapeutical targets in CSCs have been highlighted as a future and promising approach for CRC treatment [50].
Figure 1.6 – Representative model of a novel approach on cancer treatment: CSCs have the ability of
self-renewal and resistance to death allowing tumor relapse after treatment, which make them the most promising
candidate for a therapy [37].
-catenin) a monoclonal antibody therapy can be developed. Inhibiting these molecules, the cell signaling will be compromised and a decrease of resistance, tumor size or metastatic potential may occur [12], [52].
Interfering with signaling cascades may be a more difficult method since these pathways also have an important role in normal colorectal cells, which can affect organ development and body homeostasis. Some inhibitors of Wnt signaling have already been developed. Although none was effective, some compounds have chemopreventive effect by inhibiting the cascade: NSAIDS (like aspirin) and vitamins (A and D). These interfere mainly with β-catenin/TCF/LEF complex.[53].
Since EMT is a major step in enabling the metastatic tumor development, this is a good target for therapy. Treatments inducing cell differentiation or disruption of this process force CSCs to acquire a mature phenotype losing their self-renewal abilities and, consequently be more fragile for elimination through the traditional chemo- or radiotherapies. These treatments include: alteration of survival pathways, epigenetic therapy and microRNAs. Moreover, the microenvironment is fundamental for tumor growth especially for CSCs maintenance originating an interesting approach too [12]. An example is salinomycin, a potassium ionophore capable of inducing terminal differentiation of CD44+ CSCs, thus avoiding EMT and metastasis [11].
Combination of treatments that act in different targets can give better and quick results in tumor regression. With the advances on the understanding of cancer biology, it has been discovered new mechanisms in cancer cells that may be helpful to act as therapeutical targets, as summarized in Figure 1.7 [54].
1.2.
Natural compounds and CRC
1.2.1. Phytochemicals
For the last ten years, the ingestion of natural products has been increasing worldwide with the aim to promote wellness and prevent and treat diseases. Thus, natural products have been started to be seen has chemopreventive agents, acting in all stages of carcinogenesis. These can include nutrients, vitamins, minerals, herbal medicines, probiotics, and bioactive food components. The last category has been emerging for the last years. Bioactive compounds occur naturally in low quantities in plant-derived food like fruits, vegetables and grains. The main characteristics are the association as non-essential compounds to human dietary, not causing deficiency syndromes and reducing the risk of chronic diseases as cardiovascular disease and cancer [58]. Due to their chemical structure, phytochemicals can be classified as phenolics, carotenoids, alkaloids, nitrogen-containing compounds, organosulfur, and phytosterols [59].
Phenolic compounds are the most studied class of phytochemicals. They are easily found in berries, pomegranate, plum, red grape, apple, spinach, broccoli and beets, as a secondary metabolite and being responsible for fruit color and defense mechanisms against pathogens, predators, UV-radiation, they are mainly located in the peel of these fruits/vegetables [58]. Subclassification of phenolics is shown in the Figure 1.8 and, it is based on quantity of aromatic rings in their chemical structure in association with one or more hydroxyl groups (-OH) [60]. Flavonoids are the larger category of phenolic compounds, and more than 4000 molecules are already reported. Their structures have two aromatic rings linked by three carbons from a heterocycle ring and, it is the differences in this heterocycle ring than provides different types of flavonoids (Appendix A). Flavonoids can be found in nature associated with glycosylated or esterified complexes but also in a aglycosylated form [58].
Figure 1.8 – Classification of phenolic compounds according with Liu et al. [61].
Table 1.3 – Main mechanisms of chemoprevention by flavonoids in multistage carcinogenesis [59], [61], [62].
Properties Mechanisms of action
Antioxidant
Scavenge superoxide, hydroxy, and proxy-radicals
ê Carcinogens cellular uptake ê DNA oxidation and damage
Anticancer
é DNA repair é Cell differentiation é Tumor suppressor genes é Cell-cycle arrest and apoptosis
ê Cell proliferation ê Oncogene expression ê Transduction pathways
(NF-κB, MAPK, Wnt) ê Enzyme metabolism
(COX-2, telomerase) ê Angiogenesis
In the context of CRC, innumerous phenolic compounds have been reported by their effect. They have the special ability to interfere with Wnt signaling pathway: modulation of ligand-receptor interaction, expression of Wnt inhibitor gene (wif-1), inhibition of cytoplasmic β-catenin and β-catenin/TCF/LEF complex, reduction of nuclear β-catenin levels [63]. Some flavonoids studied in CRC field are quercetin, luteolin, apigenin, EGCG, isoquercitrin, genistein, and kaempferol [63]. These compounds are mainly found in fruit and plants [58], thus, a selective extraction of phytochemicals, might be a good strategy to originate a fruit/plant extract with high anticancer potential. Extracts from oranges, pomegranate, cherries, bamboo and tea leaves have already been reported with potential affects on carcinogenesis [64]–[69].
1.2.2. Phytochemicals from citrus
Citrus production is the bigger in fruit section worldwide, where only 34% of the fruit is processed into juice leaving a large amount of by-products, namely orange peels [70]. It is a large residue existing on agriculture that can get a new added value in industry due to its chemical and biological characteristics. The main phytochemicals present in oranges are mostly located in the peels and include flavonoids (polymethoxylated flavones), terpenoids (limonene and linalool) and volatile oils. Polymethoxylated flavones (PMFs) are particular flavonoids of interest due to their range of biological activities including anti-inflammation, anticancer, cardiovascular (antithrombotic and antiatherogenic), antipathogenic and antioxidant [69], [71]. Comparing to polyhydroxylated flavonoids (e.g. narigin, luteolin, quercetin), PMFs are more lipophilic due to the hydrophobic nature of the methoxy groups giving these compounds the ability of easy absorption in the small intestine to blood circulation [69]. The high permeability and low solubility of PMF contributes to its potential for excellent bioavailability [72].
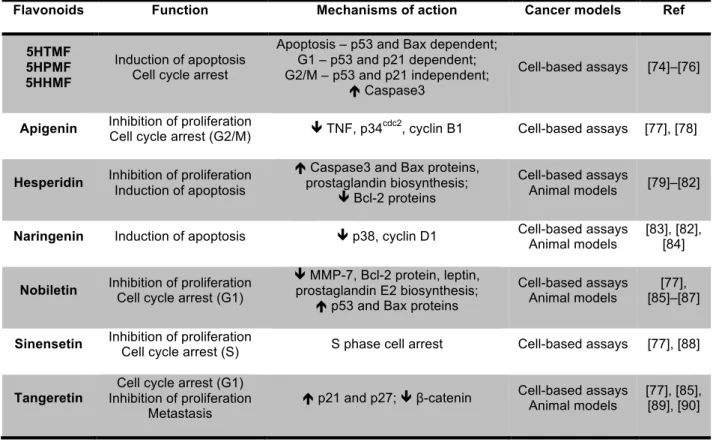
prostate, lung, liver and breast [73]. In vitro studies also reported the antiproliferative e anticancer effect of PMFs in a large spectrum of cancer cell lines [74]. From all PMFs, tangeretin and nobiletin are reported as the most promising inhibitors of cancer cell proliferation [74]. The Table 1.4 summarizes some studies that have already reported the anticancer property of citrus flavonoids particularly in CRC.
Table 1.4 – Most common citrus flavonoids and its effect at CRC.
Recently, studies reported that metabolites resulting of biotransformation of PMFs, specially from nobiletin and tangeretin, had higher anticancer and anti-inflammatory effects than original PMFs [91]. Using mice models fed with PMFs, PMFs metabolites from fecal and urine samples were identified, presenting these compounds a strong inhibitory effect on colon cancer cell growth than the original PMFs [91], [92].
It is important to mention that although the high anticancer potential of PMFs, there is no information regarding to the effect of citrus PMFs and its metabolites in CSCs niche.
Flavonoids Function Mechanisms of action Cancer models Ref
5HTMF 5HPMF 5HHMF
Induction of apoptosis Cell cycle arrest
Apoptosis – p53 and Bax dependent; G1 – p53 and p21 dependent; G2/M – p53 and p21 independent;
é Caspase3
Cell-based assays [74]–[76]
Apigenin Inhibition of proliferation
Cell cycle arrest (G2/M) ê TNF, p34
cdc2
, cyclin B1 Cell-based assays [77], [78]
Hesperidin Inhibition of proliferation Induction of apoptosis
é Caspase3 and Bax proteins, prostaglandin biosynthesis;
ê Bcl-2 proteins
Cell-based assays
Animal models [79]–[82]
Naringenin Induction of apoptosis ê p38, cyclin D1 Cell-based assays Animal models
[83], [82], [84]
Nobiletin Inhibition of proliferation Cell cycle arrest (G1)
ê MMP-7, Bcl-2 protein, leptin, prostaglandin E2 biosynthesis;
é p53 and Bax proteins
Cell-based assays Animal models
[77], [85]–[87]
Sinensetin Inhibition of proliferation
Cell cycle arrest (S) S phase cell arrest Cell-based assays [77], [88]
Tangeretin
Cell cycle arrest (G1) Inhibition of proliferation
Metastasis
é p21 and p27; ê β-catenin Cell-based assays Animal models
1.3.
Cancer models
According to FDA, there are five steps to follow in drug development process: i) discovery and development; ii) preclinical research; iii) clinical research (phases I, II, III and IV); iv) FDA review and; v) FDA post-market safety monitoring. Once clinical research, the so called clinical trials, refers to the studies performed in humans, it is important to first test the safety/toxicity and the dosage of the drugs in preclinical research. This is evaluated using in vivo (animal models) and in vitro (cellular models – 2D and 3D) approaches [93].
To better understand the effect of drug in cancer it is important to choose an appropriate model that better mimics the real situation. [94] Succinctly, animal models (usually mice) relies in chemically induced animals, genetically engineered mouse models (GEMM) and xenografts (patient-derived or not). Despite closely resembling human tumorigenesis, these animal models present some disadvantages namely a immune system suppression that may alter the normal tumor behavior, tumor-time development, relation cost-effectiveness, and ethical issues related [95]. Conventional 2D models consist of a monolayer of a specific cell line growing on a solid, impermeable and adherent surface of a culture flask, which appears to be a poor model to study the complexity of tumor-stroma interactions, tumor heterogeneity and key signaling pathways. However, cellular monolayers are still largely used for screening cytotoxicity. During the last years, three-dimensional (3D) models bypassed some disadvantages of monolayer models and are being recognized as valuable tools to evaluate the anticancer potential of new therapy drugs. These models have became more precise in predicting drug efficacy in primary tumors once they are more informative than the conventional 2D models [94].
1.3.1. Characteristics of 3D cellular models
Figure 1.9 – Spheroid organizational architecture and components distribution. CO2 and waste metabolites tend
to increase from the outer to the center of the spheroid. The O2, nutrients and growth factor disposition tends to
be reverse [98].
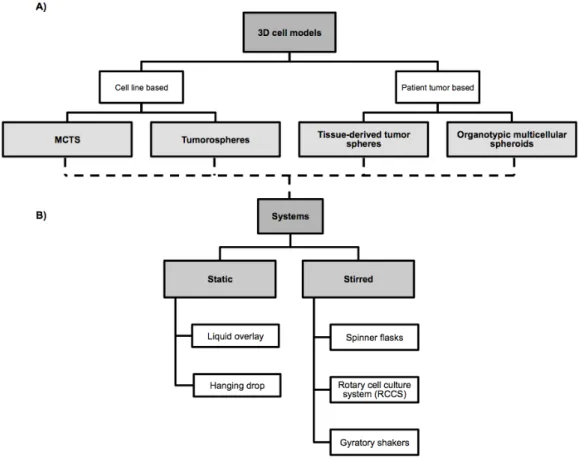
Up to date, several 3D models were created including multicellular tumor spheroids (MCTS), tumorospheres, tissue-derived tumor spheres and organotypic multicellular spheroids. The main differences between all are related to the cells of origin and the preparation protocol [96]. Figure 1.10 summarizes the classification of 3D models and systems that are being used for their production.
Figure 1.10 – Types of three-dimensional cell models based on cells of origin (A) and type of system that can be
used for spheroids culture (B).
and stirred systems (spheroids forming in suspension) [96]. The liquid overlay cultures require adhesive forces promoting cell adhesion and thus, avoiding matrix deposition. Normally, it is used agar/agarose/Matrigel®-based media that promotes cell migration to a single place where by cell-cell interactions the spheroids obtained tend to grow and increase their sizes during culture time (Figure 1.11 A) [99], [100]. Additionally, another method was developed, which does not require a non-attachment surface – the hanging drop method (Figure 1.11 B). This promotes tumor spherical aggregation through a deposit of cellular suspension in a free liquid-air interface [101].
Opposite to static methodologies, in stirred systems it is possible to obtain large-scale production of spheroids. They are the most common system for culturing MCTS and include three types: spinner flasks, rotary cell culture system (RCCS) and gyratory shakers. Spinner flasks were the first method of culturing MCTS (Figure 1.11 C) [102]. Spheroids harvested have a uniform size and diameter dependent of the inoculum density, medium composition, stirring rate and culture time. The main concern about this system is the strong shear rate hit by the spinner that may influence cells physiology [98], [103]. To overcome this problem, RCCS were created by NASA. It is the best revolutionary system in tissue engineering. Also, it is capable of simulate microgravity and mixes the cellular suspension using hydrodynamic forces diminishing the turbulence comparing to spinner flasks (Figure 1.11 D). Thus, using low shear forces the obtained spheroids have larger sizes and bigger differentiation of morphology and phenotype. The use of multiple types of cell lines is also possible using scaffolds, mainly microcarrier beads [100], [104]–[106]. Gyratory shakers are very similar to spinner flasks differing only in the origin of stirring. Cellular inoculum is added to a Erlenmeyer that rotate not by magnetic stirring but by a gyratory rotation incubator [100].
Additionally, bioreactors can be combined with scaffolds (Figure 1.11 E) [107]. Scaffold systems use microcapsules of cellulose-based membranes that are easily disrupted by enzymatic reactions. Collagen/alginate-based membranes, synthetic polymers, or hydrogels shells can be also used [100], [108], [109]. Scaffolds of microcarrier beads are innovative tools in 3D models. It does not required spontaneous cellular aggregation but it is a vehicle for adhesion promotion. The pioneer advantage relies on the possibility of growing different cell lines close to each other (as tumor, endothelial and stromal cells), promoting a tumor environment similar to in vivo. The beads are generally use in bioreactors [100], [104], [110].
Figure 1.11 – Main systems use for 3D cell culture: liquid overlay (A); hanging drop (B); spinner flask (C); rotary
Tumorospheres are models of CSC culture and expansion derived from cell lines or rarely through the dissociated cancer tissue into a cellular suspension [96]. On this cellular suspension, cells with stemness phenotype (section 1.1.5) can be isolated. For sphere formation, cells are cultured in low density and low-adherent conditions with “stem cell medium” – absence of fetal bovine serum and supplemented with growth factors that promote stem cell growth – hence, avoiding cellular aggregation and promoting the development of the spheroid from one single cell [96], [111]. Tumorospheres were firstly described using brain tumor cells, and thus classified as neurospheres [111], and there has been a development of tumorospheres from a wide range of solid tumors including breast (mammospheres [112]), colon (colospheres [43] or colonospheres), lung, prostate, ovarian and pancreas [96]. This spheres can be cultured in static or stirred systems [113]. In addition, tissue-derived tumor spheres and organotypic multicellular spheroids use cancer tissue and not cell lines for culturing. In the first case, the tumor is partially dissociated and the new spheroids are normally formed using static systems and suspension systems with “stem cell medium” [114], [115]. The organotypic multicellular spheroids require culturing ex vivo fragments of the tumors until they reach a circular form using non-adherent surface systems, normally in agar-based media. The spheroids tend to grow in 2-5 or 12-18 days [96], [116].
In terms of conclusion, 3D models are the next generation for tumor biology studies since they can accurately behave as the parental tissue. Invasive behavior, tumor-stromal interactions, tumor heterogeneity are the main factors that originate a realistic model. For cancer models, scaffolds and bioreactors are the systems that better improve the diversity and capacity of the culture [103], [106]. However, it is important to mention that all the models have their advantages and disadvantages (summarized in Table 1.5) and the most adequate system must be chosen according to the aim of the study [96], [98], [100].
Table 1.5 – Advantages and disadvantages of culture systems [98], [100].
Advantages Disadvantages
Static Systems
Cheap Simple to perform Rapid and easy to screening
Small-scale production Spheroid size and shape not controlled (only in
liquid overlay)
Stirred Systems
Large-scale production Simple to culture Better cell differentiation
Better cell morphology Dynamism in culture conditions
Specific equipment required
Large amount of reagents required (medium) Spheroid size and number not controlled Cell sensitivity to shear forces (only in spinner
1.3.2. 3D cell models for colorectal cancer
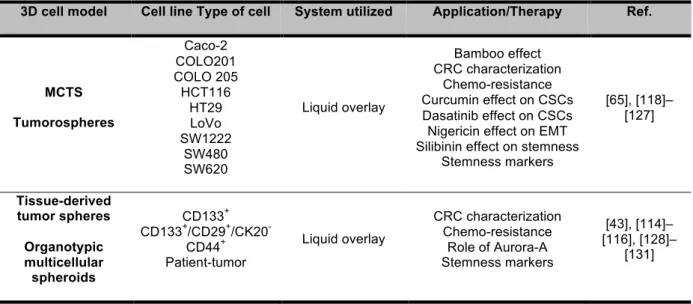
In CRC, 3D models have been used not only for studying tumor biology in terms of development, invasiveness and migration, but also to evaluate the effect of drugs and natural extracts. The models are based both in tumor-patient derived cells and cell lines.
There are more than 70 colorectal cancer cell lines described, that represent different types of primary CRC, according to their genetic background. The most frequent cell lines used are: Caco-2, COLO 320, LoVo, HCT15, HCT116, HT29, SW48, and SW480 [117]. Up to now, most of the CRC studies that applied 3D cell model used non-adherent surfaces systems based mostly in ultra-low attachment plates, agar-coated plates and hanging drop method (Table 1.6).
Table 1.6 – Resume of recent work using CRC spheroids for study whether tumor biology or effect of compounds.
3D cell model Cell line Type of cell System utilized Application/Therapy Ref.
MCTS Tumorospheres Caco-2 COLO201 COLO 205 HCT116 HT29 LoVo SW1222 SW480 SW620 Liquid overlay Bamboo effect CRC characterization Chemo-resistance Curcumin effect on CSCs Dasatinib effect on CSCs Nigericin effect on EMT Silibinin effect on stemness
Stemness markers [65], [118]– [127] Tissue-derived tumor spheres Organotypic multicellular spheroids CD133+ CD133+/CD29+/CK20
-CD44+ Patient-tumor
Liquid overlay
CRC characterization Chemo-resistance
Role of Aurora-A Stemness markers
[43], [114]– [116], [128]–
[131]
1.3.3. HT29 cell line-derived spheroids
During the last years, the host laboratory (Nutraceuticals & Delivery Group of iBET – Oeiras, Portugal) has been collaborating with Animal Cell Technology Unit of iBET (Oeiras, Portugal) aiming at developing MCTS of CRC cell lines that can be used as a pre-clinical model for the evaluation of new natural compounds with chemotherapeutic potential [88], [132], [133]. More specifically, this model was produced by culturing HT29 cell line under stirred conditions using bioreactors (spinner vessels). HT29 cell spheroids culturing has been only reported in static systems where it forms a spherical-shape aggregate when comparing to other colon cancer cell lines [134].
heterogenic population. From day 2 to day 3 of culture, spheroid density decreases, spheroid diameter remains and cellular concentration increases, suggesting spheroid fusion – compaction phase. From day 3 onwards the number of spheroids stabilized and there is only an increase of size during the time of culture corresponding to growth phase [132].
At day 7 of culture the spheroids acquire a stratified population (section 1.3.1, Figure 1.9) with a compacted cellular layer at the periphery and less cellular compaction at the center of the spheroids. This compaction is correlated with the increasing of cell-cell adhesion marker E-cadherin at the periphery of spheroids. Another epithelial marker is CK18, which detection is lost along the culture time. The apoptotic/necrotic region described in 3D models is also present in HT29 cell spheroids by the loss of f-actin and the presence of cleaved CK18 at the spheroid center. The loss of central E-cadherin and CK18, the presence of nuclear β-catenin and expression of Vimentin at day 12 of culture was identified in these spheroids suggesting a dedifferentiation process associated with invasiveness and possible EMT (section 1.1.4). Moreover, this HT29 cell aggragates present a positive staining of CD44 for both monolayer and spheroids confirming the presence of stemness profile in colon cancer [88], [132], [133]. Figure 1.12 shows some of the immunofluorescence staining performed with HT29 spheroids collected at different days of culture and it can be seen a well-stratified population with the presence of an apoptotic/necrotic core simulating in vivo tumor progression and phenotypes. However, further biomarkers should be analyzed aiming the characterization of this model in terms of stemness and self-renewal abilities and evaluate if it can be considered as a promising tool to evaluate the effect of new compounds on targeting CSC population.
Figure 1.12 – Immunofluorescence markers use for characterization of HT29 cell spheroids cultured by stirred
1.4.
Aim of the Thesis
Even though there are studies reporting the anticancer potential of citrus bioactive compounds on human cancer cells, there is no information regarding their activity on CSCs. As described above, CSCs have been recognized to be responsible for tumor initiation, chemo-resistance and relapse being considered a promising target for cancer prevention and therapy. Within this context, the aim of this thesis was to evaluate if PMFs derived from orange peels were able to target CSCs using a 3D model of colorectal cancer. The work was organized in three main steps as described in Figure 1.13.
Figure 1.13 – Work plan for the present thesis organized in three main tasks.
In the first part of this project, phytochemical-rich extracts derived from orange peels and produced by supercritical fluid technology were screened and characterized in terms of PMF composition and antiproliferative effect using HT29 cell line. The aim was to identify the PMFs responsible for the bioactive effect and to evaluate the interactions between all the main components of orange peel extract.
In the second part of this thesis, the 3D cell model already developed by the host laboratory using HT29 cell line cultured in stirred conditions was characterized for CSCs population. More specifically, HT29 cell spheroids collected at different time points were subjected to a phenotypic characterization and gene expression evaluation in order to analyze the stemness and self-renewal characteristics of the 3D cell model.
Finally, the most promising extract selected from Part 1 was tested on HT29 aggregates characterized in Part 2 in order to evaluate the effect of citrus bioactive compounds in i) inhibiting cell proliferation and ii) targeting key signaling pathways related to stemness and self-renewal characteristics of CSCs population in this 3D cell model.
![Figure 1.2 – The adenoma-carcinoma sequence: main histological and molecular alterations in each stage of sporadic colon cancer progression (adapted from [14])](https://thumb-eu.123doks.com/thumbv2/123dok_br/16472948.731783/24.892.168.729.759.969/figure-carcinoma-sequence-histological-molecular-alterations-sporadic-progression.webp)
![Figure 1.4 – Gene expression induced by nuclear translocation of β-catenin and its influence on the metastasizing process [27]](https://thumb-eu.123doks.com/thumbv2/123dok_br/16472948.731783/27.892.232.668.520.758/figure-expression-induced-nuclear-translocation-catenin-influence-metastasizing.webp)
![Figure 1.7 – Therapeutic targets of Hallmarks of cancer [54].](https://thumb-eu.123doks.com/thumbv2/123dok_br/16472948.731783/31.892.189.716.705.1099/figure-therapeutic-targets-hallmarks-cancer.webp)
![Figure 1.8 – Classification of phenolic compounds according with Liu et al. [61].](https://thumb-eu.123doks.com/thumbv2/123dok_br/16472948.731783/33.892.116.797.759.1021/figure-classification-phenolic-compounds-according-liu-et-al.webp)
![Table 1.3 – Main mechanisms of chemoprevention by flavonoids in multistage carcinogenesis [59], [61], [62]](https://thumb-eu.123doks.com/thumbv2/123dok_br/16472948.731783/34.892.108.776.144.370/table-main-mechanisms-chemoprevention-flavonoids-multistage-carcinogenesis.webp)
![Table 1.5 – Advantages and disadvantages of culture systems [98], [100].](https://thumb-eu.123doks.com/thumbv2/123dok_br/16472948.731783/39.892.105.798.769.977/table-advantages-disadvantages-culture-systems.webp)
![Figure 1.12 – Immunofluorescence markers use for characterization of HT29 cell spheroids cultured by stirred system [132]](https://thumb-eu.123doks.com/thumbv2/123dok_br/16472948.731783/41.892.122.770.657.1047/figure-immunofluorescence-markers-characterization-cell-spheroids-cultured-stirred.webp)
