Molecular Determinants of Ligand
Specificity in Carbohydrate-Binding
Modules: an NMR and X-ray
crystallography integrated study
Dissertação para obtenção do Grau de Doutor em Bioquímica – Ramo Bioquímica Estrutural
Orientador: Eurico José da Silva Cabrita, Professor Auxiliar da Faculdade de Ciências e Tecnologia da Universidade Nova de Lisboa Co-orientadores: Maria dos Anjos Lopez de Macedo, Professora Auxiliar da
Faculdade de Ciências e Tecnologia da Universidade Nova de Lisboa
Ana Luísa Moreira de Carvalho, Investigadora Auxiliar do Laboratório Associado Requimte - Faculdade de Ciências e Tecnologia da Universidade Nova de Lisboa
Júri:
Presidente: Prof. Doutora Ana Isabel Nobre Martins Aguiar Oliveira Ricardo Arguentes: Prof. Doutor Jesús Jiménez Barbero
Prof. Doutor Shabir Husein Najmudin Vogais: Prof. Doutor Marta Bruix Bayés
Prof. Doutor Carlos Mendes Godinho de Andrade Fontes Prof. Doutora Maria João Lobo de Reis Madeira Crispim Romão
Molecular determinants of ligand specificity in carbohydrate-binding modules: an NMR
and X-ray crystallography integrated study
Copyright 2012 Aldino José Martins Viegas
Acknowledgements
I’d like to start by acknowledging and expressing my gratitude to my supervisors Prof. Eurico Cabrita, Prof. Maria dos Anjos Lopes Macedo and Dr Ana Luísa Carvalho, for allowing me to carry out my PhD in their groups, for providing me all the conditions for a successful work and, above all, for their friendship.
To Prof. Maria João Romão for taking me in her laboratory and proving me with all the conditions for the development of my work.
To Faculdade de Ciências e Tecnologia da Universidade Nova de Lisboa and Associate Laboratory REQUIMTE for providing the resources that allowed me to carry out my work.
To Prof. Carlos Fontes and Prof. José Prates of Faculdade de Medicina Veterinária da Universidade Técnica de Lisboa for letting me use their laboratory and expertise for all the molecular biology-related work and for all the assistance provided.
To my colleges Dr Marta Corvo, Dr Maria Manuel Marques, Dr Rui Almeida, Filipe Freire, Dr Cristiano Mota and, most recently Dr Filipa Marcelo, Dr João Sardinha and Dr Ângelo Figueiredo for all the good times, all the discussions, all the help... Thank you!
To all of my colleges from the Xtal group for helping me whenever I needed, for the very useful discussions and for your friendship.
To Dr Marta Bruix from IQFR, CSIC, Madrid, for her help in several aspects and, above all, for her affection and always good humor.
To Fundação para a Ciência e Tecnologia for funding and support, through grant SFRH/BD/35992/2007, and projects PTDC/QUI/68286/2006, PTDC/QUI-BIQ/100359/2008 andPTDC/BIA-PRO/103980/2008.
To the Portuguese Nuclear Magnetic Resonance Network for funding and support.
To my beloved family without whom I wouldn’t be here. Thank you for all your support and unconditional love.
Resumo
A degradação da parede celular vegetal por parte de microrganismos é um dos processos mais importantes para a renovação do dióxido de carbono atmosférico. O trabalho apresentado nesta tese aborda os celulossomas de Clostridium thermocellum e Bacteroides cellulosolvens,
essenciais para o processo de degradação da celulose, e visa o estudo de alguns dos componentes envolvidos na sua arquitetura (coesinas e doquerinas) e eficiência (Carbohydrate-Binding Modules - CBMs). Para isso utilizei uma combinação de técnicas de Ressonância Magnética Nuclear (RMN), cristalografia de raios-X e modelação computacional. O meu objetivo era contribuir para a racionalização dos determinantes moleculares de especificidade de CBMs, nomeadamente os CtCBM das famílias 11, 30 e 44, e dos mecanismos de
reconhecimento molecular entre coesinas e doquerinas. No capítulo I faço uma introdução geral ao tema da degradação da parede celular vegetal com especial atenção ao celulossoma e aos seus componentes. No capítulo II discuto as características estruturais do CtCBM11 tendo como
base estruturas obtidas por RMN a 25 e a 50 ºC e a estrutura obtida por cristalografia. Os resultados mostram que as estruturas apesar de semelhantes, apresentam algumas diferenças, nomeadamente no que respeita à área do sítio de ligação, o que explica os resultados negativos obtidos por co-cristalização. Nos capítulos III e IV descrevo o estudo acerca dos determinantes moleculares de especificidade dos módulos CtCBM11, 30 e 44, com base em estudos de RMN e
de modelação computacional. Observei que os átomos de celo-oligossacarídeos mais importantes para a ligação a estes módulos estão nas posições 6 e 2 das unidades centrais dos ligandos. Caracterizei também os mecanismos responsáveis pela seleção e ligação destes módulos aos vários substratos. Verifiquei que a ligação ocorre por um mecanismo de seleção conformacional onde a disposição dos resíduos da proteína, a conformação do ligando e o número de unidades de glucose, desempenham um papel fundamental. Os capítulos V e VI dizem respeito à determinação da estrutura 3D dos complexos coesina-módulo X-doquerina de
C. thermocellum e coesina-doquerina de B. cellulosolvens, respetivamente. Ambos os
complexos pertencem ao tipo II e a sua análise permitiu extrair informações importantes acerca das características estruturais que definem a interação coesina-doquerina. A estrutura de C. thermocellum revelou que o módulo X é fundamental para a estabilidade do complexo. Por
outro lado, foi a primeira vez que foi determinada a estrutura 3D de um complexo coesina-doquerina de B. cellulosolvens. Neste complexo a doquerina aparece rodada 180º quando
comparada com outros complexos. Esta característica confere plasticidade ao celulossoma. Nos capítulos finais apresento as técnicas de RMN e cristalografia de raios-X que utilizei ao longo do trabalho. Por fim apresento algumas conclusões gerais sobre todo o trabalho realizado.
Abstract
The microbial plant cell wall degradation is one of the most important processes in the global turnover of atmospheric carbon dioxide. The work presented in this thesis addressed the cellulosomes of Clostridium thermocellum and Bacteroides cellulosolvens, essential to the
process of cellulose degradation, and aimed to study some of the components involved in their architecture (cohesins and dockerins) and efficiency (Carbohydrate-Binding Modules - CBMs). For this I used a combination of Nuclear Magnetic Resonance (NMR), X-ray crystallography and computer modeling techniques. My objective was to help rationalize the molecular determinants of specificity of CBMs, including the CtCBMs of families 11, 30 and 44, and the
mechanisms of molecular recognition between cohesins and dockerins. In Chapter I, I present a general introduction to the theme of degradation of plant cell walls, with special attention to the cellulosome and its components. In Chapter II, I discuss the structural characteristics of the
CtCBM11 based on the structures obtained by NMR at 25 and 50 °C and the structure obtained
by crystallography. I found that although similar, the structures show some differences, particularly regarding the binding cleft area, which explains the negative results obtained by co-crystallization. In Chapter III and IV I study the molecular determinants of specificity in modules CtCBM11, 30 and 44, based on NMR and computer modeling data. I found that the
atoms of the cellooligosaccharides most important for binding are the ones at positions 2 and 6 of the central units of the ligands. Moreover, I characterized the mechanisms responsible for selection and binding of these modules to various substrates. I established that binding occurs by a mechanism for conformational selection, where the topology of the residues of the protein, the conformation of the ligand and the number of glucose units, play a fundamental role. Chapters V and VI reveal the determination of the 3D structure of the cohesin-module X-dockerin complex of C. thermocellum and the cohesin-dockerin complex of B. cellulosolvens,
respectively. Both complexes belong to the type II and their analysis allowed obtaining important information about the structural features that define the cohesin-dockerin interaction. The structure belonging to C. thermocellum revealed that the module X is essential for the
stability of the complex. Moreover, for the first time the 3D structure of a cohesin-dockerin complex from B. cellulosolvens was determined. In this complex the dockerin is rotated 180º
when compared to other complexes. This gives the cellulosome plasticity. In the final chapters, I present the NMR and X-ray crystallography techniques I used throughout the study. Finally, I draw some general conclusions about all the work done.
Table of Contents
Acknowledgements ... i
Resumo ... iii
Abstract ... v
Table of Contents ... vii
List of Figures ... xvii
List of Tables ... xxiii
Nomenclature ... xxv
CHAPTER I INTRODUCTION - THE IMPORTANCE OF THE RESEARCH ... 1
Summary ... 3
I.1 Introduction ... 3
I.2 The plant cell wall ... 6
I.2.1 Cellulose ... 7
I.2.2 Xyloglucan ... 8
I.3 Plant cell wall hydrolysis ... 9
I.3.1 Enzymatic hydrolysis: The cellulosome ... 10
I.4 The cellulosome of Clostridiumthermocellum: architecture and function . 14 I.5 The cohesin-dockerin interaction ... 17
I.6 Carbohydrate-binding modules ... 19
I.6.1 Nomenclature of CBMs ... 21
I.6.1.1 Type A CBMs – surface-binding ... 24
I.6.1.2 Type B CBMs – glycan-chain-binding ... 24
I.6.1.3 Type C CBMs – small sugar-binding ... 25
I.6.2 Molecular determinants of binding ... 25
I.6.3 Utilization of CBMs ... 27
I.8 References ... 30
CHAPTER II STRUCTURE OF THE FAMILY 11 CARBOHYDRATE-BINDING MODULE FROM CLOSTRIDIUM THERMOCELLUM (CTCBM11) ... 37
Summary ... 39
II.1 Introduction ... 40
II.2 Results and Discussion ... 42
II.2.1 Structure of CtCBM11 ... 42
II.2.1.1 The crystal structure of CtCBM11 without the histidine tail 42 II.2.1.2 The solution structure of CtCBM11 ... 45
II.2.1.3 Comparison between the X-ray and NMR structures ... 47
II.3 Conclusions ... 48
II.4 Materials and methods ... 49
II.4.2 Molecular biology ... 49
II.4.2.1 Recombinant protein production ... 49
II.4.2.2 Double labeled (13C and 15N) protein expression and purification ... 49
II.4.3 X-ray crystallography ... 52
II.4.3.1 Protein crystallization and data collection ... 52
II.4.3.2 Phasing, model building and refinement ... 53
II.4.4 NMR spectroscopy ... 53
II.4.4.1 Data acquisition ... 53
II.4.4.2 Resonance assignment and structure calculation ... 54
II.4.4.2.1 Resonance assignment ... 54
II.4.4.2.2 Structure calculation ... 55
II.4.4.2.3 Structure validation ... 56
CHAPTER III MOLECULAR DETERMINANTS OF LIGAND SPECIFICITY IN
CTCBM11 ... 61
Summary ... 64
III.1 Introduction ... 65
III.2 Results and Discussion ... 68
III.2.1 Characterization of the sugars ... 68
III.2.2 Molecular determinants of ligand specificity ... 72
III.2.2.1 Co-crystallization studies ... 73
III.2.2.2 Influence of calcium in the structure of cellohexaose ... 73
III.2.2.3 Linebroadening studies ... 74
III.2.2.4 Saturation-transfer difference NMR (STD-NMR) ... 75
III.2.2.5 Diffusion studies (DOSY) ... 82
III.2.2.6 Interaction studies with cellooligosaccharides ... 83
III.2.2.7 Computational studies ... 86
III.4.4.2.1 Docking experiments with the crystallographic structure ... 87
III.4.4.2.1 Docking experiments with the NMR solution structure ... 91
III.2.3 Molecular dynamics ... 94
III.2.4.1 Relaxation data, diffusion tensor and hydrodynamic calculations ... 95
III.2.4.2 Internal mobility ... 99
III.2.4.3 Estimation of the conformational entropy from NMR Relaxation data ... 101
III.2.4.4 Amide proton exchange ... 102
III.3 Conclusions ... 104
III.4 Materials and methods ... 106
III.4.2 Molecular biology ... 106
III.4.2.1 Recombinant protein production ... 106
III.4.2.2 Transformation, expression and purification of CtCBM11 with the 6-histidine tail ... 106
III.4.2.3 Transformation, expression and purification of the double labeled 13C and 15N) CtCBM11 with the 6-histidine tail ... 107
III.4.3 X-ray crystallography ... 107
III.4.3.1 Co-crystallization studies ... 107
III.4.4 NMR spectroscopy ... 107
III.4.4.1 Data acquisition ... 107
III.4.4.2 Characterization of the sugars ... 108
III.4.4.3 Influence of calcium in the structure of cellohexaose ... 109
III.4.4.4 Linebroadening studies ... 109
III.4.4.5 STD-NMR studies ... 110
III.4.4.6 Diffusion studies (DOSY) ... 111
III.4.4.7 CtCBM11 titration ... 112
III.4.4.8 Combined chemical shift ... 113
III.4.4.9 Determination of the association constant (Ka) ... 114
III.4.4.10 Determination of the thermodynamic parameters ... 116
III.4.4.11 15N backbone relaxation measurements ... 116
III.4.4.12 Relaxation data processing and analysis ... 117
III.4.4.13 Estimation of the molecular diffusion tensor ... 118
III.4.4.14 Hydrodynamic calculations ... 118
III.4.4.15 Calculation of the model free dynamics parameters ... 119
III.4.4.16 Estimation of the conformational entropy from NMR relaxation data ... 119
III.4.4.17 Amide proton exchange ... 120
II.4.5.1 Docking experiments with the crystallographic structure
and molecular dynamics ... 122
II.4.5.2 Docking experiments with the NMR solution structure and molecular dynamics ... 123
III.7 References ... 124
CHAPTER IV MOLECULAR DETERMINANTS OF LIGAND SPECIFICITY IN CTCBM30 AND CTCBM44 ... 131
Summary ... 133
IV.1 Introduction ... 134
IV.2 Results and Discussion ... 137
IV.2.1 Molecular determinants of ligand specificity ... 137
IV.2.1.1 Saturation transfer difference NMR (STD-NMR) ... 138
IV.2.1.2 Docking models of the interaction of CtCBM30 and CtCBM44 with cellooligosaccharides ... 145
IV.2.1.2.1 Model of CtCBM30 bound to cellotetraose .. 145
IV.2.1.2.2 Model of CtCBM30 bound to cellohexaose .. 147
IV.2.1.2.3 Model of CtCBM44 bound to cellohexaose .. 148
IV.2.1.2.4 Model of CtCBM44 bound to cellopentaose . 151 IV.2.1.2.4 Model of CtCBM44 bound to cellotetraose .. 151
IV.2 Conclusions ... 152
IV.3 Materials and methods ... 153
IV.3.1 Sources of sugars ... 153
IV.3.2 Molecular biology ... 154
IV.4.2.1 Recombinant protein production ... 154
IV.4.2.2 Protein expression and purification ... 154
IV.3.3 NMR spectroscopy ... 155
IV.4.4.2 STD-NMR studies ... 155
IV.4.5 Docking studies ... 155
IV.4.5.1 Preparation of the ligand pdb files ... 155
IV.4.5.2 Docking models of the interaction of CtCBM30 and CtCBM44 with cellooligosaccharides ... 156
IV.7 References ... 156
CHAPTER V THE ORF2 TYPE II COHESIN-XDOCKERIN COMPLEX FROM C. THERMOCELLUM ... 159
Summary ... 161
V.1 Introduction ... 161
V.2 Results and Discussion ... 165
V.2.1 Architecture of the Orf2 type II Coh-XDoc complex from C. thermocellum ... 165
V.2.1.1 Type II Coh structure in the complex ... 168
V.2.1.2 Type II XDoc structure in the complex ... 168
V.2.1.3 The complex interface ... 173
V.3 Conclusions ... 177
V.4 Materials and methods ... 178
V.4.1 Molecular biology ... 178
V.4.2.1 Transformation, expression, purification and quantification ... 178
V.4.2 X-ray crystallography ... 179
V.4.2.1 Protein crystallization and data collection ... 179
V.4.2.2 Phasing, model building and refinement ... 179
CHAPTER VI THE SCAA TYPE II COHESIN-DOCKERIN COMPLEX FROM B.
CELLULOSOLVENS... 183
Summary ... 185
VI.1 Introduction ... 186
VI.2 Results and Discussion ... 187
VI.2.1 Architecture of the SdbA type II Coh-Doc complex from B. cellulosolvens ... 187
VI.2.1.1 Type II Coh structure in the complex ... 189
VI.2.1.2 Type II Doc structure in the complex ... 190
VI.2.1.3 The complex interface – an alternative binding mode ... 192
VI.3 Conclusions ... 196
VI.4 Materials and methods ... 196
VI.4.1 Molecular biology ... 196
VI.4.2.1 Transformation, expression, purification and quantification ... 196
VI.4.2 X-ray crystallography ... 197
VI.4.2.1 Protein crystallization and data collection ... 197
VI.4.2.2 Phasing, model building and refinement ... 197
VI.5 References ... 198
CHAPTER VII PROTEIN NMR SPECTROSCOPY ... 201
Summary ... 204
VII.1 Introduction ... 204
VII.2 Protein NMR ... 207
VII.2.1 Chemical Shift ... 207
VII.2.1.1 Spin-spin coupling and spin systems ... 208
VII.2.2 Relaxation... 212
VII.2.2.2 T1 relaxation ... 214
VII.2.2.3 T2 relaxation ... 215
VII.2.2.4 Dipole-dipole relaxation ... 217
VII.2.2.5 Chemical shift anisotropy relaxation ... 218
VII.2.3 The protein’s fingerprint – 15N-1H-HSQC... 219
VII.2.4 Nuclear Overhauser effect ... 221
VII.3 Protein structure determination ... 229
VII.3.1 Three-dimensional experiments ... 231
VII.3.1.1 Experiments for backbone assignments ... 232
VII.3.1.1.1 HNCO ... 232
VII.3.1.1.2 HN(CA)CO ... 234
VII.3.1.1.3 HN(CO)CACB ... 235
VII.3.1.1.4 HNCACB ... 237
VII.3.1.1.5 Angular restraints ... 239
VII.3.1.2 Experiments for side-chain assignments ... 240
VII.3.1.2.1 (H)CCH-TOCSY ... 240
VII.3.1.2.2 HNHA ... 241
VII.3.1.3 Experiments for NOE measurement ... 242
VII.3.1.3.1 15N/13C-NOESY-HSQC ... 242
VII.3.1.3.2 Distance restraints ... 243
VII.3.2 Structure validation ... 244
VII.4 Protein dynamics by NMR ... 245
VII.4.1 Theory of spin relaxation in proteins ... 246
VII.4.2 Protein motions and relaxation ... 248
VII.4.2.1 Reduced spectral density mapping... 248
VII.4.2.2 Rotational diffusion tensor ... 249
VII.4.2.3.1 Relationship between the generalized order .
parameter, S2, and the conformational entropy, ΔSconf ... 253
VII.4.2.4 Amide proton exchange ... 254
VII.5 Study of protein-ligand complexes ... 256
VII.5.1 Saturation-transfer difference ... 256
VII.5.2 Diffusion ordered spectroscopy... 261
VII.6 References ... 265
CHAPTER VIII X-RAY CRYSTALLOGRAPHY ... 273
Summary ... 275
VIII.1 Introduction ... 275
VIII.2 Crystal systems: symmetry operations and space groups ... 277
VIII.3 Protein crystallization ... 281
VIII.3.1 Matthews’ volume ... 283
VIII.4 Structure determination ... 284
VIII.4.1 X-ray diffraction and data collection ... 284
VIII.4.1.1 Synchrotron radiation ... 286
VIII.4.2 Model building and refinement ... 287
VIII.4.2.1 Molecular replacement ... 288
VIII.4.2.1.1 Patterson function ... 290
VIII.4.2.2 Model building ... 291
VIII.4.2.3 Model refinement ... 294
VIII.4.3 Structure validation ... 297
VIII.5 References ... 299
FINAL CONCLUSIONS ... 301
APPENDIX A ... 305
APPENDIX B ... 311
List of Figures
Figure I.1: From biomass to biofuels ... 4
Figure I.2: Plant cell wall structure ... 7
Figure I.3: Structure of cellulose... ... 8
Figure I.4: Simplified structure and abbreviated names of xyloglucan oligosaccharides.. ... 8
Figure I.5: Cellulosomes at the surface of Clostridium thermocellum.. ... 12
Figure I.6: Schematic representation of the Clostridium thermocellum cellulosome.. ... 15
Figure I.7: The cohesin-dockerin complex.. ... 18
Figure I.8: Classification of CBMs.. ... 21
Figure I.9: The binding-site platforms of the three types of CBMs.. ... 26
Figure I.10: Applications of hybrid CBMs.. ... 27
Figure II.1: 3D structure of CtCBM11 obtained by X-ray crystallography. ... 39
Figure II.2: Amino acid sequence of CtCBM11. ... 40
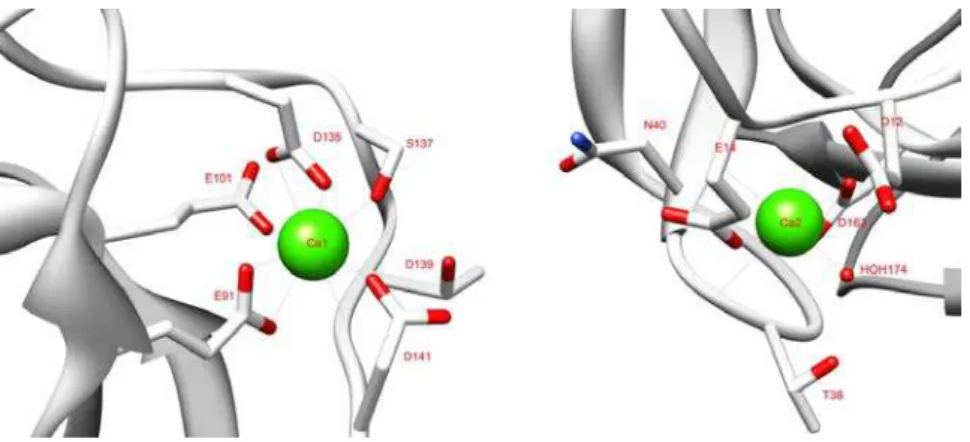
Figure II.3: Coordination of the two calcium ions in CtCBM11. ... 41
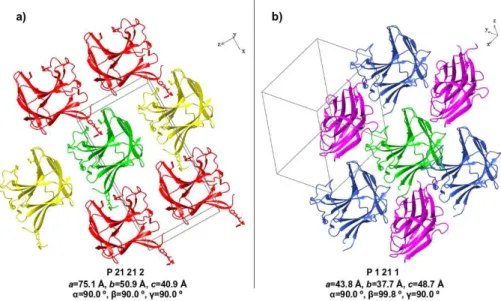
Figure II.4: Ribbon representation of CtCBM11 packing in the two different crystal forms, P21212 and P21. ... 43
Figure II.5: Superposition of the CtCBM11 structures determined with and without the histidine tail (structures depicted in blue and grey, respectively). ... 44
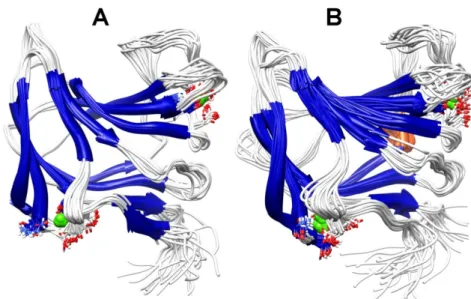
Figure II.6: Ribbon representation of the NMR-determined 20-structure ensemble of CtCBM11 at 25 ºC (A) and 50 ºC (B). ... 46
Figure II.7: Comparison between the X-ray and NMR structures. ... 48
Figure II.8: SDS-PAGE gel of the purified CtCBM11 fractions. ... 51
Figure II.9: Crystals of CtCBM11 with no engineered 6-His tail. ... 53
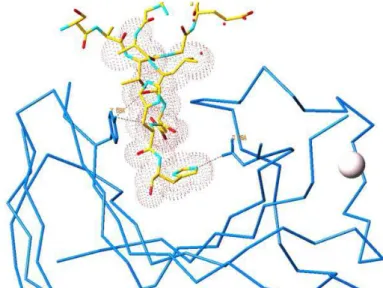
Figure III.1: Highlight of the binding cleft of CtCBM11 with the bound C-terminal histidine tail of a symmetry related molecule. ... 66
Figure III.2: Structure and 1H spectra of cellobiose. ... 69
Figure III.3: Structure and 1H spectra of cellotetraose. ... 69
Figure III.4: Structure and 1H spectra of cellohexaose. ... 70
Figure III.5: Structure and 1H spectra of laminarihexaose. ... 70
Figure III.6: Titration of cellohexaose with CaCl2. ... 74
Figure III.7: Line broadening studies ... 75
Figure III.8: STD-NMR of cellobiose with CtCBM11. ... 77
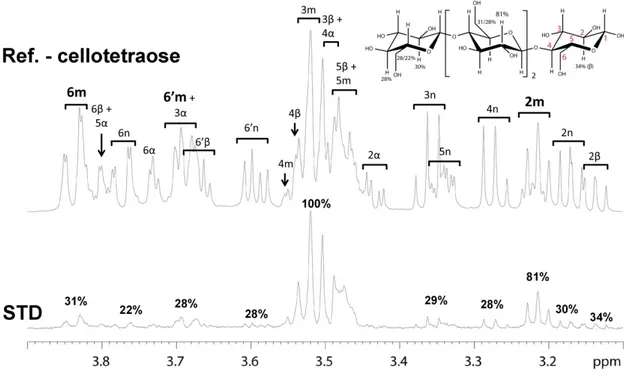
Figure III.10: STD-NMR and epitope mapping of cellohexaose bound to CtCBM11. ... 79
Figure III.11: STD-NMR of laminarihexaose with CtCBM11. ... 81
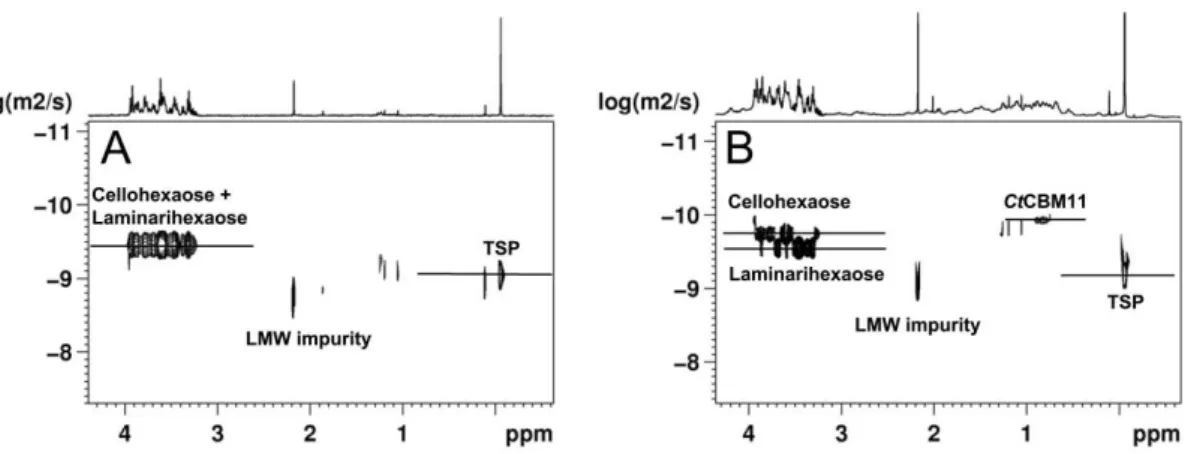
Figure III.12: DOSY spectra for the calculation of the association constant for
the cellohexaose/CtCBM11 interaction ... 82
Figure III.13: Backbone amide chemical shift variations between CtCBM11
and A) cellohexaose at 25ºC; B) cellohexaose at 50 ºC and C) cellotetraose at 25 ºC. ... 84
Figure III.14: Representation of the conformations of the three-dimensional
structure of binding of the different ligands obtained by docking. ... 88
Figure III.15: Representation of the most important interactions between the
β-cellotetraose (A) and β-cellohexaose (B) with the CtCBM11 binding cleft. ... 89
Figure III.16: Schematic representation of the main interaction between the pentasaccharide with the CfCBM4 (pdb entry: 1GU3) (A) and the hexasaccharide
with CtCBM11 (B). ... 90
Figure III.17: Docking models of CtCBM11 with cellohexaose at 25 ºC (A) and 50 ºC
(B) and cellotetraose at 25 ºC (C). ... 92
Figure III.18: Graphical superposition of the {1H}-15N-NOE of
CtCBM11 in the free
(black) and bound state (red) at 25 (top) and 50 ºC (bottom). ... 96
Figure III.19: Effect of binding and temperature on the R2/R1 ratio. ... 97
Figure III.20: Effect of binding (left) and temperature (right) on the S2 order parameter. ... 101
Figure III.21: Effect of binding in the (A) amide hydrogen/deuterium exchange rates
and (B) free energy of structural opening for the free and bound protein at 25 ºC. ... 103
Figure IV.1: 3D structure of CtCBM30 (A) and CtCBM44 (B) obtained by
X-ray crystallography. ... 133
Figure IV.2: Solvent-exposed tryptophan residues at the surface of CtCBM30 (A)
and CtCBM44 (B). ... 135
Figure IV.3: STD-NMR of cellobiose with CtCBM30 and CtCBM44. ... 138
Figure IV.4: STD-NMR of cellotetraose with CtCBM30 and CtCBM44. ... 139
Figure IV.5: STD-NMR of cellohexaose with CtCBM30 and CtCBM44. ... 141
Figure IV.6: STD-NMR of laminarihexaose with CtCBM30 and CtCBM44. ... 143
Figure IV.7: Model of the structure of CtCBM30 in complex with cellotetraose. ... 145
Figure IV.8: Model of the structure of CtCBM30 in complex with cellohexaose. ... 147
Figure IV.9: Model of the structure of CtCBM44 in complex with cellohexaose. ... 149
Figure IV.10: Model of the structure of CtCBM44 in complex with cellopentaose. ... 151
Figure IV.11: Model of the structure of CtCBM44 in complex with cellotetraose. ... 152
Figure V.1: Crystal structure of the Orf2 type II cohesin-modules X-dockerin complex
(CohII-XDocII) from C. thermocellum (PDB code: 2vt9) ... 161
Figure V.2: Schematic representation of the Clostridium thermocellum cellulosome. ... 162
Figure V.3: The dual binding mode of type I cohesin-dockerin complexes. ... 164
Figure V.4: Comparison of the structure of the Orf2 type II Coh-XDoc with the
Structure of the SdbA type II Coh-XDoc ... 167
Figure V.5: Ribbon representation of the structure of the type II cohesin module of
the Orf2 type II Coh-X-Doc complex. ... 168
Figure V.6: Structure of the type II X-dockerin module of the Orf2 type II
Coh-X-Doc complex. ... 169
Figure V.7: The XDoc and X-Coh interface hydrogen bonds in the type II Orf2 and
type II SdbA complexes. ... 171
Figure V.8: The Coh-Doc and X-Coh interface hydrogen bonds in the type II Orf2
and type II SdbA complexes. ... 174
Figure V.9: Sequence alignment of the type II dockerins from the native Orf2 and
SdbA complexes and the type I dockerin module ... 175
Figure V.10: Ribbon representation of the native and 180º-rotated type II Orf2
dockerin modules. ... 176
Figure VI.1: Crystal structure of the type II cohesin-dockerin complex (Coh-Doc)
from B. cellulosolvens (PDB code: 2y3n) ... 185
Figure VI.2: Schematic representation of the Bacteroides cellulosolvens cellulosome
(A) and phylogenetic relationships of the ScaA and ScaB cohesins (B). ... 187
Figure VI.3: Sequence alignment showing the dyad symmetry within the dockerin
sequence ... .188
Figure VI.4: Ribbon representation of the structure of the type II cohesin module of
the ScaA type II Coh11-Doc complex. ... 190
Figure VI.5: Ribbon representation of the structure of the type II dockerin module of
the ScaA Coh11-Doc complex. ... 191
Figure VI.6: The Coh-Doc interface hydrogen bonds in the type II ScaA complex. ... 193
Figure VI.7: Alternative binding mode in the B. cellulosolvens Coh-Doc complex and
Figure VII.1: Yearly and annual growth of structures solved by NMR. ... 205
Figure VII.2: 13C-13C TOCSY pattern of the 20 standard amino acids. ... 210 Figure VII.3: 1H-1H TOCSY and COSY pattern of the 20 standard amino acids. ... 211 Figure VII.4: Peptide torsion angles ... 212
Figure VII.5: The inversion recovery process. ... 214
Figure VII.6: Effect of the correlation time, τc, in the relaxation time T1. ... 215 Figure VII.7: The spin-echo refocuses magnetization dephased by field inhomogeneity. ... 216
Figure VII.8: Effect of the correlation time, τc, in the relaxation time T2. ... 217 Figure VII.9: The 15N-1H-HSQC (
A) and 13C-1H-HSQC (B) magnetization transfer. ... 219 Figure VII.10: 15N-1H-HSQC spectrum of the 52 amino acid (5.677 Da) protein rubredoxin
from the sulfate-reducing bacterium Desulfovibrio gigas (pdb code: 1rdg). ... 220 Figure VII.11: Irradiation of resonance A leads to an increase of peak intensity of
the neighboring spin C (positive NOE) or to a decrease of peak intensity (negative NOE). ... 221 Figure VII.12: Energy level diagram for a two homonuclear spin system -½ nuclei, I and
S, showing definitions of transition probabilities and spin states. ... 222 Figure VII.13: Schematic representation of the origin of the NOE in a homonuclear two
½ nuclei spin system. ... 223
Figure VII.14: Variation of the spectral density with the molecular motion as a function
of the frequency. ... 225
Figure VII.15: Schematic representation of the relaxation pathways that lead to direct and indirect contributions to the NOE enhancement of spin I upon S saturation in a
multispin system. ... 228
Figure VII.16: Process of 3D solution structure calculation from NMR data. ... 230
Figure VII.17: Anatomy of a 3D NMR experiment. ... 231
Figure VII. 18: Scalar coupling constants between the different nuclei in amino acids ... 231
Figure VII.19: The HNCO magnetization transfer. ... 233
Figure VII.20: Identifying the CO-1 resonance. ... 233 Figure VII.21: The HN(CA)CO magnetization transfer. ... 234
Figure VII.22: Identifying the COi resonance. ... 235 Figure VII.23: The HN(CO)CACB magnetization transfer. ... 236
Figure VII.24: Identifying the CA-1 and CB-1 resonances. ... 236 Figure VII.25: The HNCACB magnetization transfer. ... 237
Figure VII.26: Identifying the CAi and CB i resonances. ... 238 Figure VII.27: Sequential assignment of the protein backbone resonances based on
the HNCACB spectrum. ... 239
Figure VII.28: The (H)CCH-TOCSY magnetization transfer. ... 240
Figure VII.30: The 15N-1H-HSQC-NOESY (
A) and 13C-1H-HSQC-NOESY (B) magnetization
transfer... 243
Figure VII.31: Protein motion time scales and NMR techniques used to study each time scale. .. 246
Figure VII.32: Representation of an amide vector in a protein. ... 250
Figure VII.33: Interpretation of the generalized order parameter, S2, in a diffusion-in-a-cone
model ... 252
Figure VII.34: Scheme of the STD-NMR experiment. ... 256
Figure VII.35: STD amplification factor as a function of the saturation time (A) and ligand
concentration (B). ... 259 Figure VII.36: The Stejskal and Tanner pulsed field gradient NMR sequence. ... 262
Figure VIII.1: Flowchart of the main steps involved in a 3D structure determination by X-ray crystallography. ... 275
Figure VIII.2: Yearly and total growth of structures solved by X-ray crystallography... 276
Figure VIII.3: Crystal architecture. ... 277
Figure VIII.4: The Miller indices. ... 278
Figure VIII.5: The 14 Bravais lattices. ... 280
Figure VIII.6: Solubility curve of a protein as a function of the precipitant concentration. ... 282
Figure VIII.7: Obtaining crystals by the hanging drop method. ... 283
Figure VIII.8: Bragg’s Law. ... 285
Figure VIII.9: The Molecular Replacement method. ... 290
Figure VIII.10: Patterson map derived from a crystal with three atoms. ... 291
List of Tables
Table I.1: List of cellulosomal components of C. thermocellum (http://www.cazy.org). ... 16
Table I.2: Classification of CBM fold families ... 23
Table I.3: Classification of CBM types ... 23
Table II.1: X-ray data and structure quality statistics for CtCBM11. ... 44
Table II.2: Structural statistics for the NMR structures of CtCBM11. ... 46
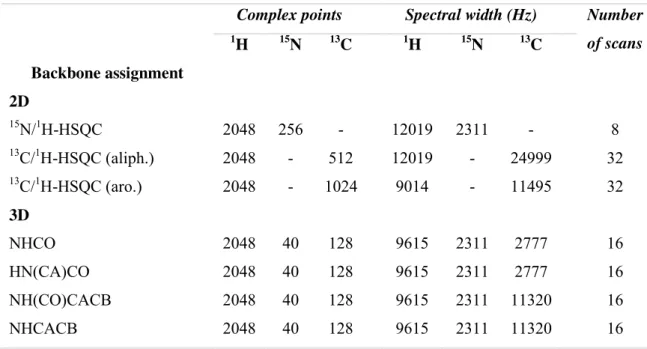
Table II.3: NMR experiments and acquisition details for the CtCBM11 resonance
assignment. ... 54
Table II.4: Short-range distances in the secondary structure elements. ... 56
Table III.1: Quantitative assessment of CtCBM11 binding to oligosaccharides
and polysaccharides as determined by ITC ... 65
Table III.2: Binding of wild type CtCBM11 and its mutant derivatives to
soluble polysaccharides quantified by affinity gel electrophoresis (AGE). ... 66
Table III.3: 1H chemical shifts of cellobiose, cellotetraose, cellohexaose and
laminarihexaose in D2O. ... 71
Table III.4: 13C chemical shifts of cellobiose, cellotetraose, cellohexaose and
laminarihexaose in D2O. ... 71
Table III.5: Linewidths at half-height for the different protons of cellohexaose during
the titration experiment. ... 75
Table III.6: Amplification factors and epitope mapping for the interaction between
CtCBM11 and cellotetraose and cellohexaose. ... 80
Table III.7: Self diffusion coefficients measured for the mixture of sugars with and
without the protein. ... 83
Table III.8: Quantitative assessment of CtCBM11 binding to cellohexaose and
cellotetraose, using the NH resonance of Tyr129 as a probe. ... 86
Table III.9: Average relaxation data and estimation of total correlation time (τm) taken
from R2/R1 ratios. ... 95
Table III.10: Characterization of the diffusion tensor obtained for CtCBM11 at the
different experimental conditions, obtained with Tensor2.0 and HYDRONMR. ... 98
Table III.11: Average order parameter (S2) and dynamic model used to fit the data
of the different experimental conditions, obtained with Tensor2.0 ... 100
Table III.13: Series of 15N-1N-HSQC spectra acquired in order to analyze the decay of the
amide proton signal intensities due to hydrogen exchange with D2O for the free and bound CtCBM11 at 298 K ... 121
Table IV.1: Quantitative assessment of CtCBM30 and CtCBM44 binding to
oligosaccharides and polysaccharides as determined by ITC ... 136
Table IV.1: Amplification factors and epitope mapping for the interaction between
CtCBM30 and CtCBM44 with cellotetraose, cellohexaose and laminarihexaose ... 144
Table V.1: X-ray data and structure quality statistics for the Clostridium thermocellum
Orf2 type II Coh–XDoc complex. ... 166
Table V.2: Calcium coordination in the dockerin domain ... 170
Table V.3: XDoc interface hydrogen bonds and salt bridges ... 172
Table V.4: X-Coh contacts ... 173
Table V.5: Coh-Doc interface hydrogen bonds ... 174
Table V.6: Coh-Doc interface hydrogen bonds in the 180º-rotated complex ...176
Table VI.1: X-ray data and structure quality statistics for the B. cellulosolvens type II
Coh–Doc complex. ... 188
Table VI.2: Calcium coordination in the dockerin domain ... 191
Table VI.3: Coh-Doc interface hydrogen bonds ... 193
Table VI.4: Coh-Doc interface hydrogen bonds in the 180º-rotated complex ... 195
Table VII.1: A summary of some key developments that have had a major influence
on the practice and application of high-resolution NMR spectroscopy in chemical research .. 206
Table VII.2: Random coil chemical shifts for common amino acids ... 207
Table VII.3: Typical spin coupling constants in amino acids ... 209
Table VII.4: Pulse sequences typically used for protein structure determination as
described in this chapter ... 232
Table VII.5: Different models that can be used in a model-free analysis of relaxation rates .. 253
Table VII.6: Dissociation rates for known Kd values assuming that kon is diffusion
controlled... 260
Nomenclature
𝝈
𝟎𝒄𝒐𝒓𝒓Corrected standard deviation to zero
13
C-
15N-Ct
CBM11
Double-labeled (
13
C and
15N) CtCBM11
15
NH
4
Cl
15N-labeled ammonium chloride
A/Ala
Alanine
Abs
Absorbance
Ac
Acetivibrio cellulolyticus
AGE
Affinity Gel Electrophoresis
A
STDSTD amplification factor
B. cellulosolvens
Bacteroides cellulosolvens
Bc
Bacteroides cellulosolvens
BCA
Bicinchoninic acid
BSA
Bovine Serum Albumin
C. fimi
Cellulomonas fimi
C. thermocellum
Clostridium thermocellum
C/Cys
Cysteine
Ca
Clostridium acetobutylicum
CBF
Cellulose-Binding Factor
CBM
Carbohydrate-Binding Module
Cc
Clostridium cellulolyticum
Cc
Clostridium cellulovorans
CE
Carbohydrate Esterase
Cel
Cellulase
Cf
Cellulomonas fimi
Cf
CBM2
Family 2 Carbohydrate-Binding Module from Cellulomonas fimi
Cf
CBM4
Family 4 Carbohydrate-Binding Module from Cellulomonas fimi
CipA
Cellulosome-integrating protein A
Cj
Clostridium josui
Cj
Cellvibrio japonicus
Cj
CBM10
Family 10 Carbohydrate-Binding Module from Cellvibrio japonicus
COSY
Correlation Spectroscopy
Coh
Cohesin
Ct
Clostridium thermocellum
Ct
CBM11
Family 11 Carbohydrate-Binding Module from Clostridium
thermocellum
Ct
CBM3
Family 3 Carbohydrate-Binding Module from Clostridium
thermocellum
Ct
CBM30
Family 30 Carbohydrate-Binding Module from Clostridium
thermocellum
Ct
CBM44
Family 44 Carbohydrate-Binding Module from Clostridium
thermocellum
Cthe
Clostridium thermocellum
D/Asp
Aspartate
D2O
Deuterium oxide
DOSY
Diffusion Ordered Spectroscopy
Doc
Dockerin
E. coli
Escherichia coli
E/Glu
Glutamate
Ec
Erwinia chrysanthemi
Ec
CBM5
Family 5 Carbohydrate-Binding Module from Erwinia chrysanthemi
ESRF
European Synchrotron Radiation facility
F/Phe
Phenylalanine
F1
Direct dimension
F2
Indirect dimension
FCUP
Faculdade de Ciências da Universidade do Porto
G/Gly
Glycine
GH
Glycoside Hydrolase
GH26
Family 26 glycoside hydrolase
GH44
Family 44 glycoside hydrolase
GH5
Family 5 glycoside hydrolase
GH9
Family 9 glycoside hydrolase
GT
Glycosyltransferase
H/His
Histidine
HEPES
4-(2-Hydroxyethyl)-1-piperazine-ethanesulfonic acid
HetNOE
Heteronuclear steady-state NOE
HSQC
Heteronuclear Single Quantum Coherence
I/Ile
Isoleucine
IPTG
Isopropyl 1-thio-
β
-D-galactopyranoside
ITC
Isothermal Titration Calorimetry
K/Lys
Lysine
K
aEquilibrium affinity constant
K
dEquilibrium dissociation constant
kHz
Kilohertz
K
MMichaelis constant
L/Leu
Leucine
LB
Luria-Bertani growth medium
Lic
Lichenase
LMW
Low Molecular Weight
M/Met
Methionine
M9
Minimal medium
MAD
multiwavelength anomalous diffraction
MD
Molecular Dynamics
MM
Molecular Mechanics
MT
Mega tons
Mv
Micromonospora viridifaciens
Mv
CBM32
Family 32 Carbohydrate-Binding Module from Micromonospora
viridifaciens
N/Asn
Asparagine
NaCl
Sodium chloride
NMR
Nuclear Magnetic Resonance
NOE
Nuclear Overhauser Effect
NOESY
Nuclear Overhauser Effect Spectroscopy
OD
Optical density
OH
hydroxyl
OlpC
Outer -layer protein component C
Orf2
Open reading frame 2
P/Pro
Proline
PDB
Protein Data Bank
PEG
Polyethyleneglycol
PKD
Polycystic kidney disease
PL
Polysaccharide Lyase
ppm
Parts per million
Q/Gln
Glutamine
R/Arg
Arginine
R
1Longitudinal relaxation rate
R
2Transverse relaxation rate
Ra
Ruminococcus albus
Rf
Ruminococcus flavefaciens
rmsd
Root Mean Square Deviation
rpm
Rotations per minute
S/Ser
Serine
SdbA
Scaffoldin dockerin binding protein A
SDS-PAGE
Sodium dodecyl sulfate-polyacrylamide gel electrophoresis
Sl
Streptomyces lividans
Sl
CBM13
Family 13 Carbohydrate-Binding Module from Streptomyces
lividans
SLH
S-Layer Homology
STD-NMR
Saturation Transfer Difference Nuclear Magnetic Resonance
T/Thr
Threonine
T
1Longitudinal relaxation
T
1ρSpin-lock filter
T
2Transverse relaxation
TLS
Translation, Libration and Screw-rotation
Tm
Thermotoga maritima
T
maxMaximal temperature
Tm
CBM9-2
Family 9 Carbohydrate-Binding Module from Thermotoga maritima
TOCSY
Total Correlation Spectroscopy
T
optOptimum temperature
Tr
Trichoderma reesei
Tr
CBM1
Family 1 Carbohydrate-Binding Module from Trichoderma reesei
TSP
Trimethylsilyl propionate
Tt
Tachypleus tridentatus
Tt
CBM14
Family 14 Carbohydrate-Binding Module from Tachypleus
tridentatus
Ud
Urtica dioca
Ud
CBM18
Family 18 Carbohydrate-Binding Module from Urtica dioca
V/Val
Valine
W/Trp
Tryptophan
XDoc
Module X-dockerin
Y/Tyr
Tyrosine
γ
Magnetogyric ratio
ΔG
Binding Gibbs energy
ΔH
Binding enthalpy
ΔS
Binding entropy
Δδ
combCombined chemical shift
Chapter I: Introduction - The
Importance of the Research
In this chapter I give an introduction to the plant cell wall degradation theme, explaining how
some microorganisms master this task. I will provide an overview on the cellulosome and on the
modules responsible for its assembly and architecture (cohesin and dockerin) and efficiency
(carbohydrate-binding modules). In the end I will show some biotechnological applications that
Table of Contents
Summary ... 3 I.1 Introduction ... 3 I.2 The plant cell wall ... 6 I.2.1 Cellulose ... 7 I.2.2 Xyloglucan ... 8 I.3 Plant cell wall hydrolysis ... 9 I.3.1 Enzymatic hydrolysis: The cellulosome... 10 I.4 The cellulosome of Clostridium thermocellum: architecture and function ... 14
Summary
In this introductory chapter I will give an introduction on the plant cell wall degradation theme, explaining how some microorganisms master this task (Sections I.2 and I.3). A special
attention will be given to the cellulosome of the bacterium Clostridium thermocellum (C. thermocellum, Ct – Section I.4) and its constituents, namely on the modules responsible for
cellulosome assembly and architecture (cohesin and dockerin – Section I.5) and efficiency
(carbohydrate-binding modules – CBMs – Section I.6). In the end I will show some
biotechnological applications that can result from understanding how this nanomachines work at the molecular level. Finally I will explain the objectives of the work and make a small outline of the thesis.
I.1
Introduction
The plant cell wall is composed mainly of cellulose and hemicellulose (15-40% and 30-40%, respectively)1 and its degradation is one of the most important steps in the global turnover process of atmospheric CO2, therefore, of considerable biological and biotechnological importance.2 Regardless of its abundance in nature, cellulose is a particularly difficult polymer to degrade, as it is insoluble and is present as hydrogen-bonded crystalline fibers, coated with hemicellulose chains and pectin all “glued” into an intricate 3D network (see Section I.2).3 At
the present time, biomass accounts for about 10% of the world’s primary energy consumption. The other 90% is made up of nonrenewable fossil fuels (80%), hydroelectricity (2%), nuclear energy (6%), and renewable solar energies (2%).1
Both the cellulose and hemicellulose fractions are polymers of sugars, and thereby a potential source of fermentable sugars that can be used for ethanol production (Figure I.1) and other products of economic interest like acetone, alcohols and volatile fatty acids.1,2 Economic production of ethanol from cellulosic biomass on commercial scales will help reduce our dependence on fossil fuels. Ethanol produced from biological sources can efficiently be used as a gasoline replacement or additive and, when compared to fossil fuels, presents many advantages, namely2:
• Unblended ethanol burns more cleanly and more efficiently,
• Has a higher octane rating,
• It is thought to produce smaller amounts of ozone precursors (thus decreasing urban
• Has a low net CO2 put into the atmosphere,
• It is significantly less toxic to humans than gasoline,
• Reduces smog formation because of low volatility,
• Its high heat of vaporization, high octane rating, and low flame temperature yield good engine performance.
Figure I.1: From biomass to biofuels.
The goal is to develop crops dedicated to biofuels production. The biomass would then be broken down into fermentable sugars by microbes (for instance C. thermocellum) that would convert them into biofuel.
Adapted from: http://genomics.energy.gov.
Furthermore, ethanol produced by fermentation offers a more favorable trade balance and a major opportunity for a depressed agricultural economy. Nevertheless, due to the complexity of the plant cell wall, most methods for producing biofuel from biomass are still relatively expensive when compared to fossil fuels.
Efficient methods for degrading cellulose chains have been intensively investigated worldwide in the last decades.1,4-8 The degradation of plant cell wall polysaccharides into soluble sugars has been found to be possible either by chemical means or by certain microorganisms.2 The latter method has become the most attractive due to economic and efficiency reasons. The potential quantity of ethanol that could be produced from cellulose is over an order of magnitude larger than that producible from corn. As a result, microorganisms that metabolize cellulose have gained prominence in recent years.2,4,7,9 One of these
microorganisms is the anaerobic cellulolytic thermophilic bacterium, Clostridium
thermocellum.10-12 Clostridium thermocellum produces an extracellular complex -
cellulosome11,13 (see Section I.3.1) - capable of hydrolyzing the cell wall with the formation of
cellobiose* and other cellodextrins† as main products that can be further utilized by the organism. The final products are ethanol, acetic acid, lactic acid, hydrogen, and carbon dioxide.2
* Cellobiose is a disaccharide composed of two glucose units linked by a β-1,4 glycosidic bond. As each glucose unit is rotated 180º relative to the previous, cellobiose is the structural subunit of cellulose.
In fact, there are several advantages of using C. thermocellum for ethanol fermentation from
biomass:2
• The cellulolytic and ethanogenic nature, allowing saccharification and fermentation in
a single step,
• The anaerobic nature, avoiding the need for expensive oxygen transfer,
• Low cell growth yield, favoring ethanol conversion,
• The thermophilic nature, facilitating ethanol removal and recovery and reducing cooling cost,
• Thermophilic fermentation being less prone to contamination,
• Thermophilic biomass-degrading enzymes enhancing protein stability.
In order to efficiently hydrolyze the plant cell wall, these mega-Dalton extracellular machines are composed of a huge paraphernalia of enzymes and non-catalytic modules (see Section I.4). The enzymes present reflect the composition and complexity of the plant cell wall14
and, in order to increase their catalytic activity, most enzymes are linked to one or more non-catalytic carbohydrate-binding modules (CBMs).15 These modules, as reflected by their name, bind to carbohydrates and have a fundamental role in the enzymatic degradation of plants and in polysaccharide storage due to their high specificity and substrate recognition mechanisms. Due to their key importance in recycling carbon from plant biomass, these enzyme systems have a considerable biotechnological potential (see Section I.6.3). Profound knowledge about the
cellulosome assembly and, more important, about the specificity of the different CBMs, will bring a relevant contribution to the possible engineering of more efficient catalysts. Furthermore, the rationalization of the molecular recognition mechanisms that determine the specificity of these proteins opens the way for the creation of efficient and low cost mechanisms for the conversion of biomass into ethanol.
Cellulosomes are bound to the bacterial cell wall via the type II cohesin-dockerin interaction (see Section I.5 and Chapters V and VI).16,17 This interaction promotes the close contact between
type I and type II cohesin-dockerin interactions is thus of major importance to cellulosome assembly and attachment.
I.2
The plant cell wall
Among all the features that distinguish plant cells from animal cells, the presence of a plant cell wall is the most distinctive. Its presence is the basis of many of the characteristics of plants as organisms. The plant cell walls are not simply an outer, inactive shell of the plant cell itself but rather dynamic structures that play critical roles such as:
• Structural support allowing the organism to build and hold its shape
• Protection against mechanical stress
• Limits the entry of large molecules that may be toxic to the cell acting as a filtering mechanism
• Creates a stable osmotic environment preventing enlargement of the plant cell and
osmotic lysis
• It’s involved in absorption, transport and secretion of substances in plants
• Cell-cell interactions
• Source of biological signaling molecules
Figure I.2:Plant cell wall structure.
Adapted from: http://genomics.energy.gov.
I.2.1
Cellulose
Cellulose is the structural component of the primary cell wall of green plants, but it is also found in many forms of algae, bacteria and the oomycetes‡. About 33% of all plant matter is cellulose, which makes this polymer the most common organic compound on Earth.22 Cellulose is a linear polymer composed of several hundred to over ten thousand of β-1,4-D-glucopyranose units in 4C
1 conformation (Figure I.3). Each glycosyl residue is oriented at an angle of 180° to the next residue of the chain, which makes cellobiose (a disaccharide) the repeating structural unit. The glycosyl residues form one covalent bond at C1β–C4’ plus intramolecular hydrogen
bonds at O3–H→O5’ and O6→H–O2’ and intermolecular O6–H→O3’.23
This extensive hydrogen bond network keeps the strands tightly bound and gives rise to complex three-dimensional structures. The chains of cellulose associate with other polymers to form linear structures of high tensile strength known as microfibrils which consist of up to 40 cellulose chains and have about 10 to 20 nm in diameter. This complex structure, allied with tightly intercalated lignin and hemicellulose leads to a structural resistance that prevents enzymes (cellulases and hemicellulases) from attacking cellulose.3,23 Therefore, pretreatment of biomass (with acids for instance) is necessary to remove the surrounding matrix of hemicellulose and lignin prior to cellulose hydrolysis.
Figure I.3: Structure of cellulose.
The picture shows two adjacent cellulose chains and the glycosidic and hydrogen bonds holding them together. Note the parallel arrangement with the reducing ends aligned in the same direction.
I.2.2
Xyloglucan
Hemicellulose is collective term used to describe a family of polysaccharides composed of different sugars such as xylose, mannose, galactose, rhamnose and arabinose, among others and xyloglucan is the most abundant polysaccharide of the hemicellulose present on the primary cell wall in many dicotyledonous. It consists of α-1,6-D-xylosyl residues along a β-1,4-glucan backbone with additional branching of α-L-arabinose or β-D-galactose in a species-dependent manner. Because the β-1,4-glucan backbone binds to the cellulose microfibrils via hydrogen bonds, xyloglucan confers rigidity to the cell wall by cross-linking adjacent microfibrils. In fact, microfibrils are covered in xyloglucan, which is located both on and between microfibrils.1 A single-letter nomenclature is used to simplify the xyloglucan nomenclature according to the substituent. For instance: a G represents an unbranched glucose unit, an X represents a glucose unit with a 1,6-linked xylose, an F represents a glucose residue with a fucose-containing trisaccharide and so on (Figure I.4).24
I.3
Plant cell wall hydrolysis
Lignocellulosic biomass is composed of cellulose, hemicellulose and lignin and is the most abundant renewable natural resource on Earth with a global production of about 1×10¹⁰ MT.2,8 Because the cellulose and hemicellulose fractions are polymers of sugars they can be used as a source of fermentable sugars for conversion into fuels. Lignocellulose is inexpensive, plentiful and renewable. The hemicellulose fraction can be easily hydrolyzed under mild acid or alkaline conditions whilst cellulose requires more rigorous treatment since it is more resistant. Cellulose is a very stable molecule, with a half-life of several million years for spontaneous β-glycosidic bond cleavage at room temperature. This means that practically all cellulose degradation in Nature is accomplished by enzymatic action.1 The general protocol for conversion of lignocellulosic biomass into fermentable sugars involves three steps:4,6
1. An initial milling step to grind the raw materials and increase the surface area;
2. A pretreatment process to make the cellulose microfibrils accessible. In this step hydrolysis of hemicellulose may occur (depending on the process conditions) as well as separation of the lignin fraction (for production of chemicals, combined heat and power production or other purposes);
3. Enzymatic cellulose hydrolysis to liberate the monosaccharides.
Current research is focused on converting biomass into its constituents in a market competitive and environmentally sustainable way and an improvement of pretreatment technologies and enzymatic hydrolysis gives scope for numerous ongoing research projects.
Pretreatment methods can be chemical, thermal, physical or any combination of the three. To achieve higher efficiency a combination of physical and chemical means is required. Physical methods (often called size reduction) are used to trim down biomass physical size. Chemical methods remove the chemical barriers allowing enzymes to hydrolyze cellulose.25 The pretreatment step is one of the most expensive ones for the extractions of sugars from biomass. Over the years a “wish list” of pretreatment attributes has been developed. As a result, a successful pretreatment should:4,26
• Maximize the enzymatic convertibility and minimize the loss of sugars
• Maximize the production of other valuable by-products, e.g. lignin
• Not require the addition of toxic chemicals
• Minimize the use of energy, chemicals and capital equipment
Nevertheless, full accomplishment of all the above issues is very difficult, with the last two points being fundamental for economical and practical viability of the entire process.
I.3.1
Enzymatic hydrolysis: The cellulosome
As referred above, despite its chemical homogeneity, cellulose is a very stable molecule and no single enzyme is able to hydrolyze it.9 Efficient hydrolysis of cellulose requires the synergistic action of several enzymes that can be divided into three classes:
• endo-1,4-β-D-glucanases (EC 3.2.1.4), which randomly hydrolyze internal β -1,4-glucosidic bonds in the cellulose chain to produce new termini available to exoglucanase attack;
• exo-1,4-β-D-glucanases (EC 3.2.1.91), which move along the cellulose chain and progressively cleave off cellobiose units at the reducing and non-reducing ends;
• 1,4-β-D-glucosidases (3.2.1.21), which hydrolyze cellobiose to glucose and cleave of glucose units from cellooligosaccharides.
These enzymes work together in a synergistic way to hydrolyze cellulose by creating accessible sites for each other and reducing product inhibition.1,4 Furthermore, in the plant cell wall there are also hemicelluloses with their many different side groups which significantly increase its complexity. Among the enzymes responsible for degradation of hemicellulose there are:4
• endo-1,4-β-D-xylanases (EC 3.2.1.8), which hydrolyze internal bonds in the xylan chain;
• 1,4-β-D-xylosidases (EC 3.2.1.37), which attack xylooligosaccharides from the non-reducing end and liberate xylose;
• endo-1,4-β-D-mannanases (EC 3.2.1.78), which cleave internal bonds in mannan;
• 1,4-β-D-mannosidases (EC 3.2.1.25), which cleave mannooligosaccharides to
mannose.
• The side groups are removed by a number of enzymes:
o α-D-galactosidases (EC 3.2.1.22);
o α-l-arabinofuranosidases (EC 3.2.1.55);
o α-glucuronidases (EC 3.2.1.139);
o acetyl xylan esterases (EC 3.1.1.72);
All these hydrolytic enzymes are relatively expensive and difficult to produce in large amounts and, therefore, significant reduction of production costs is important for their commercial use. Currently, most commercially available enzymes are produced by genetically engineered strains of filamentous fungi, particularly Trichoderma reesei.2 However, the
enzymatic hydrolysis of cellulose is generally a slow and incomplete process. On the other hand, in Nature, microorganisms have evolved in order to profit from this highly abundant source of energy. In some cases, microorganisms directly explore these polysaccharides from decaying plant matter while in other cases, in a symbiotic way, they assist higher animals (e.g. ruminants) in the conversion of the polysaccharides into digestible compounds. While aerobic microorganisms produce large amounts of relevant enzymes (e.g. cellulases and hemicellulases), the mechanism of biosynthetic anaerobic organisms is simpler with respect to the production of such enzymes. In this context, it is thought that the anaerobic environment presents a great selective pressure on the evolution of highly efficient machinery for extracellular degradation of cell wall components.20 Consequently, anaerobic organisms tend to adopt alternative strategies to degrade material plant.
Anaerobic organisms secrete a large range of plant cell wall hydrolases, which are organized in multi-enzyme complexes termed cellulosomes (Figure I.5).9,13,14,20,27-30 The cellulosome was first described by Lamed et al13,16 and defined as “a discrete, cellulose binding, multienzyme
complex for the degradation of cellulosic substrates” pointing to the molecular ordering of the cellulosome components. The initial cellulosome concept was based on studies in the cellulase system of the anaerobic cellulolytic thermophilic bacterium, Clostridium thermocellum10,11 (see Section I.4) and it was believed that it solely degraded cellulose (hence the initial term
Figure I.5: Cellulosomes at the surface of Clostridium thermocellum.32 The cellulosomes are indicated by the black arrows.
Basically, cellulosomes are composed of five different components (Figure I.6):
• The scaffoldin subunit: The scaffoldin subunit is a non-catalytic protein that contains one or more cohesin modules connected to other types of functional modules. Depending on the scaffoldin protein, the referred modules include a cellulose-specific carbohydrate-binding module, a dockerin, an X module of unknown function, an S-layer homology (SLH) module or a sortase anchoring motif.14,27 The scaffoldin is responsible for organizing the different subunits into the complex, therefore, shaping the overall architecture of the cellulosome.16,20 Motional freedom of the scaffoldin subunit allows precise positioning of the catalytic modules according to the topography of the substrate.33
• The cohesin modules: Cohesin modules are the major building blocks of the scaffoldin subunit and are responsible for organizing the cellulolytic subunits into the multi-enzyme complex (see Section I.5).27 Cohesins are classified into three groups:
type I, type II and (recently) type III34, according to their phylogenetic similarity.34 type I cohesins are located in the scaffoldin subunit and are responsible for incorporating the different catalytic subunits; type II cohesins are located at the cell surface and are responsible for anchoring the multienzyme complex into the cell wall; type III cohesins still have an unclear function14.