Filipe Miguel dos Santos Freire
Licenciado em Bioquímica
I
NTEGRATED STUDY BY
NMR
AND
X-
RAY
C
RYSTALLOGRAPHY
ON THE ANALYSIS OF THE MOLECULAR INTERACTIONS
IN HEME
-
BINDING PROTEINS
Dissertação para obtenção do Grau de Doutor em Bioquímica, Especialidade Bioquímica Estrutural
Orientadora: Doutora Maria dos Anjos Macedo
Professora Auxiliar, FCT/UNL
Co-Orientadora: Doutora Maria João Romão
Professora Catedrática, FCT/UNL
Co-Orientador: Doutor Brian James Goodfellow
Professor Auxiliar, UA
Juri
Presidente: Professor Doutor José Paulo Barbosa Mota
Arguentes: Professor Doutor Carlos Frederico de Gusmão Campos Geraldes Doutora Sandra de Macedo Ribeiro
Vogais: Doutor Jean-Marc Moulis Doutor Shabir Husein Najmudin
Doutora Ana Luísa Moreira de Carvalho
I
NTEGRATED STUDY BY
NMR
AND
X-
RAY
C
RYSTALLOGRAPHY
ON THE ANALYSIS OF THE MOLECULAR INTERACTIONS
IN HEME
-
BINDING PROTEINS
DISSERTAÇÃO APRESENTADA PARA A OBTENÇÃO DO GRAU DE DOUTOR EM BIOQUÍMICA, ESPECIALIDADE BIOQUÍMICA ESTRUTURAL, PELA FACULDADE DE
Copyright em nome de Filipe Miguel dos Santos Freire, da FCT/UNL e da UNL
VII
‘If you can't explain it simply, you don't understand it well enough.’
Albert Einstein
Os resultados apresentados nesta tese de doutoramento só foram alcançados devido ao esforço e ajuda de várias pessoas e instituições. Por isso gostaria de agradecer:
Aos meus orientadores de doutoramento, Professora Anjos Macedo, Professora Maria João Romão e Professor Brian Goodfellow por me terem dado a oportunidade de ter trabalhado com eles e pelo apoio prestado ao longo dos últimos 6 anos.
Ao Jorge, pela passagem de testemunho no meu projecto de doutoramento. À Susana,
‘companheira’ neste projecto.
À Ana Luísa por ter sido, para além de uma excelente colega de laboratório, a minha
‘professora’ de cristalografia, por me ter ajudado na planificação e execução das experiências de cristalografia, pela visita guiada ao ESRF na minha primeira ida, ainda aluno de licenciatura e sobretudo pelo esforço que dispendeu para me ajudar na (difícil) determinação da estrutura tri-dimensional da proteína SOUL.
À Teresa, por ter sido a minha primeira ‘orientadora’, no trabalho que desenvolvi no estágio de Licenciatura e por ser uma pessoa muito optimista, bem disposta, sempre disponível.
Ao Zé, pelas discussões científicas, pelos valiosos conselhos, cristalográficos mas também computacionais; pela amizade e disponibilidade, sobretudo nos momentos mais complicados.
A todos os membros do grupo de cristalografia que, desde 2005, me ajudaram nesta etapa da minha vida. Um agradecimento especial à Joana, Cecília, por todo o apoio laboratorial e ao Shabir, an ‘old chap’ always available to teach me crystallography, to revise this thesis, to pay me a beer, to talk about football, tennis and even cricket.
Ao Aldino, pela amizade mas também pela paciência para com as minha dúvidas elementares na preparação das experiências de RMN e na análise das mesmas.
VIII
que agora é aluno de doutoramento, um agradecimento pelas longas trocas de palavras sobre futebol, e não só (ai os desabafos que ele ouviu da minha parte!). Ao David, antigo membro do grupo de cristalografia, que se tornou num amigo e parceiro de ténis e futebol, obrigado pelas longas conversas sobre tudo e mais alguma coisa, quase sempre sem grande conteúdo mas sempre com muito boa disposição.
To Jean-Marc Moulis for giving me the unique opportunity to work in his laboratory for
approximately three weeks and learn so many things about protein cloning, overexpression and
purification.
À Fundação para a Ciência e a Tecnologia, pelo apoio financeiro (SFRH/BD/30239/2006 e PTDC/QUI/64203/2006).
Ao meus grandes amigos, Nuno, Tiago, Catarina e Irina. Ao Nuno e ao Tiago pela grande amizade que nos uniu desde o início dos tempos de faculdade, pelas grandes discussões que tivemos durante a elaboração de relatórios, trabalhos e apresentações, pelos artigos que me enviaram directamente dos EUA, pelas grandes jogatanas de ‘Sueca’ nas viagens de comboio (o
mítico comboio das 7:11, que até deu origem a um blog) e na esplanada do C5. À Catarina pelo apoio constante durante o meu doutoramento, pelas longas conversas no laboratório, pela companhia nas viagens a sincrotrões e congressos. À Irina por ter sido uma presença constante, sempre com palavras de apoio e incentivo.
À pessoa que preencheu a minha vida nos últimos 12 anos, que esteve sempre presente, nos bons mas sobretudo nos maus momentos, nos momentos de desmotivação e pessimismo; obrigado por me perceberes sempre, mesmo quando não digo nada! Caminharemos sempre
juntos porque temos ‘laços inquebráveis’!
Aos meus pais, por tudo o que sou, por tudo o que alcancei, por tudo o que me dão, todos os dias, a cada instante, a cada gesto, OBRIGADO!
‘Underneath this smile lies everything, all my hopes and anger, pride and shame’
IX
diversos processos biológicos. Devido à sua toxicidade e elevada insolubilidade, há proteínas que se ligam transientemente a esta molécula, garantindo o seu posterior transporte e inserção em proteínas hémicas. Nesta dissertação é efectuado um estudo estrutural sobre três proteínas de ligação ao hemo, a proteína humana SOUL (hSOUL) e as proteínas p22HBP de murganho e humana.
No capítulo 1 é efectuada uma introdução ao grupo hemo e à sua importância biológica e sistematizada a informação disponível sobre as proteínas acima referidas. São também apresentados os princípios básicos das principais técnicas que foram utilizadas na caracterização estrutural destas proteínas: Cristalografia de raios-X e Ressonância Magnética Nuclear (RMN). Para os estudos descritos neste trabalho foi necessário obter as proteínas com elevado grau de pureza e em quantidades significativas. Para tal, foi necessário efectuar a clonagem da proteína hSOUL e optimizar a sua sobre-expressão e purificação – capítulo 2.
A proteína hSOUL apresenta uma estrutura global bastante semelhante à proteína p22HBP de murganho. No capítulo 3 é apresentada a determinação da estrutura da proteína hSOUL por Cristalografia de raios-X, descrita a respectiva estrutura tri-dimensional e discutidas as possíveis implicações funcionais da mesma.
Para compreender a interacção do grupo hemo à proteína hSOUL foram efectuados vários estudos recorrendo às técnicas de RMN, Extinção de Fluorescência e Espectroscopia de Visível. Os resultados obtidos, e apresentados no capítulo 4, indicam que, a existir, a ligação hemo-hSOUL deverá ser uma ligação não específica.
Na capítulo 5 são descritas as diversas experiências de cristalização das proteínas p22HBP humana e de murganho, com o intuito de determinar a sua estrutura tri-dimensional em complexo com o grupo hemo e, deste modo, compreender a interacção hemo-p22HBP.
No capítulo 6 são apresentadas as principais conclusões respeitantes ao trabalho que foi desenvolvido e que se encontra descrito nesta dissertação. São também incluídas algumas perspectivas futuras.
XI
to its toxicity and high insolubility, several proteins transiently bind this molecule, ensuring the transport and insertion into heme proteins. A structural study of three heme-binding proteins, human SOUL protein and human and murine p22HBP is described in this dissertation.
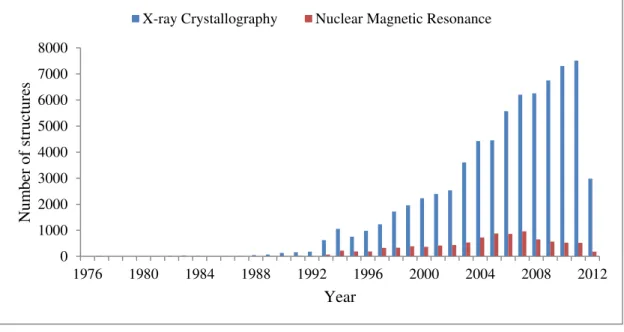
In chapter 1, an introduction to heme and its biological importance is performed and all the information related to the proteins previously mentioned is summarized. The basic principles of X-ray Crystallography and Nuclear Magnetic Resonance (NMR), the techniques used in the structural characterization of these proteins, are described.
For the studies described in this thesis large amounts of pure protein are required. For this reason, hSOUL protein was cloned, and the overexpression and purification of hSOUL optimized – chapter 2.
The overall structure of hSOUL is very similar to murine p22HBP solution structure. hSOUL protein structure determined by X-ray Crystallography is described in chapter 3 and the possible biological consequences are discussed.
Understanding the heme interaction with hSOUL was an important objective of this work. For that, NMR, Fluorescence Quenching and Visible Spectroscopy studies were performed. The results obtained, and shown in chapter 4, indicate that the interaction, if it exists, is non-specific. The several experiments to crystallize human and murine p22HBP, in order to solve their three-dimensional structure in complex with heme and therefore understand heme-p22HBP interaction, are described in chapter 5.
The main conclusions from the present work are drawn in chapter 6 together with the future perspectives.
XIII
Resumo ……….. IX
Abstract ………. XI
Table of Contents ………... XIII
Figures Index ……… XVII
Tables Index ………. XXIII
Equations Index ………... XXV
Abbreviations and symbols ……….. XXVII
Chapter 1 Introduction ……….. 1
1.1. Heme ………... 3
1.1.1. Heme biosynthesis and homeostasis and iron homeostasis in mammals ……….. 3
1.1.2. Heme trafficking ……… 6
1.2. SOUL/HBP family of heme-binding proteins ………... 8
1.2.1. Heme-Binding Protein 2, SOUL ……… 8
1.2.2. Heme-Binding Protein 1, p22HBP ……….. 13
1.3. Bcl-2 family of proteins in cell apoptosis ………. 18
1.3.1. Bcl-2 family of proteins ………... 19
1.3.2. BH3-only proteins ……… 21
1.4. Biomolecular Crystallography ………. 24
1.4.1. Introduction to X-ray Crystallography ……… 24
1.4.2. The ‘bottleneck’ of Macromolecular X-ray Crystallography and data collection ……… 25
1.4.3. The ‘phase problem’ ……… 29
1.4.3.1. Single-wavelength Anomalous Dispersion, SAD ………. 31
1.4.3.2. Molecular Replacement ………...… 35
1.4.4. Model building, refinement and structure validation ……….. 36
1.5. Protein Nuclear Magnetic Resonance……..………40
1.5.1. Basic principles of NMR ……….. 40
1.5.2. Protein NMR techniques and methodologies ……….. 44
1.6. Combining X-ray Crystallography and NMR on the characterization of SOUL/HBP heme-binding family of proteins ………. 53
1.7. Objectives ……….….. 56
Chapter 2 Human SOUL cloning, overexpression and purification ……… 57
2.1. Introduction ………... 59
2.2. hSOUL N-terminal histidine tag fusion protein ………. 61
2.2.1. Materials and methods ………...… 61
2.2.1.1. Overexpression, purification and isotopic labeling….………... 61
2.2.2. Results and discussion ………... 62
2.2.2.1. Overexpression and purification ……….…… 62
2.3. hSOUL C-terminal histidine tag fusion protein ………. 62
2.3.1. Materials and methods ………...……… 62
2.3.1.1. Construction of hSOUL plasmid with C-terminal histidine tag, cloning overexpression, purification and isotopic labeling ………...… 62
XIV
2.4. hSOUL-Intein fusion protein ……….… 66
2.4.1. Materials and methods ………...…… 66
2.4.1.1. Construction of hSOUL plasmid with intein tag, cloning, overexpression, purification and isotopic labeling………... 66
2.4.2. Results and discussion ……….... 67
2.4.2.1. Cloning, overexpression and purification ………...… 67
2.5. Final remarks ………. 69
Chapter 3 Structural characterization of human SOUL by X-ray Crystallography …….71
3.1. Introduction ………... 73
3.2. Materials and methods ……….. 74
3.2.1. Seleno-methione hSOUL derivative ………. 74
3.2.2. Inductively Coupled Plasma-Atomic Emission Spectrometry ………. 74
3.2.3. Size Exclusion Chromatography ……….… 74
3.2.4. Crystallization and data collection ……….. 74
3.2.5. Structure solution, model building and refinement ………. 77
3.3. Results and discussion ………...80
3.3.1. ICP-AES analysis ……….... 80
3.3.2. Crystallization and data collection ………..… 80
3.3.3. Crystal structure of hSOUL ……… 82
3.3.4. Structural similarity of hSOUL to murine p22HBP …….……….... 89
3.3.5. The BH3 domain in hSOUL ………. ………...… 91
Chapter 4 Heme-binding interactions studies on human SOUL ………...……….. 95
4.1. Introduction ………...… 97
4.2. Material and methods ………... 98
4.2.1. Sample preparation and NMR data acquisition and processing ……….… 98
4.2.2. Tetrapyrrole preparation ………. 100
4.2.3. Intrinsic Tryptophan Fluorescence Quenching ………... 100
4.2.4. hSOUL/hemin UV-visible titration ……….. 100
4.3. Results and discussion ……….… 101
4.3.1. Isotopic labelling ………. 101
4.3.2. Protein backbone assignment and Hetero-NOE analysis ... 102
4.3.3. The putative hSOUL heme-binding site ……….……… 109
Chapter 5 Heme-binding interactions studies on p22HBP ……….… 119
5.1. Introduction ………. 121
5.2. Material and methods ……….122
5.2.1. Overexpression and purification of human and murine p22HBP …….….….. 122
5.2.2. Murine and human p22HBP crystallization ……….…. 124
5.2.2.1. Murine p22HBP ………... 124
5.2.2.1. Human p22HBP ………... 124
5.3. Results and discussion ………. 126
5.3.1. Murine p22HBP ………. 126
XV
6.2. Future perspectives ………..…… 134
References ……….... 135
XVII
http://met.fzu.edu.cn/cai/shenghua/resource/biochem/ch07/heme.htm). Iron protoporphyrin IX representation. ... 3 Figure 1.2 Heme biosynthesis pathway (adapted from [3]). Mammalian heme biosynthesis pathway scheme The process occurs in the mitochondria (blue rectangle) and the cell cytosol.
……… 4
Figure 1.3 Multi-sequence alignment of human (hSOUL), murine (mSOUL) and chicken (ckSOUL) heme-binding protein 2 with human (hHBP) and murine (m2HBP) heme-binding protein 1 using ClustalW [23]. hSOUL His42, possible axial ligand of Fe (III) heme and the
BH3 domain are indicated. ………... 9
Figure 1.4 Diagram of the proposed mechanism of hSOUL protein (from [32]). In the presence of specific Ca2+ concentrations, SOUL protein induces permeability transition leading to the loss
of the mitochondrial membrane potential. Bcl-2 or Bcl-xL prevents this process, indicating the direct effect of SOUL on the mitochondrial permeability transition pore (mPTP). …………... 12 Figure 1.5 Representative structures of human and murine p22HBP complexed with PPIX and hemin (from [19]) (a) murine p22HBP + hemin, (b) human p22HBP + hemin, (c) murine p22HBP + PPIX, (d) human p22HBP+PPIX. The protein is rendered in cartoon with key side chain residues rendered in sticks, with the corresponding residue name.
………...……….. 16 Figure 1.6 Caspases as responsible agents for cellular organelles demolition (from [45]). Caspases activity leads to the destruction of cellular organelles such as the Golgi complex (caspases provoke the cleavage of the Golgi-stacking protein GRASP65 and other Golgi proteins) and endoplasmatic reticulum. Caspase-mediated cleavage of nuclear lamins weakens the nuclear lamina, allowing nuclear fragmentation, and nuclear envelope proteins are also proteolysed. Caspases are then responsible for the cleavage of the constituents of the cytoskeleton and subsequent dynamic membrane blebbing. ……….. 19
Figure 1.7 Bcl-2 family of proteins. The anti-apoptotic members of this family contain all four homology domains (1-4). The pro-apoptotic BAX-like subfamily lacks BH4 domain and promotes apoptosis by forming pores in mitochondrial outer membranes. The BH3-only subfamily is a structurally diverse group of proteins that only display homology within the small BH3 motif. A great number of the members of this family contain a transmembrane domain
(TM) (from [45]). ………...……… 20
Figure 1.8 Domain structures of some BH3-only-like proteins. Example of BH3-like proteins and corresponding domain functions (adapted from [58]). ……… 22
Figure 1.9 Crystallization diagram (from [61]). The light blue circles represent water molecules and the dark blue ovals represent precipitant molecules. As general rule, higher saturation will promote spontaneous formation of stable crystallization nuclei (homogeneous
nucleation). ………. 26
Figure 1.10 Bragg’s law graphical interpretation. The Bragg’s law can be graphically interpreted allowing the understanding of an X-ray experiment as the reflection on a set of imaginary planes in the crystal. ……….. 30
Figure 1.11 Two-dimensional representation of a structure factor. The vector length is equal to
the amplitude of the structure factor and φ is the phase angle of the structure factor.
XVIII
two circles will give the two possible phase angles, φ1 or φ2. At this stage it is not possible to
determine which of the two, φ1or φ2, is the correct angle. ……… 32 Figure 1.13 The classical MIR case of breaking phase ambiguity. Drawing the third circle (FPA2) solves the phase ambiguity as the interception of the three circles (1) determines the
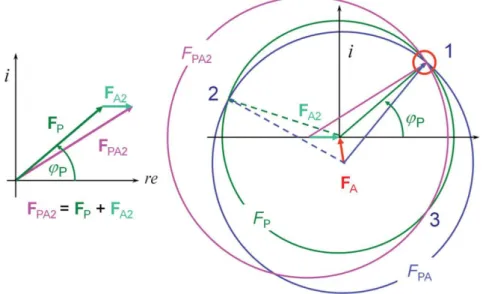
previously unknow phase angles, φP. ………...……….. 33 Figure 1.14 Graphical SAD phasing equations solution (from [61]). The magnitudes of the structure factors, FPA+ and FPA- are known as well as the position of the anomalous scatterer and
as a consequence FA+ (or FA-). Like in the SIR case, only one of the phase angle (φP) is correct.
………. 34 Figure 1.15 Variation of the difference Rfree-R (from [61]). The mean value difference between
Rfree and R is plotted in red full squares as a function of structure resolution (data extracted from the Protein Data Bank, PDB, http://www.pdb.org/pdb/home/home.do).
………..…... 38 Figure 1.16 Time scales of some important molecular dynamic processes and multidimensionl NMR methods available to study these processes. Recent developments in NMR spectroscopy techniques made it a very important technique for the understanding of some of the most important dynamic processes in the cell such as, for instance, protein folding and enzyme
kinetics. ………...… 44 Figure 1.17 Standard heteronuclear NMR experiments for protein backbone assignment (adapted from http://rmni.iqfr.csic.es/guide/eNMR/eNMR3Dprot/ ). HNCO correlates 15N-1H pair of one residue with the carbonyl (13CO) resonance of the preceding residue. The HNCA
experiment correlates the 15N and HN chemical shifts with the intra- and inter-residue 13CA
carbon shifts. The HN(CO)CA correlates the 15N and HN chemical shifts with the inter-residue 13CA carbon shifts. The HN(CA)CO correlates the inter- and intra-residue backbone
connectivities between the amide 15N-1H pair and the carbonyl 13CO resonance. The HNCACB
spectrum correlates the 15N-1H pair with the intra- and inter-residue 13CA and 13CB carbon
shifts. Finally, the HN(CO)CACB correlates the 15N-1H pair with the intra-residue 13CA and 13CB. ………..……. 47 Figure 1.18 TROSY effect on the transverse relaxation time,T2, and line widths (adapted from
[92]). Schematic representation of the TROSY effect on the transverse relaxation time, T2, and
peak’s line width. In a) the NMR signal from a small molecule relaxes slowly having a long transverse relaxation time (T2) which gives raise to narrow line widths after Fourier
transformation. In larger molecules (b), the T2 is smaller which results on weaker signals and broader lines. With the TROSY technique (c), an improvement in signals intensity and spectral sensitivity and resolution is observed. ……… 48 Figure 1.19 Maximum NOE and ROE obtainable in NOESY (solid line) and ROESY experiment
(dashed line). ……….. 50
Figure 1.20 Flow chart with some of the more important protein NMR experiments. Depending on the protein size, homonuclear or heteronuclear experiments must be performed to do the protein backbone assignment. With this, 2D 1H, 15N HSQC/TROSY-HSQC spectra can be
acquired upon ligand or protein addition to study protein-ligand and/or protein-protein interactions. Protein relaxation studies can be performed to determine protein relaxation, namely the hetNOE values and T1 and T2 time constants, for example. Protein structure determination is
achieved using the distance and orientation restraints [95, 100]. ………...……… 51 Figure 1.21 Number of structures deposited in the Protein Data Bank (PDB,
XIX
May 2012). ………….……… 53
Figure 1.22 Schematic diagram of theoretical expected 1H, 15N-HMQC spectrum of the imidazole-ring of the three possible protonation states of a histidyl residue (from [103]). …... 55 Figure 2.1 Purification of overexpressed hSOUL (histidine tag). a) SDS-PAGE (15 % acrylamide) analysis of the different fractions obtained from the Ni-NTA Agarose column: 1 –
insoluble fraction 2 – soluble fraction loaded on the Ni-NTA resin; M - Precision Plus Protein Unstained Standards - 10, 15, 20, 25, 37, 50, 75, 100, 150 and 250 kDa (Biorad); 3 – flow-through; 4 – resin wash with 10 mM imidazole; 5 - resin wash with 20 mM imidazole; 6 –
hSOUL elution with 250 mM imidazole; 7 – hSOUL elution with 500 mM imidazole. b) Elution profile obtained from the gel filtration column (Superdex 75) loaded with hSOUL fractions (6+7) from Ni-NTA Agarose resin. ……… 62 Figure 2.2 Purification of overexpressed hSOUL (C-terminal histidine tag). SDS-PAGE (15 % acrylamide) analysis of the different fractions obtained from the Ni-NTA Agarose column: M - SpectraTM Multicolor Broad Range Protein Ladder (LadAid); 1 – flow-through; 2 – resin wash
with 10 mM imidazole; 3 - resin wash with 20 mM imidazole; 4 – hSOUL elution with 75 mM imidazole; 5 – hSOUL elution with 250 mM imidazole. hSOUL protein band is identified in the
black rectangle. ………...………… 64
Figure 2.3 Purification of overexpressed hSOUL. SDS-PAGE (15 % acrylamide) analysis of the different fractions obtained from the Sephacryl S-200 resin equilibrated with 50 mM phosphate buffer pH 8.0: M – Molecular weight markers (Fermentas®); 1 - 8 - collected
samples. ………..… 65
Figure 2.4 SOFAST 1H, 15N- HSQC spectrum of C-terminal his tagged hSOUL. 0.3 mM 15 N-labeled hSOUL sample spectrum acquired on a 600 MHZ NMR spectrometer with cryoprobe, at
293 K. ……….… 65
Figure 2.5 1H, 15N- HSQC spectrum of C-terminal his tagged hSOUL. 0.3 mM 15N-labeled hSOUL sample spectrum acquired on a 600 MHZ NMR spectrometer with cryoprobe, at 293 K.
……….… 66
Figure 2.6 Purification of overexpressed hSOUL. SDS-PAGE (15 % acrylamide) analysis of the different fractions obtained from the chitin beads column: M – Protein Marker (NZYTech, genes enzymes, Ltd NZYTech); 1 – insoluble fraction; 2 –soluble fraction loaded on the chitin beads resin; 3 – flow-through; 4 – washing column step; 5 – after DTT addition; 6 – hSOUL elution. hSOUL protein band is identified by the orange circle. ……… 68 Figure 3.1 Self-rotation function. ………..……… 77 Figure 3.2 Native Patterson map. Patterson map of hSOUL where pseudo-translational symmetry was detected due to the strong off-origin peak. ………. 78 Figure 3.3 Selenium K-edge fluorescence scan. Anomalous and dispersive Se scattering factors across the K edge derived from fluorescence scan at beamline ID23-EH1, ESRF. …...……….79 Figure 3.4 hSOUL protein crystal. hSOUL (histidine tag) protein diffracting crystal belonging to the space group P6422 and cell unit a = b = 144.7 Å, c = 60.2 Å, grown in 2M ammonium
sulphate, 0.1M MES 6.5. ……… 81
Figure 3.5 Se-Met protein crystal. Protein diffracting crystal belonging to the space group P6222 and cell unit a = b = 146.4 Å, c = 133.0 Å, grown in 1.8M Na/K phosphate buffer pH
XX
difference Fourier map, confirming the selenium positions and corresponding seleno-methionine residues. The anomalous difference Fourier map, calculated from the anomalous contribution of selenium atoms at wavelength of 0.9793 Å, is shown in yellow and contoured at 2 σ. Picture was produced with program CHIMERA [125]. ……….…………. 84 Figure 3.7 X-ray structure of Se-SAD-hSOUL. The central core of the protein consists of an eight-stranded antiparallel β-sheet surrounded by two α-helices .………. 86 Figure 3.8 Ribbon representations of hSOUL sub-domains. a) hSOUL representation with the 2 sub domains identified: Glu39-Tyr110 (blue) and Val127-Ile195 (magenta); b) Superposition of the 2 sub-domains with ---- motif, in result of gene duplication. ……….... 87 Figure 3.9 Molecular weight of various proteins (green circles; MW = 78.5, 66.5, 16.9 and 13.7 kDa) as a function of the elution volume of gel filtration in order to determine the oligomerization state of apo-hSOUL (blue square) and hemin/hSOUL (red triangle). In addition, apo-murine p22HBP (orange diamond) was used as a control protein. hSOUL (25.1 kDa), hemin/hSOUL (26.7 kDa) and murine p22HBP (23.4 kDa) molecular weights were estimated according to the elution volume on the gel filtration, showing that the three proteins are eluted as monomers. Experiments were performed in 100 mM phosphate buffer, pH=8, on a Superdex 75-10/300 GL column (GE Healthcare, pre-packed coupled to a FPLC system).
……….……… 88 Figure 3.10 Overlay of hSOUL X-ray structure and murine p22HBP solution structure. In orange, solution structure of murine p22HBP and in blue hSOUL structure (monomer A). The two loops that show more significant differences regarding murine p22HBP structure are
highlighted in forest green.
………. 89 Figure 3.11 Electrostatic surface potential for murine p22HBP (calculated using APBS [127]
at pH 8.0). ………...……… 90
Figure 3.12 Electrostatic surface potential (calculated using APBS [127] at pH 8.0) for the hSOUL monomer structure, viewed in 2 perpendicular orientations. A significantly more negative surface is visible on the right side representation, which is rotated 180º with respect to the orientation in figure 3.7, which is highly solvent exposed when the crystal packing is
considered. ……….. 90
Figure 3.13 Comparison of the BH3 domain of hSOUL protein with members of the Bcl-2 family of proteins. Black-shaded amino acids are identical, grey-shaded amino acids are conserved substitutions, and light gray-shaded amino acids are semiconserved substitutions
(adapted from [32]). ……… 91
Figure 3.14 The BH3 domain on hSOUL. In magenta the BH3 domain consisting of part of
helix α2 and the following loop. ………. 92
Figure 3.15 Example of a BH3 domain bound to pro-survival proteins of the Bcl-2 family of proteins. a) Bax BH3 peptide (chain C, forest green) bound to Bcl-2 (chain A, pink) through residues Glu61, Arg64, Asp68, Glu69 and Arg78 of the BH3 peptide [131].
………. 92
Figure 4.1 1D 1H NMR spectra of hSOUL. Double labeled (13C, 15N) sample spectrum - blue and triple labeled (2H, 13C, 15N) sample spectrum - red, acquired on a 600 MHz with cryoprobe,
XXI
………..……….… 103 Figure 4.4hSOUL protein backbone assignment. Residues in red were not assigned. Prolines, that could not be assigned with the NMR spectra acquired, are represented in blue. Secondary
structure elements observed in the crystal structure of hSOUL (α-helices in red and yellow, β -sheets in light blue) are shown with ribbon representation, above the corresponding amino acids. Right and left panel numbering represent the aminoacid position from the first and last residue
in each row. ………...………… 104
Figure 4.5Region of the trHNCACB 2H, 13C, 15N-hSOUL spectrum. Sequential assignments of the resonances from residue Tyr38 to Tyr43 using the 3D trHNCACB spectrum. ………..…105 Figure 4.6 hSOUL protein secondary structure schematic representation. hSOUL protein sequence with secondary structure from X-ray crystal structure – PDB code 4ayz (Crystal
structure) and from TALOS+ server (NMR prediction). β-sheet (green) and α-helix (red) are
cartoon represented.
……… 107 Figure 4.7 {1H}-15N-NOE values plotted as a function of hSOUL protein sequence. Red bars
correspond to amino acids in α-helices, green bars correspond to amino acids belonging to β -sheets and blue bars correspond to amino acids corresponding to regions displaying no secondary structure. The NOE uncertaintanties are represented by the error bars in the graphic. Besides the residues that could not be assigned (Met1, Asp8, Ala19, Glu29, Gln34, Gly36, Ser37, Gly44, Met56, Glu94, Gly96-Phe98, Ser103, Ile111, Ser113, Arg121, Leu123, Glu124, Val127-Phe128, Arg132, Phe145, Tyr179, Asn187, Leu194-Gln196, Thr201-Lys202, Glu205 and prolines) the hetero-NOE values are not shown for residues Lys47, Asn77, Thr90, Leu109, Lys110, Gln115, Phe138, Leu156, Ala 159, Asn189, Glu191, Lys 197 and Glu 203. The dashed line ({1H}-15N- NOE = 1) represents the theoretical maximum value for {1H}-15N- NOE. ....108 Figure 4.8 Closer view of the side chain of His42. The simulated annealing omit map (calculated with program phenix.refine from the PHENIX package and contoured at 1 σ) is shown in green superimposed with the 2mFo-DFc difference Fourier map (shown in blue),
contoured at 2 σ. ……….……….. 110
Figure 4.9 1H, 15N HSQC spectra, centered on the histidine side chain Nδ proton region. a) hemin-15N-hSOUL at molar ratio of 0.5 (green), 1:1 (yellow), 2:1 (orange), 5:1 (red) and 15
N-hSOUL alone (blue). b) PPIX:15N-hSOUL at molar ratio of 1:1 (yellow) , 5:1 (green) and 15
XXII
imidazole; b) Elution profile obtained from the gel filtration column (Superdex 75) loaded with human p22HBP fractions (8+9) from Ni-NTA Agarose resin.
………..………. 122 Figure 5.2 Salt crystals. Crystals obtained in a) 0.2 M calcium chloride, 0.1 M acetate buffer 4.5, 30 % 2-methyl-2,4-pentanediol and b) 0.2 M calcium chloride, 0.1 acetate buffer 4.5, 20 % isopropanol, in crystallization trials with murine p22HBP (apo form), at 293 K.
XXIII
nuclei in the study of biomolecules and polymers with the corresponding gyromagnetic constant,
γ, nuclear spin quantum number, I, and natural abundance.……….………... 41 Table 3.1 Se atoms coordinates, occupancies, figure-of-merit (FOM), f’ and f” values.…….. 83 Table 3.2 Data collection and refinement statistics. Data collection and structure refinement statistics (values in parentheses are for the lowest/highest resolution shells). ……… 85 Table 4.1 hSOUL NMR experiments. hSOUL NMR spectra parameters, including FID size, number of scans, spectral width and corresponding pulse program, acquired for backbone
assignment. ……….. 98
Table 4.2hSOUL secondary structure from X-ray structure and predicted from NMR data (NH,
Cα, Cβ and CO chemical shifts).………...……… 106
Table 4.3 Dissociations constants for the complexes, Kd (and error associated with the
measuerements, ∆Kd) hSOUL:hemin/PPIX, human p22HBP:hemin/PPIX, murine
XXV
observations for a given reflection, h, and ̅̅̅̅̅( ) is the averaged intensity of each reflection. …. 29
Equation 1.2 Redundancy-independent merging R-value. N is the total redundant observations for a given reflection, h. ̅̅̅̅̅( ) is the averaged intensity of each reflection. ………. 29
Equation 1.3 Precision-indicating merging R-value, Rpim. For a given reflection, h, N redundant
observations are considered. The average intensity of each reflection is given by ̅̅̅̅̅( ). ……… 29
Equation 1.4 Bragg’s Law. In Bragg´s law, n is an integer, λ is the wavelength of the incident wave, d is the spacing between the planes in the atomic lattice, and θ is the angle between the
incident ray and the scattering planes. ……… 29
Equation 1.5 Complex structure factor. ………. 30 Equation 1.6 Electron density distribution. x, y, z are the fractional grid positions coordinates.
1/V is the normalized factor, with the unit cell dimensions defined in Å. ……..……… 31
Equation 1.7 Measured intensity of a generic reflection, h. ………..… 31 Equation 1.8 Real space electron density. Electron density definition for a general position
vector, r. ……….. 31
Equation 1.9 R-factor equation. R factor for a given reflection, h. Fobs and Fcalc are the observed
and calculated structure factors, respectively. ………. 36
Equation 1.10 Structure factor definition. The structure factor, Fh, is therefore a summation of
partial waves of j atoms with scattering factor fjat position xj. ……….. 37
Equation 1.11 Rfree equation. Before the first cycles of refinement a percentage of experimental
data is excluded and used to calculate the Rfree. ………..……….... 37 Equation 1.12 Rwork equation. After every round of model building, completion and addition of
parameters will make both Rfree and Rwork to convergence as the model becomes more complete
and accurate. ……… 37
Equation 1.13 Real space correlation coefficient, RSCC. Correlation between the observed
electron density map, ρ(r)obs, and the calculated electron density map, ρ(r)calc. ……….. 39 Equation 1.14 Nuclear spin magnetic moment. This equation defines the magnetic moment of a nuclear spin, µ, which is related to the nuclear spin quantum number, I, and with a
proportionality constant, γ, the gyromagnetic constant. ………. 40
Equation 1.15 Boltzmann equation. Equation describing the population distribution of two energy states, where Nα and Nβ are the populations of the α and β states, respectively, T is the absolute temperature, k is the Boltzmann constant, h the Planck constant and B0 the magnetic
field. ……… 41
Equation 1.16Magnetic field at a given nucleus. σ represents the degree of shielding and B0 the
strength of the applied magnetic field. ……… 42
Equation 1.17 Larmor equation. ωs is the resonance frequency of the shielded nucleus and is
equal to γ, the gyromagnetic constant, multiplied by the strength of the magnetic field at the
nucleus. …….………...……… 42
Equation 1.18 Cross-relaxation rate. ( ⁄ ) ⁄ , γI and γS are the gyromagnetic
ratios for nuclei I ans S, rIS is the internuclear distance, ωI and ωS are the Larmor precession
frequencies of nuclei I and S, and τc is the correlation time of the ISvector. ………. 49 Equation 1.19 Cross-relaxation rate between two nuclei, I and S.………...……… 49 Equation 1.20 Distance between two nuclei (I and S), rIS. ……….………... 49
Equation 1.21 Dipolar coupling Hamiltonian. Hamiltonian of two spins, I and S, dipolar coupling, where h is the Planck constant, γ is the gyromagnetic ratio, r is the inter-spin distance,
XXVI
without proton saturation, respectively. ………..……… 51 Equation 1.23 {1H}-15N-NOE uncertainties determination. Isat and Iunsat are the peak intensities
with and without proton saturation, respectively, and ∆Isat and ∆Iunsat the corresponding
uncertainties. ………... 51 Equation 4.1 Kd determination equation. The protein emission maxima (y) are plotted as a
function of porphyrin concentration (x). I0 and Iint are the intensities at zero and saturating
XXVII
ABCG2 (ATP)-binding cassette sub-family G member 2 ADP Anisotropic displacement parameter
ALA 5-aminolevulic acid
ALAD Aminolevulic acid dehydratase ALAS Aminolevulic acid synthase ALAS 1 Aminolevulic acid synthase 1 ALAS 2 Aminolevulic acid synthase 2
Bcl-2 B-cell lymphoma-2
BCRP Breast Cancer Resistance Protein
bp Base pair
cAMP 3'-5'-cyclic adenosine monophosphate
CBD Chitin binding domain
cDNA Complementary desoxiribonucleic acid
CO Carbon monoxide
COPRO’GEN III Coproporphyrinogen III COSY Correlation Spectroscopy
CPI Coproporphyrin I
CPIII Coproporphyrin III
CPO Coproporphyrinogen oxidase
Cryo-EM Cryo-Electron Microscopy
CSA Chemical shift anisotropy
CSI Chemical shift index
DCs Dendric cells
DNA Deoxyribonucleic acid
DTT Dithiothreitol
EDTA Ethylenediamine tetraacetic acid
EMBL The European Molecular Biology Laboratory EPR Electron Paramagnetic Resonance
ESR Electron Spin Resonance
ESRF European Synchrotron Radiation Facility
FECH Ferrochelatase
FID Free induction decay
FLVCR Feline Leukaemic Virus Receptor
FOM Figure of merit
FPR Formyl peptide receptor
FPRL FPR-like receptor
FPRL 1 FPR-like receptor 1 FPRL 2 FPR-like receptor 2
FQ Fluorescence Quenching
GFP Green fluorescence protein
Grx Glutaredoxin
Grx3 Glutaredoxin 3
Grx4 Glutaredoxin 4
GST Glutathione S-transferase
XXVIII
HEPES 4-(2-hydroxyethyl)-1-piperazineethanesulfonic acid p22HBP Heme-binding protein 1
HMB Hydroxymethylbilane
HO Heme oxygenase
HO-1 Heme oxygenase 1
HO-2 Heme oxygenase 2
HMQC Heteronuclear Multiple Quantum Coherence HSQC Heteronuclear Single Quantum Coherence
ICP-AES Inductively Coupled Plasma-Atomic Emission Spectroscopy IMAC Immobilized metal affinity chromatography
IPTG Isopropyl β-D-1-thiogalactopyranoside
IRP Iron-regulatory protein
LB Luria Broth
MAD Multiple-wavelength Anomalous Diffraction MES 2-(N-morpholino)ethanesulfonic acid MIR Multiple Isomorphous Replacement
MIRAS Multiple Isomorphous Replacement with Anomalous Signal mMP Mitochondrial membrane potential
MOPS 3-(N-morpholino)propanesulfonic acid mPT Mitochondrial permeability transition mPTP Mitochondrial permeability transition pore
MR Molecular Replacement
mRNA Messenger ribonucleic acid
NCS Non-crystallographic symmetry
NMR Nuclear Magnetic Resonance
NOE Nuclear Overhauser Effect
NOESY Nuclear Overhauser Effect Spectroscopy
OD Optical density
ORF Open-reading frame
PAGE Polyacrilamide gel electrophoresis
PEG Polyethylene glycol
PBD Peripheral blood cells
PBG Porphobilinogen
PBGD Porphobilinogen deaminase
PCR Polymerase chain reaction
PDB Protein data bank
PPIX Protoporphyrin IX
PPO Protoporphyrinogen oxidase
PROTO’GEN IX Protoporphyrinogen IX
Prx Peroxiredoxin
Prx I Peroxiredoxin I
RA Rheumatic arthritis
RCS Ring current shift
RDC Residual dipolar coupling
rmsd Root-mean square deviation
XXIX
SAD Single-wavelength Anomalous Dispersion SEC Size exclusion chromatography
SIR Single Isomorphous Replacement
SIRAS Single Isomorphous Replacement with Anomalous Signal
SLC Solute carrier
SOUL Heme-binding protein 2
SPR Surface Plasmon Resonance
STD Saturation Transfer Diference
TB Terrific Broth
Tfr1 Transferrin-receptor 1
TM Transmembrane domain
TNF Tumor necrosis factor
TOCSY Total Correlation Spectroscopy Tris Tris-(hydroxymethyl)-aminomethane
TROSY Transverse Relaxation-Optimized Spectroscopy TrR1 Transferrin-receptor 1
URO3S Uroporphyrinogen III synthase UROD Uroporphyrinogen Decarboxylase
URO’GEN III Uroporphyrinogen III
UV Ultraviolet
VDAC Voltage-dependent anion channel
Δψ Mitochondrial membrane potential
Kd Dissociation constant
2 CONTENTS
Page
1.1. Heme 3
1.1.1. Heme biosynthesis and homeostasis and iron homeostasis in mammals 3
1.1.2. Heme trafficking 6
1.2. SOUL/HBP family of heme-binding proteins 8
1.2.1. Heme-binding protein 2, SOUL 8
1.2.2. Heme-binding protein 1, p22HBP 13
1.3. Bcl-2 family of proteins in cell apoptosis 18
1.3.1. Bcl-2 family of proteins 19
1.3.2. BH3-only proteins 21
1.4. Biomolecular Crystallography 24
1.4.1. Introduction to X-ray Crystallography 24
1.4.2. The ‘bottleneck’ of Macromolecular X-ray Crystallography and data
collection 25
1.4.3. The ‘phase problem’ 29
1.4.3.1. Single-wavelength Anomalous Dispersion, SAD 31
1.4.3.2. Molecular Replacement 35
1.4.4. Model building, refinement and structure validation 36
1.5. Protein Nuclear Magnetic Resonance 40
1.5.1. Basic principles of NMR 40
1.5.2. Protein NMR techniques and methodologies 44
1.6. Combining X-ray Crystallography and NMR on the characterization of
SOUL/HBP heme-binding family of proteins 53
3 1.1.HEME
Heme or iron protoporphyrin IX (PPIX) is a prosthetic group consisting of an iron atom in the center of a large heterocyclic organic ring, porphyrin – figure 1.1.
Figure 1.1 Heme (adapted from http://met.fzu.edu.cn/cai/shenghua/resource/biochem/ch07/heme.htm).
Iron protoporphyrin IX representation.
Heme plays a vital role in many biological processes such as O2 transport by hemoglobin, O2
storage by myoglobin,electron transfer by cytochromes and activation of the O-O bond by P450 enzymes and peroxidases. It is, therefore, an essential molecule to all aerobic organisms.
In erythroid cells, heme synthesis regulation is mediated by erythroid-specific transcription factors and by the bioavailability of Fe in the form of Fe/S clusters. However, in non-erythroid cells, this pathway is regulated by heme-mediated feedback inhibition.
Heme is synthesized in all nucleated cells and the cellular levels of heme are tightly regulated by enzymatic synthesis and degradation processes [1].
The main catabolic pathway of heme is catalyzed by Heme oxygenase - HO (E.C. 1.14.99.3), which is itself a heme protein. The reaction catalyzed by HO leads to the production of carbon monoxide (CO) and biliverdin and to the concomitant iron release [2].
1.1.1. HEME BIOSYNTHESIS AND HOMEOSTASIS AND IRON HOMEOSTASIS IN MAMMALS
In mammals, heme synthesis (figure 1.2) occurs mainly in developing erythroid cells (approximately 85%), hepatocytes and muscle cells, and can be divided in four main stages –
4
Figure 1.2 Heme biosynthesis pathway (adapted from [3]). Mammalian heme biosynthesis pathway
scheme. The process occurs in both mitochondria (blue rectangle) and cell cytosol.
The first step of this pathway takes place in the mitochondria and consists of the condensation of glycine and succinyl-CoA to form aminolevulinic acid (ALA), a reaction catalyzed by 5-aminolevulinic acid synthase - ALAS (EC 2.3.1.37) and is the rate limiting reaction of this metabolic pathway. ALA is the earliest common precursor of heme biosynthesis in all species, including eukaryotes, archaea and bacteria. Aminolevulinic acid synthase exists in two isoforms, ALAS 1 (ubiquitously expressed) and ALAS 2 (only expressed by erythroid precursors), with each isoform having the same reaction mechanism but different regulation. Aminolevulinic acid is then converted to porphobilinogen (PBG), which gives hydroxymethylbilane (HMB), a polymer of 4 molecules of PBG, in a reaction catalyzed by porphobilinogen deaminase (EC 2.5.1.61). This unstable tetrapyrrole is then converted into
uroporphyrinogen III (URO’GEN III) by uroporphyrinogen III synthase (EC 4.2.1.75).
URO’GEN III represents a branch point for the pathways of heme synthesis, and also for chlorophyll and corrins synthesis.
5
of the inner membrane of the mitochondria, iron is inserted into the protoporphyrin IX by ferrochelatase (EC 4.99.1.1) [3].
Once synthesized, heme is immediately exported to the outside of the mitochondria into the cytosol and endoplasmic reticulum and associates with apo-hemoproteins.
Heme can reversibly bind oxygen and is highly reactive to various compounds due to its capacity of exchanging electrons and activating oxygen. The reactivity of heme with oxygen can lead to toxic effects as this interaction can cause the destruction of the porphyrin rings by hydroxyl radicals. On the other hand, due to its insolubility, heme is thought to chelate transiently to amino acids, peptides or proteins while it is transported, (see chapter 1.1.2 for more details) [4].
An important regulator of heme intracellular level is heme oxygenase (enzyme with two isoforms, HO-1 and HO-2), a rate-limiting enzyme of the heme catabolic pathway. It is proposed that heme, once degraded by HO-1, is exported out of the cell by the iron-efflux protein, ferroportin [5-7]. HO-1 is an inducible isoenzyme whose expression is up-regulated by its substrate and oxidative stress. Induction of HO-1 by hemin is associated to the increased level of translated and hybridizable HO-1 mRNA. HO-2 is thought to be a constitutive enzyme, which is expressed under homeostatic conditions. Both isoforms, HO-1 and HO-2 are ubiquitously expressed and catalytically active [8-10].
Due to the biological importance of heme, iron homeostasis must also be a very tightly regulated process. Most of the iron in the organism is targeted to the mitochondria, where it is readily used for heme biosynthesis in erythroid cells but also for the synthesis of iron-sulfur clusters. However, metabolism of mitochondrial iron can be independent of heme biosynthesis since the uptake of iron by mitochondria is observed even when heme synthesis is stopped. The trafficking of iron to mitochondria is still a not well understood process. However, two conserved cytosolic glutaredoxins, Grx3 and Grx4, have been identified as very important proteins in iron intracellular sensing and trafficking. One clear fact is that the solute carrier (SLC) mitoferrin (also known as SLC25A37), located in the inner mitochondrial membrane, is required for the entrance of iron into the mitochondria [11].
6
taken up into the cells by transferrin-receptor 1 (TfR1). Ferritin is an important protein in iron regulation as it can store and detoxify the excess intracellular iron in the cytosol. The protein has two subunits, H (heavy) and L (light), and folds in a shell-like structure, providing the capacity of Fe3+ storage in the form of ferric oxy-hydroxide phosphate.
1.1.2.HEME TRAFFICKING
Heme is highly insoluble and can be very toxic to the cells. Therefore, it is present in the intracellular environment in very low concentrations, usually less than 10-9 M and a wide range
of proteins have been proposed to transiently bind and transport this molecule.
The mechanisms of intracellular heme channeling have not yet been totally elucidated, but a number of proteins have been characterized based on their ability to bind heme. For example, different isoforms of glutathione S-transferase (GST) have been considered as intracellular carriers of heme to the endoplasmic reticulum. A number of other heme binding proteins have been characterized that can serve as heme carriers although the role they play is still unknown. Among them, Heme Binding Protein 23, HBP23 (or peroxiredoxin I, prx I) although binding heme, has as main function protecting cells from oxidative stress. In addition, the HBP23/Prx I is proposed to be an antioxidant and tumor suppressor, though, the relation to heme binding activity is not known [12]. Other peroxiredoxins (Prxs, EC 1.11.1.15) can also bind heme, although they possess peroxidase activity, which is heme independent. Heme-binding protein 1, or p22HBP, is a cytosolic protein with high binding affinity for heme but its role in heme trafficking remains unknown [13]. It has been proposed that this protein can act as a heme transporter or even as a heme buffer protein. More recently, the protein was found to be part of a complex (complex III) that is involved in hemoglobin biosynthesis [14].
Recently, two heme exporters from maturing erythroid cells were reported: Feline Leukaemic Virus Receptor (FLVCR) and heme-efflux protein ABCG2 (also known as BCRP – Breast Cancer Resistance Protein).
FLVCR was cloned from a human T-lymphocyte cDNA libray and was shown to be essential in erythropoiesis, a process by which red blood cells (erythrocytes) are produced. This process is stimulated when a decrease in O2 levelsin circulation is detected by the kidneys, which then
secrete the hormone erythropoietin. This hormone stimulates proliferation and differentiation of red blood cells precursors, which activates increased erythropoiesis in the hemopoietic tissues, ultimately producing red blood cells. FLVCR transporter is upregulated when heme synthesis increases and down-regulated when globin synthesis increases.
7
drugs. Besides this function, ABCG2 is also proposed to be involved in PPIX transport; the accumulation of PPIX in red blood cells of Abcg2-/- mice (mice where the gene of ABCG2
transporter is not expressed) and the up-regulation of ABCG2 during erythroid maturation (cells treated with DMSO in order to induce erythroid differentiation show high levels of ABCG2 mRNA in comparison to cells where erythroid differentiation was not induced) suggests that ABCG2 may be important in decreasing the cellular levels of PPIX. Additional experiments were designed, showing that the overexpression of the ABCG2 transporter lead to the decrease in the level of both exogenous and endogenous PPIX [15].
Both classified as ‘stress proteins’, FLVCR and ABCG2 seem to function similarly by getting rid of the excess of toxic heme or porphyrins during early and later stages of hematopoiesis –
formation of blood cellular components, derived from hematopoietic stem cells. The activity of these two proteins may act as a supplement for HO-1 activity in bone marrow, where the requirement for oxygen by HO-1 might partially limit heme degradation in the physiological hypoxic conditions of the marrow [16].
8
1.2.SOUL/HBP FAMILY OF HEME-BINDING PROTEINS
Using two-tissue subtractive hybridization technique together with database searches, Zylka et al detected in domestic chicken Gallus gallus high levels of expression of a novel gene in retina and pineal gland, that was designated as chicken Soul (ckSoul) [17]. Analysis of the resulting protein sequence allowed the identification of two similar proteins in mammals - murine p22HBP (mHBP) and murine SOUL (mSOUL). These three proteins were grouped in a new evolutionary conserved protein family – SOUL/HBP heme binding family of proteins, which also include human SOUL (hSOUL) and human p22HBP (hHBP). SOUL/HBP proteins are ubiquitous in nature, with bacterial, archaeal and eukaryotic representatives. Regarding the heme binding mechanism of these proteins, Taketani et al suggested the presence of a hydrophobic domain in murine p22HBP important in heme binding [13]. Sequence analysis shows that human p22HBP and ckSOUL also present this hydrophobic domain, which is not present in mSOUL and hSOUL. They have instead 3 charged amino acids in this region [17]. Further NMR and molecular dynamics studies brought important insights about the mechanism of heme binding in murine p22HBP and human p22HBP (discussed in detail in chapter 1.2.2) [18, 19]. In this thesis, structural information on hSOUL was obtained and heme binding to the protein was studied. Until now, no clear function aside from heme-binding is attributed to SOUL/HBP family members.
1.2.1.HEME-BINDING PROTEIN 2,SOUL
In 1999, Zylka et al, by a combination of two-tissues suppression hybridization technique and database searches discovered a putative heme-binding protein (hebp2), SOUL, in chicken’s retina and pineal gland (Northern blot studies showed high transcript levels of this protein in the pineal gland, an organ conjectured by Rene Descartes as the location of human soul; as a consequence, the protein was henceforth designated as SOUL protein) [17]. As the two mentioned tissues studied are involved in circadian clock mechanism, SOUL protein was immediately associated with this biological process. However, on further studies no detection of mSOUL in the suprachiasmatic nucleus (region in the brain's midline, responsible for controlling circadian rhythms) was observed, suggesting that the protein is not important for generating circadian rhythms. SOUL is mainly localized in the cytosol with much lower concentration in the mitochondria. No presence in the nucleus has been detected [17].
9
Sato et al, in 2004, performed the first biochemical studies to characterize the SOUL protein. Studies on the heme binding properties of SOUL revealed that the protein specifically binds one heme per monomer; moreover, gel filtration analysis showed that apo SOUL exists as a dimeric protein becoming hexameric upon heme-binding. Analyzing the optical absorption spectrum of Fe(II) SOUL, three peaks could be observed at 422, 527 and 558 nm corresponding to a 6-coordinate low-spin heme with a 5-6-coordinate high-spin heme. The Soret peak of Fe(II)-CO complex of SOUL located at 418 nm rather than at 450 nm suggests the proximal ligand to be an Histidine (His 42, the only histidine present in the sequence of mouse and human SOUL). These results were confirmed by Raman spectroscopy studies. In addition, H42A mutant of mouse SOUL was constructed and reconstitution of this protein mutant with heme shows a much smaller Soret peak at 395 nm, which suggests a weak nonspecific heme binding to the protein [20].
Analyzing the sequence of SOUL - figure 1.3, the protein does not have any heme-binding motif [21, 22], but some hydrophobic amino acid segments which may be responsible for the heme binding, can be found [22].
In 2006, the solution structure of murine p22HBP was determined (the first structure from SOUL/HBP family of proteins). This protein presents 27 % sequence identity to hSOUL [18].
Figure 1.3 Multi-sequence alignment of human (hSOUL), murine (mSOUL) and chicken (ckSOUL)
heme-binding protein 2 with human (hHBP) and murine (mHBP) heme-heme-binding protein 1 using ClustalW [23]. hSOUL His42, possible axial ligand of Fe (III) heme and the BH3 domain are indicated.
10
protein that was classified as a putative signaling component [24, 25]. No further studies were performed with this protein.
Human SOUL is a 23 kDa heme-binding protein, belonging to the SOUL/HBP heme-binding family of proteins. hSOUL was first identified as a placental protein and designated PP23, and is expressed in a wide range of human organs, such as heart, kidneys, lungs, stomach and others [26]. Recently, the protein was also identified in human amniotic fluid [27].
The role of heme-containing proteins in cell death and survival is a well characterized event. These proteins can be involved in the formation of reactive oxygen species (ROS) inducing direct oxidative damage, and also in the induction of mitochondrial permeability transition (MPT) [28]. This process is directly implicated in both apoptotic and necrotic cell death [29, 30]. In recent studies, Szigeti et al suggested a new function for SOUL protein: the protein may be involved in necrotic cell death by permeabilizing both the inner and outer membrane of mitochondria [31]. In the study mentioned before, SOUL was overexpressed in NIH3T3 cells. In order to determine if SOUL affected ROS production, NIH3T3 cells were treated with H2O2
in order to make it easier to detect ROS formation. It was observed that SOUL did not increase the cellular levels of ROS. In order to understand how SOUL can induce cell death, MPT was induced in isolated mitochondria by applying a percoll gradient; SOUL itself did not induce mitochondrial swelling, however in the presence of a low calcium concentration (30 µM), mitochondria swelling was induced, a process that was inhibited by cyclosporine A. The mitochondrial membrane potential (ΔΨ) is directly related to MPT in a way that during MPT, a
decrease in ΔΨ can be observed. Again, SOUL, in the presence of 30 µM Ca2+ induced a
significant decrease in ΔΨ.
Necrotic and apoptotic cell death events depend on the nature and intensity of the stimulus. MPT can, also depending on the nature and intensity of the stimulus, provoke apoptotic or necrotic cell death. Mock-transfected and SOUL overexpressing NIH3T3 cells were treated with 1M calcimycin, also known as A23187 (divalent cation ionophore, that allows ions to cross cell membranes) or 50 µM etoposide (anti-cancer agent that inhibits topoisomerase, causing DNA strands to break) for 24 hours in order to understand how SOUL is involved in one or both of these cellular events.
All the results show that SOUL can provoke both necrotic and apoptotic cell death. Moreover, in the presence of a high, but still physiological concentration of Ca2+, SOUL could induce MPT
and that effect could be inhibited by CsA, a specific inhibitor of MPT.
In a recent study, HeLa cells overexpressing SOUL protein were used to test the protein’s
11
peroxide (H2O2) for 24 hours. As a control, HeLa cells without SOUL overexpression were
used. Immunoblot assays show that, in these oxidative stress conditions, SOUL concentration in mitochondria increases. Thus, the relocation of the protein from the cytosol into the mitochondria is proposed. In the same work, heme-binding protein 2 was shown to contain a very similar sequence region to the BH3-domain of some Bcl-2 family members. BH-3 domain proteins have been suggested to play a vital role in triggering mitochondrial-mediated apoptosis [32].
SOUL was therefore postulated to be a BH3 domain containing protein; in the (human) protein, the BH3 domain comprises residues Leu158 to Lys172 (LASILREDGKVFDEK). In order to understand if SOUL was in fact a pro-apoptotic protein, the protein was cloned without 9 amino acids (LREDGKVFD) comprised within the BH3-domain (ΔBH3-SOUL). ΔBH3-SOUL and SOUL overexpressing cells were treated with different concentrations of hydrogen peroxide from 0 to 500 µM. The results show that both cells, without SOUL and with ΔBH3-SOUL, are not sensitized to hydrogen peroxide, which leads to the conclusion that without its putative BH3 domain, SOUL cannot sensitize cells to H2O2 induced cell death.
It is stated that the action of BH3-domain proteins can be counter attacked by antiapoptotic proteins such as Bcl-2 and/or Bcl-xL. To understand if SOUL interacts with any of these
proteins, NIH3T3 cells were co-transfected with the full length of the open reading frame of Bcl-2 or Bcl-xL and empty pcDNA or full-length SOUL cDNA containing pcDNA vector. In all
cases, different concentrations of hydrogen peroxide (0 – 500 µM) were used. When only Bcl-2 or Bcl-xL was overexpressed, the cells survived in all the concentrations of hydrogen peroxide
used. Again, when SOUL was overexpressed, cell death occurred. When both, Bcl-2 or Bcl-xL
and SOUL were overexpressed the survival of the cells was similar to that of mock-transfected cells, which suggests that the anti-apoptotic proteins, Bcl-2 or Bcl-xL, counter attacks SOUL
activity. The same experiment was performed with ΔBH3-SOUL-overexpressing cells instead of SOUL-expressing cells; in these experiments no significant differences were observed between these cells and mock-transfected cells, which strengthens the case for the crucial importance of the BH3 domain in the cell death activity of SOUL.
At the molecular level, SOUL is proposed to facilitate cell death because of its interaction with the mitochondrial permeability transition (mPT) complex. Suppression of cyclophilin D, an integral membrane protein of the mitochondrial permeability transition pore (mMPTP), and overexpression of Bcl-2 or Bcl-xL prevented the MMP-decreasing effect of SOUL, upon
12
Figure 1.4 Diagram of the proposed mechanism of hSOUL protein (from [32]). In the presence of
specific Ca2+ concentrations, SOUL protein induces permeability transition leading to the loss of the
mitochondrial membrane potential. Bcl-2 or Bcl-xL prevents this process, indicating the direct effect of SOUL on the mitochondrial permeability transition pore (mPTP).
In summary, SOUL is proposed to promote the permeabilization of the inner and outer membranes of mitochondria in oxidative stress conditions; this can be reversed by removing the BH3 domain.
Genomic studies identified a novel susceptibility locus for rheumatoid arthritis (RA) (rs6920220). This locus lies close to TNFAIP3, a negative regulator of NF-kB in response to TNF (tumor necrosis factor, a cytokine involved in inflammatory response) stimulation. Heme-binding protein 2 (HEBP2) gene is also close to this region, which raised the question whether SOUL is involved in rheumatoid arthritis. To test this hypothesis, Peripheral Blood Cells (PBD) of rheumatoid arthritis patients were used to determine the expression level of mRNA of SOUL gene compared to healthy people. The results show an increase of approximately 2.5 folds of SOUL expression in RA patients [33]. No further studies were published regarding the role of SOUL protein in this disease.
Recently, studies were performed in order to deeper understand the possible pro-apoptotic function of hSOUL by studying the possible binding of the protein to anti-apoptotic protein Bcl-xL. For that, the BH3 domain identified in hSOUL was synthetized and co-crystalized with the
anti-apoptotic protein Bcl-xL. The complex structure was solved by X-ray Crystallography to
1.95 Ǻ showing the interaction between the SOUL BH3 domain peptide and Bcl-xL. In addition,
13
addition to Bcl-xL. These results suggest an interaction between hSOUL and anti-apoptotic
proteins from Bcl-2 family of proteins, namely Bcl-xL. However, data from Surface Plasmon
Resonance (SPR) using intact SOUL protein with Bcl-xL showed no interaction between the two
proteins [34].
1.2.2.HEME-BINDING PROTEIN 1, P22HBP
In 1998, Taketani et al isolated a novel heme-binding protein from mouse liver cytosol. The protein, with approximately 22 kDa, was designated p22HBP – p22, heme-binding protein. The protein initially isolated was purified with a hemin-bound Sepharose column, hence the designation heme-binding protein. The cDNA of the protein was afterwards isolated as a 1003 base pairs (bp) insert with an open-reading frame (ORF) of 630 bp, encoding a soluble 190 amino acids protein, 21063 Da [35]. Protein sequence analysis showed no heme-binding motif, however, positions 73 to 82 consisted of a hydrophobic pocket that could be involved in heme binding [21].
RNA blots of the expression of p22HBP in mouse tissues showed an extremely high level of protein expression in the liver. Since heme metabolism is higher in the liver p22HBP can be considered an important protein in heme metabolism [35]. More recently, it was demonstrated that p22HBP is highly expressed in hematopoietic tissues like fetal liver and bone marrow [36]. p22HBP was subsequently cloned in pEGFP-N1 system in order to overexpress the protein fused with the green fluorescence protein (GFP) allowing the determination of the cellular localization of the protein. The results clearly indicate that the protein is localized throughout the cytosol but not in the nucleus [1].
A p22HBP/GST fusion protein construct was used to study the heme binding to the protein and its oligomerization state. Upon incubation with hemin in vitro, the UV-visible spectrum shows a Soret band at 408 nm due to the hemin-protein complex formation. Gel filtration analysis showed that the protein exists as a monomer, binding one heme molecule per monomer [13]. A recent proteomic study revealed that p22HBP belongs to one of the complexes (complex III) involved in hemoglobin metabolism, namely, in hemoglobin synthesis. The high concentration of p22HBP in the cytosol indicates that this protein is a positive regulator of heme biosynthesis in erythroid cells [37] .
![Figure 1.2 Heme biosynthesis pathway (adapted from [3]). Mammalian heme biosynthesis pathway scheme](https://thumb-eu.123doks.com/thumbv2/123dok_br/16483241.732610/34.892.145.728.119.525/figure-biosynthesis-pathway-adapted-mammalian-biosynthesis-pathway-scheme.webp)
![Figure 1.4 Diagram of the proposed mechanism of hSOUL protein (from [32]). In the presence of specific Ca 2+ concentrations, SOUL protein induces permeability transition leading to the loss of the mitochondrial membrane poten](https://thumb-eu.123doks.com/thumbv2/123dok_br/16483241.732610/42.892.178.722.111.456/diagram-proposed-mechanism-presence-concentrations-permeability-transition-mitochondrial.webp)
![Figure 1.6 Caspases as responsible agents for cellular organelles demolition (from [45])](https://thumb-eu.123doks.com/thumbv2/123dok_br/16483241.732610/49.892.175.723.131.604/figure-caspases-responsible-agents-cellular-organelles-demolition.webp)

![Figure 1.8 Domain structures of some BH3-only-like proteins. Example of BH3-like proteins and corresponding domain functions (adapted from [58])](https://thumb-eu.123doks.com/thumbv2/123dok_br/16483241.732610/52.892.220.674.340.859/figure-domain-structures-proteins-example-proteins-corresponding-functions.webp)

![Figure 1.18 TROSY effect on the transverse relaxation time,T 2 , and line widths (adapted from [91])](https://thumb-eu.123doks.com/thumbv2/123dok_br/16483241.732610/78.892.184.707.475.957/figure-trosy-effect-transverse-relaxation-time-widths-adapted.webp)