FACULDADE DE CIÊNCIAS
DEPARTAMENTO DE FÍSICA
Development of an image processing pipeline for the study of
cortical lesions in multiple sclerosis patients using
ultra-high field MRI
Marta Filipa Mateus Marques
Mestrado Integrado em Engenharia Biomédica e Biofísica
Perfil em Biofísica Médica e Fisiologia de Sistemas
Dissertação orientada por:
Prof. Dr. Alexandre Andrade
We have not succeeded in answering all our problems. Indeed, we sometimes feel we have not completely answered any of them. The answers we have found only serve to raise a whole set of new questions. In some ways we feel we are as
confused as ever, but we believe we are confused on a higher level and about more important things.
Earl C. Kelley
__________________________________________________________________________________
Acknowledgements
__________________________________________________________________________________ There is only so much gratitude that can be put into words. Sometimes language is not enough. Still, here is my attempt at expressing my gratitude towards all of you who impacted, in one way or another, the outcome of this project and this piece of work.
To Hartwig, thank you for your prompt response and willingness to receive me in the respectable institution that is the Danish Research Centre for Magnetic Resonance (DRCMR) from the first exchange of emails. It was the one push I needed to realize that Copenhagen could only be a good option. Thank you for the support throughout my internship.
To Mads, thank you for welcoming me into your project with open arms and for treating me as an equal since the very beginning. For seeing the value in my work and trusting my decisions. It has been a pleasure to be a part of the CLiMS project and I could not be more excited for the possibility to continue making research with you.
To Henrik, the guidance and support you were able to provide me with during the entirety of my project was the reason why I did not get stuck indefinitely in dead ends and always managed to find other routes and possibilities to explore. Thank you.
To the students at DRCMR with whom I got to share the “Beverly Hills” office with: Felix, Julie, Albert, Maud, Laura and Shahab, thank you for the conversations over lunch, for the table soccer games and for all the good moments and laughs. Mostly, thank you for your friendship and silliness.
To Julie, even if our relationship started at DRCMR I am happy to say that it has grown beyond it. You have become a friend and a mentor. Thank you for welcoming me into your life and for bringing such positivity into mine with your kindness and quirky nature.
To Louis, for sharing the same language of music, fascination for the brain and interest in well written and spoken communication. I found in you someone intelligent yet humble, eager to learn yet patient and whose ability to listen and curiosity to ask questions and wonder still dazzles me today. Thank you for your involvement in this project. And mostly, thank you for your time.
To Mariana, I am so glad we reconnected, years later, in the city of Vikings. It has been a pleasure to share this chapter of my life with you. Thank you for your friendship and loyalty and for giving me a reason to keep practicing Portuguese while teaching me bits of Danish along the way.
I would also like to express my gratitude towards the Erasmus+ institution, as well as the group at DRCMR, for the support throughout my stay in Copenhagen.
A dissertation reflects not only the work carried out during the course of the internship and the experiences that surround it, but the sum of all moments, battles and lessons lived by those who devote themselves to the art of learning. That being said, a thank you is also in order to those elements that have been pivotal in the past five years, if not eighteen, of my student journey.
To my teacher Alexandre Andrade, thank you for showing immediate interest in supporting this project and for guiding me throughout it from afar. But most importantly, thank you for helping me see the value in the work of a biomedical engineer by comparing its role to that of someone who works on the backstage of a play, not as exposed, but just as important to its overall success. This beautiful analogy
delivered during one of my first lectures at the Faculty of Sciences of the University of Lisbon (FCUL) has followed me ever since, guiding me in periods of confusion and uncertainty.
To the academical group at FCUL and at the Institute of Biomedical Engineering and Biophysics (IBEB), thank you for the sharing of knowledge during these past five years. Moreover, thank you for teaching me the importance of hard work and resilience, not only in class, but in life.
To Catarina and André, I still remember the first day I met you on that corridor of Pavilion C8 as though it was only yesterday. It was a pleasure sharing all those study sessions, project presentations, lab hours and leisure moments in Lisbon and London with you. You became, without a doubt, my favorite part about FCUL. I look forward to continuing sharing my time with you now outside of it.
To Mónica, my buddy. Every moment and exchange of words with you is worth any period of absence. You make every moment better and continue to inspire me with your vulnerable strength and unapologetic grace.
To Teresa, the one friend who always keeps me grounded. I am so grateful you found me on that little corner of the internet a decade ago and that we got to grow up side by side ever since then.
To Pedro, the best guitar teacher I know, and to Sara and Mafalda, my guitar peers, playing with you all at the end of every week was the best way to escape my mind and leave behind all my worries. I still cannot fathom a better Friday evening plan than to play music with friends. Nothing seems to compare.
To my grandmother, the person who gets me far beyond words but who will not get this if it is not written in her mother tongue. O universo por desvendar não se compara ao carinho, respeito e admiração que tenho por ti. Obrigado por me teres ensinado a amar, a acreditar e a ser. O meu mundo é mais colorido por tu fazeres parte dele.
Finally, to my parents and brother, thank you for accepting me and loving me no matter what. For supporting my dreams and for giving me the time and space to learn and grow, even if away from home. I am so lucky.
__________________________________________________________________________________
Resumo
__________________________________________________________________________________ A esclerose múltipla é uma doença crónica e inflamatória do sistema nervoso central de alta prevalência nos dias de hoje. Durante anos, o foco da doença foi a patologia visível na matéria branca. Apesar dos primeiros estudos de patologia cortical em esclerose múltipla apontarem para a década de 60, foi apenas no início do novo século que o córtex passou a ser estudado como parte integral da doença. Desde então, estudos têm vindo a demonstrar que o comprometimento do córtex parece estar relacionado com danos cognitivos e físicos, frequentemente associados à doença. A necessidade de melhor compreender o impacto das lesões corticais no desenvolvimento da doença e na vida diária destes pacientes tem motivado o seu estudo, sendo a Ressonância Magnética (RM), em particular scanners de campo ultra-alto, a melhor ferramenta para as detetar e estudar.
A melhoria da razão sinal-ruído e da resolução espacial dos scanners de RM de campo ultra-alto tem permitido o aumento da deteção de lesões corticais. Ainda assim, a sua sensibilidade continua a não ser ideal e a estar fortemente dependente do tipo de lesão cortical, do contraste de RM usado na sua deteção e da existência de ferramentas robustas que permitam a sua deteção de modo automático, mais eficiente e com menor espaço para erro. A falta de marcadores de imagem para a remielinização ou desmielinização parcial, tal como a ausência de diretrizes para a deteção destas lesões com campos de 7 (T)esla parece explicar a dificuldade em distinguir e identificar falsos positivos e as diferenças encontradas nas deteções realizadas por diferentes avaliadores.
Uma desvantagem dos scanners de campo ultra-alto é o maior efeito de bias que, caso não seja removido aquando da aquisição de imagens, terá de ser removido na fase de processamento por softwares e algoritmos que não estão originalmente construídos para trabalhar com imagens de maior resolução e cuja prestação não está ainda bem explorada nestas condições. Estes desafios comprometem o potencial dos scanners de RM de campo ultra-alto para o estudo das lesões corticais na esclerose múltipla.
Este projeto procura desenvolver uma pipeline semiautomática para o pré-processamento e processamento de imagens de RM de cariz estrutural de doentes com esclerose múltipla obtidas num scanner de campo ultra-alto. A pipeline é criada de modo gradual, recorrendo a análises visuais, ou de outro tipo, para confirmar a qualidade de cada passo antes de avançar para o seguinte, no pressuposto de que a qualidade dos softwares de imagem comercialmente disponíveis será menor ao utilizar imagens de maior resolução. A ocorrência de lesões corticais no córtex sensório-motor (SM1) é igualmente determinada e usada para validar a qualidade da pipeline.
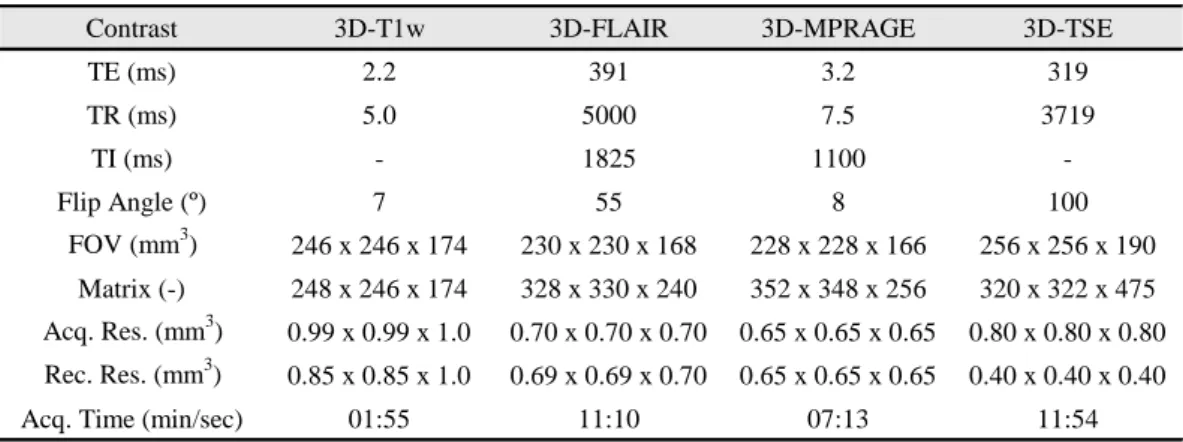
Doze doentes com esclerose múltipla na sua forma recidivante-remitente ou secundariamente progressiva e seis controlos foram incluídos neste projeto. Todas as permissões necessárias do comité local de ética, proteção de dados e da Danish Medicines Agency foram previamente obtidas. Os doentes foram estudados num scanner de RM de corpo inteiro da Philips, Achieva 7,0 T, dedicado a investigação. Os participantes foram observados usando quatro tipos distintos de contraste: magnetization prepared rapid acquisition by gradient echo (MPRAGE) a três dimensões (3D) com 0,65-mm de resolução isotrópica, 3D fluid attenuated inversion recovery (FLAIR) com 0,7-mm de resolução isotrópica, 3D T1-weighted (T1w) de resolução 0,85x0,85x1,0 mm3 e 3D T2-weighted Turbo Spin Echo (T2w-TSE)
A vertente de pré-processamento da pipeline incluiu uma correção de bias e o co-registo de imagens. Para a correção de bias, o software SPM foi testado utilizando os parâmetros habituais e uma alteração dos parâmetros relativos à smoothness e regularização, como sugerido na literatura. O processo de co-registo seguiu o procedimento utilizado no processamento de imagens de doentes com esclerose múltipla de 3 T no Danish Research Centre for Magnetic Resonance (DRCMR), com alterações posteriormente adicionadas para melhorar a qualidade do alinhamento das imagens de cada indivíduo a 7 T. Após o pré-processamento, uma deteção de lesões corticais, seguida da sua segmentação, foi realizada manualmente utilizando as ferramentas do software FSL. A vertente de processamento da pipeline incluiu uma segmentação do cérebro, um registo das imagens dos doentes e a criação de superfícies corticais. A segmentação foi testada utilizando três diferentes ferramentas: o software SPM, uma toolbox do SPM, CAT, e a ferramenta de segmentação do FSL, FAST. A toolbox do SPM, DARTEL, foi usada no registo de imagens e o software FreeSurfer permitiu a criação de superfícies individuais e de grupo no último passo da pipeline. As máscaras com as lesões criadas após a segmentação manual de lesões seguiram um caminho semelhante de processamento de modo a permitir a sua correta sobreposição no respetivo volume, e, posteriormente, superfície, e a possibilidade de fazer análises individuais ou de grupo.
Os resultados obtidos mostraram que os softwares para processamento de imagens de RM disponíveis apresentam, em geral, uma boa prestação e fornecem resultados de confiança. Ainda assim, a sua prestação pode ser otimizada incluindo procedimentos adicionais em cada passo ou por alteração das configurações originais dos softwares. A diminuição do parâmetro de largura à meia altura com um aumento do parâmetro de regularização na correção de bias com o SPM permitiu a criação de campos de bias mais fieis às imagens originais, consequentemente melhorando a sua correção e a diferenciação da matéria branca e matéria cinzenta nas imagens resultantes. A criação adicional de máscaras contendo apenas o cérebro e a utilização exclusiva de transformações de corpo rígido no co-registo de imagens permitiu a utilização de vários contrastes na tarefa de deteção de lesões, sem interferir com a sua localização ou morfologia. Na segmentação, a toolbox do SPM, CAT, mostrou melhorias na capacidade de separar as diferentes classes de tecidos com maior confiança e qualidade, particularmente nas regiões de contacto entre a matéria branca e cinzenta. Consequentemente, a qualidade do alinhamento das imagens dos diferentes doentes e a posterior criação de uma imagem média a partir de imagens individuais foi melhorada. O sucesso da pipeline permitiu a sobreposição das lesões corticais manualmente segmentadas nas superfícies individuais e/ou comuns criadas, onde foi descoberto que a maioria das lesões ocorreu no hemisfério direito, com sobreposições de lesões respetivas a diferentes doentes a ocorrer maioritariamente nos sulcos corticais, comparativamente aos giros. Porém, a segmentação de lesões demonstrou ser dispendiosa, dependente do avaliador e altamente influenciada por fatores inerentes ao avaliador, tal como o cansaço, nível de concentração ou de aborrecimento, e fatores externos, no qual se destacam a luminosidade do computador ou a luminosidade da sala onde a deteção foi feita. A feature do FreeSurfer para imagens de maior resolução não se mostrou fiável no tratamento dos dados de resolução isotrópica de 0,5-mm deste projeto, uma possível razão pela qual ainda se encontra em desenvolvimento.
Apesar dos bons resultados obtidos, investigação adicional será necessária para melhor compreender a prestação destes e de outros softwares para imagem médica no processamento de imagens de RM de maior resolução, tal como a melhor maneira de tirar partido dos mesmos em estudos clínicos a 7 T. A extensão da pipeline a outros doentes com esclerose múltipla irá aumentar a amostra em estudo e permitir um estudo mais extensivo da patologia cortical e a compreensão do impacto de uma ou mais lesões localizadas na região SM1 na conectividade e integridade funcional da região cortical afetada.
Palavras-chave: RM de campo ultra-alto, esclerose múltipla, lesões corticais, processamento de
__________________________________________________________________________________
Abstract
__________________________________________________________________________________ The importance of grey matter pathology to the understanding of multiple sclerosis has been acknowledged. However, the sensitivity to cortical lesions is limited when using conventional magnetic resonance imaging (MRI) systems. Ultra-high field (UHF) MRI systems have improved detection sensitivity but impose the additional challenge of a higher effect of bias to account for. Currently, image processing tools are not designed for higher resolution data and the performance of common software packages under these conditions has not been properly explored. These challenges have impaired the potential of UHF-MRI to study cortical lesions in multiple sclerosis.
This project aims at developing a semi-automated pipeline for the pre-processing and processing of structural UHF-MRI data of multiple sclerosis patients. The pipeline is built in a step-by-step fashion, making use of visual assessments and other analyses to confirm the quality of each step before advancing to the next, under the assumption that the performance of common imaging software packages will be poorer when using higher resolution data. The occurrence of cortical lesions within the primary sensory-motor cortex (SM1) is also determined and used to validate the quality of the pipeline.
Twelve patients with relapsing-remitting multiple sclerosis or secondary progressive multiple sclerosis and six healthy age-matched controls were included in this project. All relevant permissions from the local ethics committee and data protection had been obtained beforehand. All participants were studied with whole-brain ultra-high field MRI at 7 Tesla (T), using a research-only 7 T Achieva MR system. The participants were scanned using four different MRI modalities, namely 3-dimensional (3D) magnetization prepared rapid acquisition by gradient echo (MPRAGE) at 0.65-mm isotropic resolution, 3D fluid attenuated inversion recovery (FLAIR) at 0.7-mm isotropic resolution, 3D T1-weighted (T1w) of 0.85x0.85x1.0 mm3 reconstructed resolution and 3D T2-weighted Turbo Spin Echo (T2w-TSE) at
0.4-mm isotropic reconstructed resolution.
The pre-processing pipeline included a bias correction and a coregistration step. For the bias correction, SPM was tested using its default parameters and an alternative configuration that altered the smoothness and regularization parameters. The coregistration followed an approach used in the processing of multiple sclerosis data at 3 T, with changes added to improve the quality of the within-subject alignment at 7 T. After the data pre-processing, manual detection and segmentation of cortical lesions was performed using FSLeyes. The processing pipeline included brain segmentation, subject registration and cortical surface creation. Brain segmentation was tested with SPM, with SPM’s toolbox, CAT, and with FSL’s segmentation tool, FAST. SPM’s DARTEL tool was used for subject registration and FreeSurfer allowed the creation of individual and an average cortical surface. The lesion masks created after the manual segmentation task followed a similar processing route to allow their overlay on the respective brain volumes and, posteriorly, surfaces, and the possibility of individual and group analyses.
Results showed that the currently available MRI image processing tools present overall good performance and reliability in the processing of higher resolution data of multiple sclerosis patients. Still, the quality of the outcomes can be optimized by including additional steps or changes to the original software configurations. Modifying SPM’s smoothness and regularization parameters for the estimation of bias minimized its effect in the data, allowing a better differentiation between grey matter
and white matter. Removing the skull whilst keeping the coregistration to rigid body transformations allowed the use of several contrasts in the lesion detection task without interfering with the lesions’ morphology and topography. Brain segmentation using CAT showed more stability across the dataset, improving the quality of the subsequent subject registration and consequently of the average brain created. The success of the pipeline led to the possibility of overlaying the manually segmented lesions on the individual and group surfaces where it was found that the majority of lesions occurred on the right hemisphere and that lesion overlaps were more common in cortical sulci.
Despite the results obtained, further research is needed to understand the performance of other software packages in the processing of higher resolution MRI data and how to fully exploit these tools in the study of clinical data at 7 T.
Keywords: ultra-high field MRI, multiple sclerosis, cortical lesions, image processing, semi-automated
__________________________________________________________________________________
Table of Contents
__________________________________________________________________________________ Acknowledgements ... i Resumo ... iii Abstract ... viTable of Contents ... viii
List of Figures ... x
List of Tables ... xiii
List of Abbreviations ... xiv
1 Introduction ... 1
2 Background ... 3
2.1 Multiple Sclerosis ... 3
2.1.1 Overview of Multiple Sclerosis ... 3
2.1.2 Cortical Lesions in Multiple Sclerosis ... 5
2.2 Magnetic Resonance Imaging ... 7
2.2.1 Principles of Magnetic Resonance ... 7
2.2.2 Ultra-high Field MRI ... 10
2.2.3 MR Image Contrast ... 10 2.2.3.1 T1-weighted ... 11 2.2.3.2 T2-weighted ... 11 2.2.3.3 FLAIR ... 11 2.2.3.4 MPRAGE ... 11 2.2.3.5 MP2RAGE ... 12 2.2.4 MR Image Processing ... 12 2.2.4.1 Bias Correction ... 13 2.2.4.2 Registration ... 14 2.2.4.3 Segmentation ... 15
2.2.4.4 Cortical Surface Creation ... 16
2.3 MRI in Multiple Sclerosis ... 17
2.3.1 Diagnosis of Multiple Sclerosis ... 17
2.3.2 MRI and Cortical Lesions ... 18
2.3.2.1 Conventional MRI in Cortical Lesion Detection ... 18
2.3.2.2 Ultra-high Field MRI in Cortical Lesion Detection ... 19
2.3.2.3 Sensitivity to Cortical Lesions at 7 T ... 20
3 Methodology ... 23
3.1 Subject Recruitment and Data Acquisition ... 23
3.2 Image Processing Pipeline ... 24
3.2.1 Bias Correction ... 25 3.2.2 Coregistration ... 26 3.2.3 Brain Segmentation ... 27 3.2.3.1 Lesion Segmentation ... 27 3.2.4 Subject Registration ... 29 3.2.5 Surface Creation ... 30 4 Results ... 32 4.1 Bias Correction ... 32 4.2 Coregistration ... 36 4.3 Brain Segmentation ... 40 4.3.1 Lesion Segmentation ... 42 4.4 Subject Registration ... 44 4.5 Surface Creation ... 48 5 Discussion ... 52 5.1 Bias Correction ... 52 5.2 Coregistration ... 53 5.3 Brain Segmentation ... 54 5.3.1 Lesion Segmentation ... 55 5.4 Subject Registration ... 56 5.5 Surface Creation ... 57 5.6 Final Remarks ... 58 6 Conclusion ... 60 References ... 61 Appendices ... 67 Appendix A ... 67 Appendix B ... 68 Appendix C ... 69 Appendix D ... 70 Appendix E ... 71 Appendix F ... 73 Appendix G ... 75 Appendix H ... 76 Appendix I ... 78
__________________________________________________________________________________
List of Figures
__________________________________________________________________________________
Figure 2.1: Schematic representation of the three types of multiple sclerosis: relapsing–remitting (a),
secondary progressive (b) and primary progressive (c) [25]. 5
Figure 2.2: The different types of cortical lesions as detected histologically [16]. The cerebral
cortex/white matter borders are delineated by closed arrows. The lesion borders are delineated by open arrows. Images A, B, C and D, depict lesion types I, II, III and IV, respectively. Abbreviations: WM =
white matter; CTX = cerebral cortex. 7
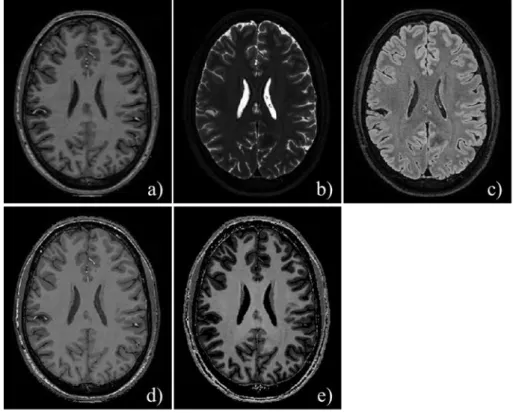
Figure 2.3: MRI scans acquired at 7 T with different contrasts, namely, T1w (a), T2w-TSE (b), FLAIR
(c), MPRAGE (d) and MP2RAGE (e). 12
Figure 2.4: The different types of cortical lesions detected with 7 T T2* MRI in a post-mortem study
[5]. 19
Figure 2.5: The different types of cortical lesions detected with 7 T MPRAGE MRI in-vivo. 20
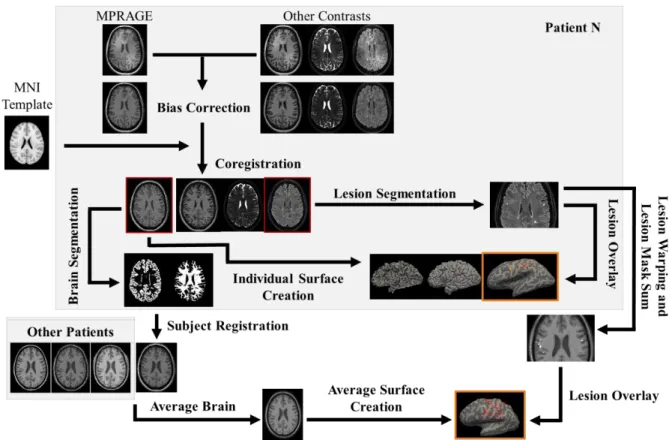
Figure 3.1: Schematic representation of the image processing pipeline starting from the individual data
of one of the patients. The coregistered FLAIR and average brain images are used on the scheme to overlay the individual lesion mask from the lesion segmentation and the warped and combined patient lesion mask, respectively. The patient and average surfaces with the overlaid lesions are highlighted in
orange. 25
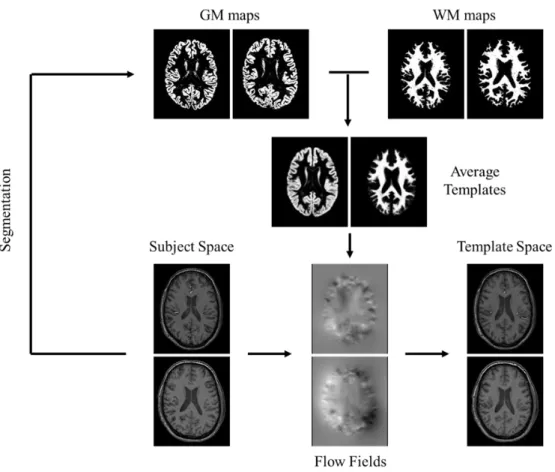
Figure 3.2: Schematic representation of the subject registration step. The MPRAGE segmented tissue
maps are used to create average templates. The individual flow fields acquired during the template creation are applied to the individual MPRAGE volumes to register them to the template space. Even though all patients were used in the creation of these templates, the scheme only displays data from two for simplification. The presented tissue maps come from SPM’s segmentation procedure. 30
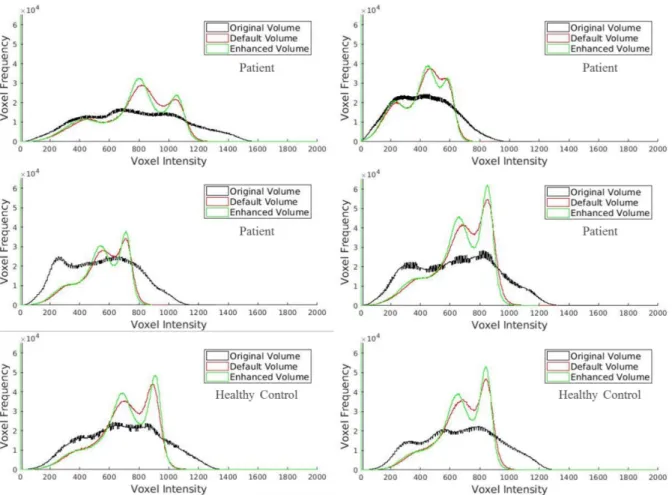
Figure 4.1: Histograms showing the voxel intensity distribution of WM, GM and CSF for a sample of
the dataset for the original and bias corrected volumes using SPM’s default and enhanced parameters. Despite the better depiction of the GM and WM peaks from the correction of bias, the steepness of the enhanced volume histograms is suggestive of a better differentiation of the two classes. 33
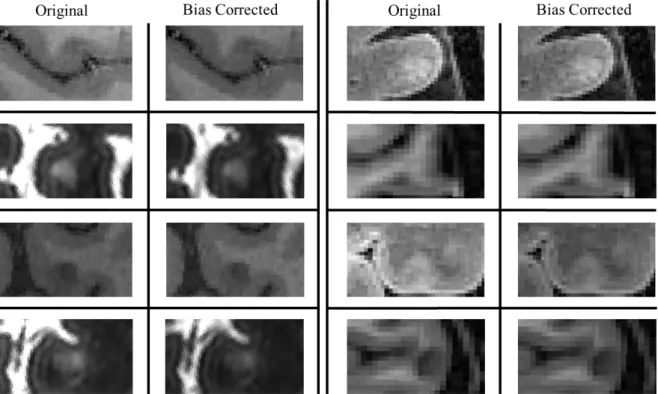
Figure 4.2: FLAIR and MPRAGE cuts of a patient and a healthy control, respectively, showing the
differences in the bias correction using SPM’s default and enhanced parameters. The bias fields and GM probability maps are included. As a result of a more localized depiction and consequently correction of
bias, a better segmentation of the cortex and cortical structures results. 34
Figure 4.3: Axial cuts displaying cortical lesions before and after bias correction across the patient
dataset. Despite the intensity correction, the integrity of the lesions is preserved and their contrast, in
relation to the surrounding tissue, is maintained. 35
Figure 4.4: Brain sections of a patient and a healthy control displaying the result of the alignment
between the subjects’ masked MPRAGE images and the masked MNI template, the fixed image. Due to the absence of non-linear registration tools, the alignment of structures with reference to the fixed
image is present but individual morphological differences are responsible for the misalignment that
prevails after the coregistration. 36
Figure 4.5: Brain sections of a patient and a healthy control displaying the result of the alignment
between the subjects’ unmasked MPRAGE images and their respective masked MPRAGE images, the fixed images. The green axis fixed on a point on the corpus callosum depicts the clear alignment of this
structure after the coregistration, present for both subjects. 37
Figure 4.6: Brain sections of a patient and a healthy control displaying the quality of the contrasts’
alignment. The arrows point at the regions where a clear misalignment of structures is depicted before
the coregistration procedure and where it no longer is present after. 38
Figure 4.7: Axial cuts displaying a patient’s subpial lesion in the different MRI contrasts before and
after the coregistration. The fixation of the axis on a lesion border allows the display of the original misalignment, particularly clear on the MPRAGE and T2w-TSE images, and that is no longer present
after the coregistration. 39
Figure 4.8: Axial cuts displaying four different lesions as seen by the different MRI contrasts after the
coregistration. The alignment between the different contrasts should be present and is confirmed by the
green axis fixed on a point on the lesion borders. 39
Figure 4.9: Axial cuts of the GM probability maps acquired from the three tested segmentation
approaches. The predominance of voxels with low tissue probability in WM in the SPM image suggests
a poorer segmentation performance using this approach. 40
Figure 4.10: Axial sections displaying the GM binary masks for the three segmentation approaches
using multiple threshold values. For a voxel certainty of 0.99, it becomes clear that CAT outperforms the other two approaches, displaying more voxel density than SPM and avoiding selecting voxels outside
the cortex as happened with FAST, depicted with an arrow. 41
Figure 4.11: Axial sections displaying the GM probability maps for the three segmentation approaches
overlaid on the original image. The poor contrast between WM and GM in the central sulcus, highlighted with a circle, impacted the quality of all segmentations. Still, CAT continues to show a better performance overall. SPM tends to overestimate the GM tissue values, whereas FAST shows a tendency
to segment and classify voxels outside the cortex as GM. 42
Figure 4.12: Visual display of a lesion as spotted in the axial plane on the FLAIR contrast (a) and
confirmed on the MPRAGE (b). (c) depicts on the MPRAGE the lesion segmentation, in red, and the ring created around the lesion, in blue. In (d) the ring has been altered to only include the voxels within
GM, the neighborhood of the cortical lesion. 43
Figure 4.13: Boxplots of the distribution of the CNR parameter across the 253 lesions in the dataset for
the different MRI contrasts. 44
Figure 4.14: Axial cuts displaying the average DARTEL templates for GM and WM created from
patients’ segmented volumes using SPM and CAT. To highlight the differences in the templates and the better performance using CAT’s volumes, enlarged cuts of the images were added. 45
Figure 4.15: Boxplots of the distribution of the CV measure in the tissue classes across the patient data
for the two segmentation approaches, CAT and SPM. 46
Figure 4.16: Coronal section displaying a good alignment of the warped MPRAGE volumes of a patient
to the respective GM template, present for both segmentation approaches. The alignment is fixed on the
Figure 4.17: Sagittal section displaying the quality of the inter-subject registration, represented by the
two age extremes of the patient dataset. The alignment is fixed on the cerebellum, a problematic area due to the original effect of bias. The arrow highlights the misalignment between the two patients present
in the results from SPM. 47
Figure 4.18: Axial cuts displaying the warping of a lesion following the subject registration. The FLAIR
image is also included to allow a better perception of the lesion borders which influenced the manual segmentation. When the patient’s flow field is applied to the lesion mask, the resulting mask shows a
reasonable depiction of the new lesion topography. 48
Figure 4.19: Average MPRAGE brain created from the patients’ warped volumes. The warped volumes
for two patients are displayed for comparison. Inherent differences between the patients which were not accurately corrected during the subject registration contributed to the smoothing effect present on the
average brain. 49
Figure 4.20: White, pial and inflated surfaces created in FreeSurfer for the average brain and two
patients. The feature for submillimeter resolution applied to the average brain, overlaid on the images,
led to unwanted results in all three surfaces. 50
Figure 4.21: Inflated surfaces of two patients and the average brain displaying the topography of cortical
lesions for the patients and the entire patient dataset, respectively. The arrows on the average surface
point at areas where overlaps of lesions were found. 51
Figure A.1: Sagittal and coronal sections of a patient and a healthy control displaying the poor outcome
of the first alignment between the subjects’ unmasked MPRAGE images and the unmasked MNI
template, the fixed image. 67
Figure A.2: Outcomes from the segmentation step using CAT’s default parameters. 69
Figure A.3: Brain-extracted masks overlaid on the original MPRAGE volume for a participant using
different fractional intensity threshold values. 70
Figure A.4: Histograms showing the voxel intensity distribution of WM, GM and CSF for eight patients
in the dataset. 73
Figure A.5: Histograms showing the voxel intensity distribution of WM, GM and CSF for four healthy
controls in the dataset. 74
Figure A.6: Axial cuts of the WM probability maps acquired from the three tested segmentation
approaches. 75
Figure A.7: Inflated brain surfaces for nine patients with their respective segmented cortical lesions
overlaid. 76
Figure A.8: Inflated brain surfaces for three patients with their respective segmented cortical lesions
__________________________________________________________________________________
List of Tables
__________________________________________________________________________________
__________________________________________________________________________________
List of Abbreviations
__________________________________________________________________________________ BET CAT CLIMS CNR CNS CSF CV DARTEL DIS DIT DRCMR EDSS FAST FID FLAIR fMRI FSL FWHM GM GRE GUI IR MATLAB MNI MPRAGE MP2RAGE MRI MS PPMS RF RRMS SE SM1 SNS SPM SPMS T TE TI TR TSE T1w T2w UHF WM 3DBrain Extraction Tool
Computational Anatomy Toolbox Cortical Lesions in Multiple Sclerosis Contrast-to-Noise Ratio
Central Nervous System Cerebrospinal Fluid Coefficient of Variation
Diffeomorphic Anatomical Registration Through Exponentiated Lie Algebra Dissemination in Space
Dissemination in Time
Danish Research Centre for Magnetic Resonance Expanded Disability Status Scale
FMRIB's Automated Segmentation Tool Free Induction Decay
Fluid Attenuated Inversion Recovery Functional Magnetic Resonance Imaging FMRIB Software Library
Full Width at Half Maximum Grey Matter
Gradient Echo
Graphical User Interface Inversion Recovery Matrix Laboratory
Montreal Neurological Institute
Magnetization Prepared Rapid Acquisition by Gradient Echo Magnetization Prepared 2 Rapid Acquisition Gradient Echoes Magnetic Resonance Imaging
Multiple Sclerosis
Primary Progressive Multiple Sclerosis Radio Frequency
Relapsing–Remitting Multiple Sclerosis Spin Echo
Primary Sensory-Motor Cortex Signal-to-Noise Ratio
Statistical Parametric Mapping
Secondary Progressive Multiple Sclerosis Tesla
Time of Echo Time of Inversion Time of Repetition Turbo Spin Echo T1-weighted T2-weighted Ultra-High Field White Matter Three-Dimensional
1 Introduction
__________________________________________________________________________________ The brain remains one of the biggest puzzles to solve of our time. The knowledge that we currently possess of the healthy brain enables us to better understand what goes wrong in case of disease. Likewise, a focus on brain-related diseases can ultimately serve as a way to validate our knowledge of the brain and help disentangle some of our preconceived ideas about this organ.
Multiple sclerosis (MS) is an autoimmune, demyelinating disease of the central nervous system of high prevalence today. For years, white matter pathology was the hallmark of the disease [1]. Despite the initial research on cortical pathology dating from the 1960s, it was only decades later, with advances in imaging techniques, animal model studies and immunohistochemical analysis, that the study of the disease expanded into the cortex [2]. Since then, studies have demonstrated that cortical grey matter involvement can contribute to cognitive and physical disability, motivating the need to understand the impact of cortical lesions in the disease and everyday life of the patients [3]. The biggest advance towards improving the detection and visualization of cortical lesions has been to shift towards ultra-high field magnetic resonance imaging (UHF-MRI) systems [4].
As a result of the better signal-to-noise ratio and improved spatial resolution of UHF scanners, it is now possible to detect a higher number of cortical lesions as well as to better distinguish the different types of lesions present in this pathology [4], [5]. Even then, the sensitivity to cortical pathology remains nonideal. Some of the factors that seem to influence cortical lesion sensitivity include lesion type and the MRI modality used for the study of these lesions [6]. Lack of imaging markers for remyelination and partial demyelination and lack of cortical lesion detection guidelines at 7 T could explain interrater reliability and the difficulty in identifying false positives [6],[7],[8]. The development of robust automatic tools for cortical lesion detection should decrease the likelihood of human error in the detection of these lesions and significantly optimize the time-efficiency of this process.
Dealing with UHF scanners imposes extra challenges. For instance, there is a higher effect of bias in the acquired images. If not properly corrected, that bias could lessen the accuracy of certain imaging processing methods, particularly the brain segmentation [5]. Another challenge is related to the common image processing tools available which, albeit crucial for the processing of the original data acquired in the scanner, are not designed to work with higher-resolution UHF data [9]. These challenges have impaired the potential of UHF-MRI to study cortical lesions in multiple sclerosis.
The impact of single cortical lesions on the connectivity and functional integrity of the affected cortical area is yet to be understood. To account for this, a PhD project was designed at the Danish Research Centre for Magnetic Resonance (DRCMR) to explore the occurrence of cortical lesions within the primary sensory-motor cortex (SM1) and to clarify their impact on the sensorimotor network with regards to local and remote effects on brain function. Making use of the increased sensitivity of UHF MRI to detect cortical lesions, the PhD project, referred to as Cortical Lesions in Multiple Sclerosis (CLiMS), aims to assess the number, size and regional distribution of cortical lesions in SM1 with 7 T MRI and to relate regional lesion load in SM1 to MRI-based, electrophysiological, and behavioral correlates of hand function along with multimodal MRI-based metrics of structural and functional connectivity within the sensorimotor network. In order to fulfill the objectives of the overall PhD, this Master’s project was set.
This project aims at developing a semi-automated pipeline for the pre-processing and processing of structural UHF-MRI data of multiple sclerosis patients. To accomplish its aim, the pipeline structure is initially thought-out and afterwards built in a step-by-step fashion, considering the outcomes of the current step to confirm its quality before advancing to the next. This is done under the assumption that the performance of common imaging software packages will be poorer when using higher resolution data.
Bias correction and coregistration are the first steps envisioned and incorporated into the pipeline and correspond to the pre-processing part of the pipeline. Afterwards, a brain segmentation, a subject registration and a surface creation step are incorporated as the processing part of the pipeline. Cortical lesions are identified and manually segmented as a supplementary task inherent to this project. Visual analyses are performed at each pipeline step and used as the main form of assessment of the results. Analyses of qualitative and/or quantitative nature are additionally performed to help confirm or discard the outcomes of the current step before advancing to the next. The occurrence of cortical lesions within the SM1 region is also determined and used to validate the quality of the pipeline.
The image processing pipeline should lead to the acquisition of an average and individual brain surfaces from the patients’ data where the cortical lesions manually segmented can then be overlaid. A successful surface should allow a proper visualization of the distribution of cortical lesions in the SM1 area for this project’s dataset and the possibility of extending the pipeline to the remaining subjects of the CLiMS project, contributing to its progress. The approach adopted for each step and the analyses made are influenced by the time available and by the accessible knowledge from literature or from advice from other researchers at the DRCMR.
The research described in this dissertation was carried out at DRCMR between October 2018 and July 2019. Besides the processing of structural MRI data and the development of an image processing pipeline for its study, the two main points extensively described in this dissertation, there was involvement in the acquisition of all structural data analyzed. Assistance in the acquisition of electrophysiological data using Electroencephalography and Transcranial Magnetic Stimulation for the PhD project was also provided during the entirety of this project. These additional tasks enabled a closer contact with multiple sclerosis patients, central to experience at first hand the manifestation of the disease and the different ways it can be expressed. The work developed was supervised by Head of Research Hartwig R. Siebner (DRCMR) and Assistant Professor Alexandre Andrade (FCUL) and co-supervised by Senior Researcher Henrik Lundell (DRCMR) and PhD Student Mads Madsen (DRCMR).
This dissertation is divided in six chapters. Chapter 1 contains a brief overview of the work developed at DRCMR over the course of ten months and states the aims and general approach of this project. Chapter 2 describes in detail the current knowledge of MS, particularly of cortical pathology, the principles of MRI, as well as an overview of UHF-MRI, image contrast in MRI and MRI image processing. Lastly, a section is created to highlight the significance of MRI in the study of MS, specifically of cortical lesions, over the years. Chapter 3 corresponds to the project methodology and outlines the different steps of the pipeline and the approach followed in their design.Chapter 4 displays
the results of this project which are further analyzed and discussed in Chapter 5. Chapter 6 contains some final remarks, the outcomes of this Master’s project and a note on future work.
__________________________________________________________________________________
2 Background
__________________________________________________________________________________ In this chapter, the theoretical framework of this dissertation is provided. Firstly, in Section 2.1, the current knowledge of multiple sclerosis, particularly of cortical pathology, is given. Then, in Section
2.2, the principles of Magnetic Resonance Imaging (MRI), as well as an overview of ultra-high field
MRI, image contrast in MRI and MRI image processing, are described. Lastly, Section 2.3 highlights the significance of MRI in the study and diagnosis of multiple sclerosis, as well as its role in the assessment of cortical lesions.
2.1 Multiple Sclerosis
2.1.1 Overview of Multiple Sclerosis
Multiple sclerosis (MS) is considered the most prevalent chronic inflammatory disease of the central nervous system (CNS), affecting more than 2 million people around the world. It predominately affects individuals in their early adult life and is more common amongst females [10],[11].
It remains unknown whether MS has a single, or various, causes. Still, multiple genetic and environmental risk factors have been appointed as prompters of the disease. Amongst the environmental risk factors are a deficiency in vitamin D, diet and obesity in early life and cigarette smoking. Infectious agents can also play a role in the disease. The evidence of genetics in the development of MS is related to the HLA region of chromosome 6, implicated in the development of several autoimmune diseases. Carriers of the HLA DRB1*15:01 allele appear three times more likely to develop MS than non-carriers [12],[13].
The immune system plays a key role in the disease, particularly the adaptive immune system. Inflammation, which only occurs in the CNS, seems to be initiated by either a primary activation by extrinsic antigens, where pathogens are processed in peripheral tissues by dendritic cells, or by a primary activation by intrinsic antigens, where a release of antigens occurs in the CNS due to oligodendrocyte death. In summary, one event would be caused by an adaptive immune response, whilst the other would be a result of an intrinsic disturbance in the homeostasis of the CNS that also triggers an adaptive immune response. These responses give rise to an immune reaction in the lymphoid tissue and to a consequent invasion of lymphocytes, which include T cells and B cells, into the CNS. This results in lesions that appear throughout the CNS [14].
Multiple sclerosis lesions correspond to areas of demyelination, astrocytic gliosis and axonal or neuronal loss, often referred to as neurodegeneration. Similar to the disease that expresses heterogeneity in its clinical course and response to therapy, the neuroradiological appearance of white matter (WM) lesions across subjects is also known to be heterogeneous, evolving over the course of months and suggesting a single immune-effector mechanism that dominates in each individual. Due to this heterogeneity, the identification of noninvasive biomarkers associated with lesion patterns will aid in the design of personalized therapies [11],[15].
Demyelination is also present in grey matter (GM) with half of the lesions found to be of perivascular nature. When the inflamed vessel is located near the leukocortical junction, the
demyelination also affects the juxtacortical WM. Lesions can also project radially from microvessels. The remaining cortical lesions arise intracortically from the pial surface, often affecting several adjacent gyri [11],[16],[17].
The spinal cord and optic nerve can also be targeted in MS. In the spinal cord, atrophy is a result of focal inflammatory demyelination and neuroaxonal degeneration. Retinal damage found in the optic nerve is expressed by substantial thinning of the retinal nerve-fiber and ganglion-cell layers. This thinning is a consequence of tissue atrophy as well as neuronal and axonal loss. These neuropathological events can be studied in vivo using conventional and advanced imaging techniques [11],[18],[19].
MS lesions tend to result in symptoms of motor, sensory, cognitive or neuropsychiatric nature. The three most common and disabling motor symptoms in MS include spasticity, tremor, and gait impairment [20]. Changes in motor neuron excitability, presynaptic blocks, or a reduction in voluntary effort, may explain muscle weakness as well as the frequent sense of fatigue showed by these patients [21]. Sensory symptoms are often associated with numbness, paresthesias or changes in response to pain or temperature [22].
Cognitive impairment is also common in MS and has high prevalence rates at both early and late stages of the disease. The most commonly affected cognitive functions are attention, information processing efficiency and speed, as well as long-term memory [23]. Neuropsychiatric symptoms can also manifest in the disease and include personality changes, depression or bipolar disorder, affective disturbances, euphoria and suicidal ideation. Such symptoms are most commonly found in patients in advanced stages of the disease [21].
Even though the course of the disease can be unpredictable, individual cases have frequently been characterized as either chronic-progressive or relapsing/remitting. In the first, a gradual and steady deterioration is expected, while the second follows a stepwise degenerative path of exacerbations interspersed with periods of stability or even slight improvements [21].
About 85% of patients start by showing a recurrent and reversible course of the disease. This phase is termed relapsing–remitting multiple sclerosis (RRMS) and is associated with focal areas of inflammatory demyelination in which myelin, myelin-forming cells and axons are destroyed. The resolution of the inflammation and edema, as well as remyelination, contribute to the recovery or remission of these patients. This can also be achieved with corticosteroids, yet, the efficacy of corticosteroids in speeding up recovery after relapses will decrease over time. This stage of the disease can last for years or decades, with relapse rates varying from patient to patient [24],[25]. Figure 2.1a schematically depicts the relapsing–remitting course of the disease.
The majority of patients presenting RRMS are expected to enter a second phase associated with continuous, irreversible neurological changes unrelated to relapses. We denominate this stage secondary progressive multiple sclerosis (SPMS). Figure 2.1b schematically depicts the secondary progressive course of the disease.
Finally, the remaining 15% of MS patients tend to show a chronic-progressive course of the disease. We term this stage primary progressive multiple sclerosis (PPMS), in which relapses are rare or nonexistent and the clinical disease onset tends to occur later in life [24]. Figure 2.1c schematically depicts the primary progressive course of the disease.
Figure 2.1: Schematic representation of the three types of multiple sclerosis: relapsing–remitting (a), secondary
progressive (b) and primary progressive (c) [26].
The diagnostic criteria for MS follows a set of guidelines, often referred to as the McDonald criteria, which include a combination of criteria both of clinical as well as paraclinical nature to demonstrate the dissemination of lesions in space (DIS) and in time (DIT) and to exclude alternative diagnoses [27].
Even though the diagnosis of MS could be made on clinical grounds alone, magnetic resonance imaging (MRI) of the CNS has proved to be a useful tool supporting, supplementing and replacing some clinical criteria. Blood tests and cerebrospinal fluid (CSF) analysis can also be used for the diagnosis of MS, with the presence of two or more oligoclonal bands or a high immunoglobulin index adding as evidence of MS. Lastly, visual evoked potentials may provide additional support, especially in situations in which MRI abnormalities are few or have lesser specificity [27],[28].
As of December 2017, the Food and Drug Administration (FDA) has approved 15 medications for altering the course of multiple sclerosis. These medications are mostly approved for RRMS and aim at reducing the likelihood of the growth of new lesions, clinical relapses, and stepwise accumulation of disability. The major therapeutic goal of MS research is the prevention of SPMS. However, due to the unpredictability of this condition, optimal treatment and disease management remains a challenge, leading to a focus on the improvement of the quality of the everyday life of these patients [11],[24].
2.1.2 Cortical Lesions in Multiple Sclerosis
Around the 1960s, there was still little research on grey matter pathology from post-mortem studies. In a study from 1962, in a series of 22 cases it was found that 26% of all lesions were located in the cortex [29].In 1970, another study with 60 cases found that the cortex was involved in 93% of the cases [30]. It was only decades later, with advances in imaging techniques, animal model studies and immunohistochemical analysis, that the fine cellular pathology associated with grey matter demyelination started to be unraveled [2].
A first categorization of cortical lesions into different classes was only proposed in 1999. At the time, cortical lesions were divided into seven different classes where the majority were associated with lesions found around the principal cortical veins. The remaining arose within the territory of smaller, superficial veins [2]. A simplification was made two years later reducing the number of cortical lesion types to three [31]. The currently accepted cortical lesion classification divides lesions into four types: type I or leukocortical lesions, lesions extending through both white and grey matter; type II lesions also called intracortical lesions, usually small and perivascular lesions found deep within the cortex that do not make contact with the brain surface of subcortical WM; and type III and IV, both subpial lesions but the former extends partly through the cortical width whereas the latter extends fully throughout the
cortical width, sometimes extending over several gyri or entire lobes [17],[32]. Figure 2.2 depicts the different types of cortical lesions as assessed by histology.
Grey matter damage is thought to be either caused by inflammatory or non-inflammatory mechanisms. Inflammatory mechanisms are assumed to be a result of adaptive or innate immune responses. In the case of adaptive immunity, microglia activation and oligodendrocyte injury is caused by the release of cytotoxic molecules by infiltrates, such as infectious agents, in the meningeal space and/or in the adjacent perivascular spaces [33]. Some candidates for infectious agents are the Epstein– Barr virus or the Torque Teno virus [34],[35]. It could also be a result of cell contact-dependent mechanisms associated with T-cell mediated damage [36]. This response leads to neuronal cell death which results in morphological alterations in the cerebral cortex. Innate inflammatory mechanisms can also lead to microglial activation. Chronic inflammation of the subarachnoid or perivascular spaces, susceptibility to environmental factors like toxins, or neuronal loss can have a triggering effect, resulting in chronic and abnormal microglial response which leads to further grey matter damage [37],[38],[39]. In contrast, non-inflammatory mechanisms are thought to result from primary neurodegeneration and retrograde degeneration. The first is a result of metabolic compromise, particularly mitochondrial damage caused by reactive oxygen species produced by activated microglia and macrophages [40]. Retrograde degeneration would be caused by white matter damage, propagating backwards in cortical neurons whose axons have been damaged in white matter lesions or along white matter tracts, for instance, the corticospinal tract [33].
The relationship between white matter and grey matter damage and the causes of grey matter pathology remain to be fully understood today. Some studies suggest that white matter damage could lead to cortical damage, with white matter damage resulting in retrograde injury to frontal, temporal and motor cortical areas [41]. Moreover, cross-sectional MRI studies have shown significant correlations between the total volumes of grey matter and white matter in T1- and T2-weighted lesions [42].
Other studies suggest that white matter pathology cannot fully explain grey matter damage. For instance, cortical demyelination has been shown to exceed white matter demyelination [18] and most times cortical demyelination is found in regions where white matter is unaffected, with no correlation found between the two tissues [43]. Therefore, even though the involvement of axonal damage in retrograde loss of neurons has been established, this mechanism does not entirely explain the spectrum of grey matter pathology in multiple sclerosis. These studies highlight the importance of the independent study of grey matter pathology to assess its relevance in multiple sclerosis.
Grey matter pathology seems to be an early and frequent phenomenon in the disease [3]. A study found that cortical lesions were detected by MRI in the majority of patients with RRMS and SPMS [44]. Furthermore, in some patients, cortical damage would be denoted even before the appearance of lesions in white matter [45]. This emphasizes the semi-independent relationship that seems to exist between GM and WM but also the apparent early damage to the cortex in MS.
With regards to lesion location, post-mortem studies revealed that the representation of cortical damage is uneven. Demyelination was found to be more predominant in the cingulate gyrus, temporal and frontal lobes, in comparison with the occipital and paracentral lobe or the primary motor cortex [17], [18],[43].Evidence of extensive demyelination was also found in the hippocampus [46].
Figure 2.2: The different types of cortical lesions as detected histologically [17]. The cerebral cortex/white matter
borders are delineated by closed arrows. The lesion borders are delineated by open arrows. Images A, B, C and D, depict lesion types I, II, III and IV, respectively. Abbreviations: WM = white matter; CTX = cerebral cortex.
Cortical lesions have been shown to correlate with physical disability and cognitive dysfunction [3]. One way to assess this is through the Expanded Disability Status Scale (EDSS) score, a method used in clinical practice as a means of quantifying and monitoring disability in MS patients. In a study which looks at the association between cortical lesion load and disability progression in MS, it was found that the EDSS score correlated with the number and volume of cortical lesions. In this regard, higher volumes or number of cortical lesions led to higher EDSS scores [47]. When looking at cognitively impaired RRMS patients, they presented a significantly higher number and volume of cortical lesions compared to those patients without cognitive deficits [45].
It has also been stated that the extent of cortical damage significantly influences the risk of entering a progressive phase. When investigating the relationship between cortical damage, the number of early relapses and the long-term course of MS, in the group with focal cortical damage at clinical onset, the probability of converting to SPMS increased proportionally with the number of cortical lesions [48].
These studies demonstrate the clinical relevance of cortical pathology in multiple sclerosis but highlight the present limited knowledge of cortical lesions and their impact in the disease and everyday life of the patients. MRI has enabled a better understanding of cortical pathology, but the biggest advance towards improving the detection and visualization of cortical lesions, thus giving insight into cortical damage, has come from ultra-high field (UHF) magnetic resonance imaging (MRI) systems. A more comprehensive analysis of the potential of UHF-MRI in MS will be given in Section 2.3 of this dissertation.
2.2 Magnetic Resonance Imaging
2.2.1 Principles of Magnetic Resonance
Magnetic Resonance (MR) was first mentioned experimentally by Felix Bloch and Edward Purcell, awarded in 1952 with the Nobel Prize for Physics for their developments of new methods for nuclear magnetic precision measurements [49],[50]. However, it was not until Raymond Damadian’s in vitro studies of rat tumors that its medical value was finally understood [51]. The formation of images stems from work from Paul Lauterbur in 1973 [52], while the production of images came a year later
from the work of Sir Peter Mansfield’s group [53], awarding both with the Nobel Prize in Physiology or Medicine in 2003. Since then, many other researchers have contributed to the development of MR [54].
Magnetic Resonance Imaging (MRI) is an imaging modality that makes use of the magnetic properties of tissues in order to produce an image. It makes use of the hydrogen nuclei, abundant in the human body and found in water molecules as well as in fat. The hydrogen atom is a singly positively charged proton. For that reason, it will spin around its own axis, creating a magnetic moment that can interact with magnetic fields. When placed in a strong external magnetic field, the proton experiences a turning force, or torque, which tries to align its moment with the main field, similar to the way a compass needle aligns itself to the earth’s magnetic field. As the proton cannot fully align with the external field, it will continue to experience a torque, resulting in a precession movement around the direction of the field. The frequency of precession is proportional to the external magnetic field and given by the Larmor equation:
𝜔0= 𝛾𝐵0 (Equation 2.1)
where 𝛾 is the gyromagnetic ratio constant, 𝜔0 the angular frequency and 𝐵0 the external magnetic field.
This equation entails that under the same magnetic field, all protons will precess with the same Larmor frequency. This is known as the resonance condition [55].
It is hard to measure the magnetization of the body in an equilibrium situation, when it is parallel to 𝐵0. By tipping it into the xy plane (the transverse plane) by means of a 90-degree pulse, the average
of the spins in the body, also known as the net magnetization, M0, will generate a significant signal
which can be measured. This is done by means of a radiofrequency (RF) pulse [55].
As soon as the RF pulse ends, the protons begin to relax back to their initial state. This leads to a dephasing of the spins and a realignment along the z axis. The signal measured starts to decay exponentially to zero due to the dephasing of the protons. This signal is called Free Induction Decay (FID) and is caused mainly by the inhomogeneity in the main static field. It is, additionally, a result of the interaction between spins, the spin-spin relaxation, which gives rise to the relaxation time T2. The loss of transverse magnetization is governed by the following equation [56]:
𝑀𝑥𝑦= 𝑀0𝑒−𝑡/𝑇2 (Equation 2.2)
When protons interact with surrounding tissues, the lattice, energy is absorbed and lost. With the loss of extra energy, the protons start to return to the equilibrium state, bringing the magnetization along the z axis, Mz, back to M0. This is the spin-lattice relaxation, described by the relaxation time T1.
The recovery of longitudinal magnetization is described by the equation:
𝑀𝑍 = 𝑀0(1 − 𝑒−𝑡/𝑇1) (Equation 2.3)
T1, unlike T2, is dependent on the field strength and increases with the increase in field strength. Moreover, the value of T1 depends on the surrounding tissues, as the transfer of energy will be more efficient if the frequency of the excited protons corresponds to that of the neighboring molecules [56].
The FID signal is never measured directly. This is caused by the difficulty in measuring the MR signal immediately after the 90-degree pulse, as well as by the inhomogeneities in the magnetic field which produce variations in the frequency of precession of the sample volume indistinguishable from the T2 signal decay. Therefore, the magnitude reduction of the FID signal is a result of the dephasing caused by spin-spin interactions, accounted for in the time constant T2, as well as from the dephasing
caused by the magnetic field inhomogeneities, accounted for in constant T2*. The dephasing accounted for in T2* is a result of the MR equipment, with stronger magnets associated with higher inhomogeneity effects. This effect can be reduced by means of a rephasing pulse, common in spin-echo sequences [57]. Instead of measuring the FID directly, two types of echo are measured: the gradient (GRE) and spin (SE) echoes. In the case of the former, a negative gradient is applied shortly after the excitation, which causes a rapid dephasing of the transverse magnetization. This is followed by a positive gradient which reverses the magnetic field gradient which will alter the frequency of precession and change the phasing of the spins. The height of the echo (SGE) is defined by the FID decay curve:
𝑆𝐺𝐸= 𝑆0 𝑒𝑥𝑝 (− 𝑇𝐸 𝑇2∗)
(Equation 2.4)
which depends on the relaxation time T2*. In the case of the spin-echo sequence, the spins dephase naturally after the 90-degree pulse. Then, a 180-degree pulse is applied which flips the spins about the y axis. This pulse does not impact the spins’ frequency of precession, but it reverses the phase angles. Over time, the spins return to the positive side of the y axis and create an echo. The spin signal is dependent on T2 [55]:
𝑆𝑆𝐸 = 𝑆0 𝑒𝑥𝑝 (− 𝑇𝐸
𝑇2)
(Equation 2.5)
Amongst the sequence parameters we find the time or repetition (TR) and the time of echo (TE). The TR is the time between a series of consecutive points. The TE is the time difference between the pulse of the RF-pulse and the peak measurement of the echo. It is the choice of pulse sequences and parameters that allows the acquisition of images with different contrasts.
Another important sequence is denominated Inversion Recovery (IR). This sequence resembles the SE sequence but is preceded by a 180-degree pulse which reverses the longitudinal magnetization. After that, the tissues undergo T1 relaxation in search for a recovery of magnetization along the positive direction. Upon the 90-degree pulse, the initial longitudinal magnetizations of different tissues are separated based on their different T1 relaxation times and a selection of a proper time of inversion (TI) value can lead to the suppression of certain tissues from the final image. This sequence contains a third time parameter, the inversion time, which corresponds to the distance between the 180-degree pulse and the 90-degree pulse [55].
MRI involves three types of magnetic field: the main magnetic field (B0), the oscillating magnetic
field of the RF pulses (B1) and gradients. The latter is the element responsible for the localization of MR
signals within the body and the basis of magnetic resonance imaging. The MR signals are encoded by means of spatial frequencies using phase encoding and frequency-encoding gradients. Every spatial frequency is sampled before a Fourier transform is used to alter this data and produce the MR image. The several echoes acquired in each TR are stored in a matrix often referred to as the k-space and it is the application of the Fourier transform to the k-space that enables the reconstruction of the MR image from all spatial frequencies. This is done under the assumption that any function can de decomposed into a set of periodic signals. The center of k-space corresponds to the low spatial frequencies, which ensure the structure of the image, while its edges contain the high spatial frequency, responsible for the details of the image [55].
2.2.2 Ultra-high Field MRI
Since the first developments in MR in the 1950s, a race for stronger magnetic fields had begun to overcome the inherently low sensitivity of this promising method [58]. Although until recently the highest available field used in clinical practice was 3 Tesla (T), since the 1990s it has become possible to use systems up to 9.4 T for neuroscientific and clinical research [59]. Some of the imaging techniques initially developed at 1.5 T but already applicable at 7 T include high-resolution anatomical MRI, functional MRI (fMRI), functional MR-Angiography, and susceptibility weighted imaging[60].
The most significant positive change with increasingly higher fields is the signal-to-noise ratio (SNR), the ratio of signal intensity in the image to level of noise. Early work demonstrated that the SNR parameter increases linearly with the external magnetic field, B0 in the case of sample-dominated noise,
most common in human imaging. This increase in SNR can be invested into higher spatial resolution or into higher temporal resolution in the case of dynamic processes [59].
A second parameter that increases with higher fields is the contrast-to-noise ratio (CNR), relevant in diagnostic imaging, particularly with regards to the ability to distinguish areas of interest, such as lesions, from normal tissue. The CNR parameter is given by the equation:
𝐶𝑁𝑅 = 𝑆2−𝑆1𝑛𝑜𝑖𝑠𝑒 (Equation 2.6)
where S2 is the signal in the area of interest, S1 is the signal in the surrounding normal tissue and noise is the noise of the acquisition. As there are various imaging parameters that are dependent on field strength, it is no surprise that several MRI applications should profit from an increase in magnetic field strength. A prime example is fMRI, which provides mapping of areas of cortical activation during cognitive or motor tasks from blood-oxygen-level-dependent (BOLD) contrast [59].
The possibility of imaging with higher spatial resolutions is one of the advantages of ultra-high field (UHF) MRI. However, even with increased SNR at UHF, imaging times for high resolutions are long, which results in high motion sensitivity rates. This motion is a result of the long acquisition times as well as of higher motion sensitivities when measuring in smaller voxels. Due to hardware imperfections of the MRI systems, this motion will result not only in a shift and rotation of the images but also in geometric distortions due to gradient non-linearity and magnetic field variations, also called field inhomogeneities [59].
In the field of neuroimaging, ultra-high magnetic fields, such as 7 T, have allowed the visualization of the brain with unprecedented detail. In structural imaging, the increase in SNR and in image resolution allowed MR imaging to display finer anatomic detail. This is particularly relevant in neurological disorders, leading to an increase in lesion conspicuity, and a more accurate detection and characterization of brain abnormalities. This improvement in brain visualization can also be extended to other fields of MRI, including vascular and functional imaging, MR spectroscopy, diffusion MRI and multinuclear imaging[61].
2.2.3 MR Image Contrast
The choice of pulse sequences and the variation in acquisition parameters allows the creation of images with different contrasts. In fact, the interest in having a wide variety of MR sequences stems from the possibility to generate different types of contrast, and as a result, to extract different types of information. Every year, new pulse sequences are launched but, essentially, the majority of sequences fall upon one of the two major pulse sequence families: SE or GE. Both families exploit T1 or T2
![Figure 2.1: Schematic representation of the three types of multiple sclerosis: relapsing–remitting (a), secondary progressive (b) and primary progressive (c) [26]](https://thumb-eu.123doks.com/thumbv2/123dok_br/19186945.948005/23.892.112.773.114.291/schematic-representation-sclerosis-relapsing-remitting-secondary-progressive-progressive.webp)
![Figure 2.2: The different types of cortical lesions as detected histologically [17]. The cerebral cortex/white matter borders are delineated by closed arrows](https://thumb-eu.123doks.com/thumbv2/123dok_br/19186945.948005/25.892.230.663.109.365/figure-different-cortical-lesions-detected-histologically-cerebral-delineated.webp)
![Figure 2.4: The different types of cortical lesions detected with 7 T T2* MRI in a post-mortem study [6]](https://thumb-eu.123doks.com/thumbv2/123dok_br/19186945.948005/37.892.257.633.739.1118/figure-different-types-cortical-lesions-detected-mortem-study.webp)