Visceral Fat Accumulation, Insulin Resistance,
and Elevated Depressive Symptoms in
Middle-Aged Japanese Men
Shuichiro Yamamoto
1*
, Yumi Matsushita
2, Toru Nakagawa
1, Toru Honda
1,
Takeshi Hayashi
1, Mitsuhiko Noda
3, Tetsuya Mizoue
41Occupational Health Section, Hitachi, Ltd., Hitachi Health Care Center, Hitachi city, Ibaraki, Japan, 2Department of Clinical Research, Center for Clinical Sciences, National Center for Global Health and Medicine, Shinjuku-ku, Tokyo, Japan,3Department of Endocrinology and Diabetes, Saitama Medical University, Iruma-gun, Saitama, Japan,4Department of Epidemiology and Prevention, Center for Clinical Sciences, National Center for Global Health and Medicine, Shinjuku-ku, Tokyo, Japan
Abstract
Objective
To investigate visceral fat accumulation and markers of insulin resistance in relation to
ele-vated depressive symptoms (EDS).
Methods
Participants were 4,333 male employees (mean age, 49.3 years) who underwent abdominal
computed tomography scanning, measured fasting insulin, and did not self-report diabetes
and mental disorders under treatment and history of cancer, myocardial infarction, and
stroke. Multivariable logistic regression was used to assess the association of EDS with
abdominal fat deposition and markers of insulin resistance.
Results
Visceral fat area (VFA) and fasting insulin were significantly, positively associated with
EDS. Multivariable-adjusted odds ratios (95% confidence interval) of high VFA for the
low-est through highlow-est quartile of depression score were 1 (reference), 1.18 (0.97
–
1.42), 1.25
(1.02
–
1.54), 1.23 (1.01
–
1.51), respectively, and corresponding figures for high fasting
insu-lin were 1 (reference), 0.98 (0.80
–
1.19), 1.12 (0.91
–
1.38), and 1.29 (1.06
–
1.57),
respec-tively. Subcutaneous fat area was not associated with EDS.
Conclusions
Results suggest that EDS is related to visceral, but not subcutaneous, fat accumulation and
insulin resistance in middle-aged Japanese men.
OPEN ACCESS
Citation:Yamamoto S, Matsushita Y, Nakagawa T, Honda T, Hayashi T, Noda M, et al. (2016) Visceral Fat Accumulation, Insulin Resistance, and Elevated Depressive Symptoms in Middle-Aged Japanese Men. PLoS ONE 11(2): e0149436. doi:10.1371/ journal.pone.0149436
Editor:Yue Wang, National Institute for Viral Disease Control and Prevention, CDC, China, CHINA
Received:October 5, 2015
Accepted:January 30, 2016
Published:February 18, 2016
Copyright:© 2016 Yamamoto et al. This is an open access article distributed under the terms of the
Creative Commons Attribution License, which permits unrestricted use, distribution, and reproduction in any medium, provided the original author and source are credited.
Data Availability Statement:All relevant data are within the paper.
Introduction
Numerous studies have reported the association of obesity or diabetes with depression [
1
–
6
].
Depression is associated with an increased risk of diabetic complications and mortality among
patients with diabetes [
7
,
8
]. The relationship between depression and obesity or diabetes may
be bidirectional [
5
,
6
]. Potential mechanisms underlying these associations include
hypotha-lamic-pituitary-adrenal axis (HPA-axis) dysregulation with hypercortisolemia [
9
],
inflamma-tion [
10
], influences of lifestyle behaviors [
11
,
12
] and side effect of antidepressants [
13
].
In spite of accumulating epidemiological and experimental evidence linking depression to
obesity, it remains unclear which fat deposition is associated with depression. Some studies
reported a significant association between abdominal obesity (waist-hip ratio or waist
circum-ference) and depression [
14
–
16
], suggesting a role of abdominal adiposity in mood regulation.
In small-scale studies with the use of computed tomography (CT) or magnetic resonance
tomography, depressed patients had higher visceral fat mass than non-depressed individuals
[
17
–
19
]. In a few large-scale population-based studies in Western countries that measured
abdominal fat deposition with the use of CT [
20
–
22
], depressive symptoms were associated
with visceral adipose accumulation; of these, one study additionally assessed subcutaneous fat
[
20
] but found no association with depressive symptoms. Given that Japanese men have a
larger visceral adipose tissue than Caucasian men in the same levels of waist circumference
[
23
], it would be of interest to examine the association between abdominal adiposity and mood
among the Japanese population. As regards glucose metabolism, it remains unclear whether
pre-diabetic status including insulin resistance is associated with depression [
24
]. To address
these issues, we investigated cross-sectionally the association of elevated depressive symptoms
(EDS) with abdominal fat deposition measured with CT and markers of insulin resistance
among Japanese men.
Methods
Study participants
The Hitachi Health Study is an ongoing study among employees (including retired employees)
and their spouses who underwent a comprehensive health checkup at Hitachi Health Care
Center (Hitachi, Japan), as described elsewhere [
25
,
26
]. Of 17,606 examinees during 2008 fiscal
year (between April 2008 and March 2009), 6,996 underwent an abdominal CT. Of these,
4,971 non-retired employees received health examinations in fasting condition (fasted at least
12 h) and had data on all variables used in the present study. We excluded 251 patients with
diabetes under treatment, 87 patients with mental disorders under treatment, 73 with history
of cancer, 20 with history of myocardial infarction and 20 with history of cerebrovascular
dis-ease. We excluded 187 women, leaving 4,333 men for analysis. The objective and procedure of
the study were announced by using explanatory leaflet and poster. Written informed consent
was obtained from each participant who agreed to provide his/her data for research. The study
protocol was approved by the Ethics Committee of the Hitachi Health Care Center and the
Ethics Committee of National Center for Global Health and Medicine, Japan.
Assessment of exposure (depressive symptoms)
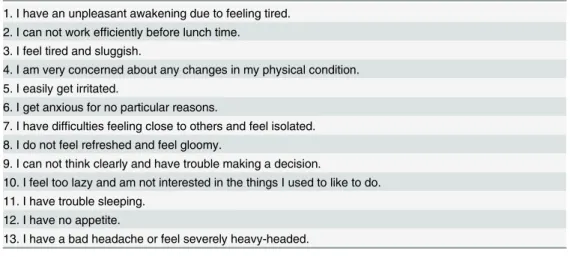
Physical and psychological symptoms were assessed using a questionnaire that was developed
for health checkup. From that questionnaire, 13 questions on sleep disturbance, poor appetite,
gloomy feeling, diminished interest, fatigue, daily fluctuation, irritation and indecision
(
Table 1
) were selected to assess depression status, according to an advice of a psychiatrist.
These questions are similar to those of widely-used depression scales including the Zung
Self-additional role in the study design, data collection and analysis, decision to publish, or preparation of the manuscript. The specific roles of these authors are articulated in the‘author contributions’section.
rating Depression Scale (SDS) or the Center for Epidemiologic Studies Depression Scale
(CES-D). Specifically, 7 questions selected (
‘
No1
’
,
‘
No 3
’
,
‘
No 5
’
,
‘
No 9
’
,
‘
No 10
’
,
‘
No11
’
and
‘
No
12
’
) were similar to those in SDS and 5 (
‘
No 7
’
,
‘
No 8
’
,
‘
No 9
’
,
‘
No11
’
and
‘
No12
’
) to those in
CES-D. Respondents were asked to choose their answer from among 4 response options (
‘
1
no
’
,
‘
2 sometimes
’
,
‘
3 often
’
and
‘
4 always
’
) for the questions
‘
No. 1
’
to
‘
No. 12
’
and among 3
options (
‘
1 no
’
,
‘
2 yes
’
and
‘
3 severe
’
) for the question
‘
No. 13
’
. In order to assign an equal
weight to all these questions, the scores of 2 and 3 for the question
‘
No. 13
’
were converted to
2.5 and 4, respectively. Depression score was then calculated as the sum of the scores across the
questions. Pearson correlation coefficient between the score calculated from the selected
ques-tions and SDS score was 0.752 [
27
].
Assessment of outcomes (abdominal obesity and glucose metabolism)
The visceral fat area (VFA) and subcutaneous fat area (SFA) at the umbilical level was
mea-sured using a CT scanner (Radix turbo; Hitachi Medico, Tokyo, Japan) while the examinee was
in a supine position and estimated using a PC software (fatPointer; Hitachi Medico, Tokyo,
Japan). The imaging conditions were 120 kV and 50 mA, using a 5-mm-thick slice. Glucose
was measured using glucose oxidase enzyme electrode method (A&T, Tokyo, Japan). Serum
insulin (
μ
U/mL) was determined by an immunoenzymatic method using the AxSYM insulin
assay (Abbott Laboratories, Tokyo, Japan). Homeostasis model assessment of insulin resistance
(HOMA-IR), an index of insulin resistance, was calculated as fasting glucose (mg/dL)
multi-plied by fasting insulin (
μ
U/mL) divided by 405. Hemoglobin A1c (Japan Diabetes Society
[JDS]) was measured using a high-performance liquid chromatography method (HLC723-G9;
Tosoh, Tokyo, Japan) and converted to National Glycohemoglobin Standardization Program
equivalent value according to the formula: Hemoglobin A1c (%) = Hemoglobin A1c (JDS)
(%) + 0.4% [
28
]. VFA, SFA, fasting insulin and HOMA-IR were categorized into quartiles and
the highest groups were defined as outcomes which were named as follows:
‘
high VFA
’
,
‘
high
SFA
’
,
’
high fasting insulin
’
and
‘
high HOMA-IR
’
.
‘
Overweight/obesity
’
(BMI
25 kg/m
2) and
‘
high fasting glucose
’
(fasting plasma glucose
110 mg/dl) were also defined as outcomes.
Assessment of other variables
Health-related lifestyles including smoking, alcohol drinking, as well as current and past history of
diseases including diabetes, cancer, myocardial infarction, stroke and mental disorder were
Table 1. Questions used for assessing depression status.1. I have an unpleasant awakening due to feeling tired. 2. I can not work efficiently before lunch time.
3. I feel tired and sluggish.
4. I am very concerned about any changes in my physical condition. 5. I easily get irritated.
6. I get anxious for no particular reasons.
7. I have difficulties feeling close to others and feel isolated. 8. I do not feel refreshed and feel gloomy.
9. I can not think clearly and have trouble making a decision.
10. I feel too lazy and am not interested in the things I used to like to do. 11. I have trouble sleeping.
12. I have no appetite.
13. I have a bad headache or feel severely heavy-headed.
ascertained via a questionnaire. As regards physical activity, walking commuting to and from work
(min/day) and up to three leisure-time physical activities (frequency and duration of time/day)
were asked. MET value (MET-min/week) was calculated by multiplying weekly duration of time
engaged in each activity by the corresponding MET, and summing the values across all activities.
Height and weight were measured using an automated scale (BF-220; Tanita, Tokyo, Japan). Body
mass index (BMI) was calculated as the weight (kg) divided by the square of the height (m
2).
Statistical analyses
Baseline characteristics were compared across quartiles of depression score by using one-way
analysis of variance (continuous variables) or chi-squared test (categorical variables). The means
of age and depression score across quartiles of obesity/metabolic factors were tested by one-way
analysis of variance. Multivariable logistic regression was used to estimate odds ratios (ORs) and
95% confidence intervals (95% CIs) for having overweight/obesity, high VFA, high SFA, high
fasting glucose, high fasting insulin and high HOMA-IR for each quartile of depression score,
with the lowest quartile as the reference. Variables adjusted for in model 1 were age (years,
con-tinuous), smoking (never, past or current), alcohol use (nondrinker, drinker consuming
<
1,
1
–
1.9 or
2
go
of sake-equivalent ethanol per day; 1
go
of sake contains 23 g ethanol) and leisure
time and commuting physical activity (
400 or
<
400 METs-min/week). BMI (kg/m
2,
continu-ous) was additionally adjusted for in model 2. SFA (cm
2, continuous) was added to model 1
when estimating OR for high VFA (model 3), whereas VFA (cm
2, continuous) was added to
model 1 when estimating OR for high SFA (model 4). We assessed
p
for trend with 1 to 4 being
assigned to increasing quartile of depression score and treated as continuous. All analyses were
performed using SPSS for Windows, Version 16.0 (SPSS Inc., IL, USA).
Results
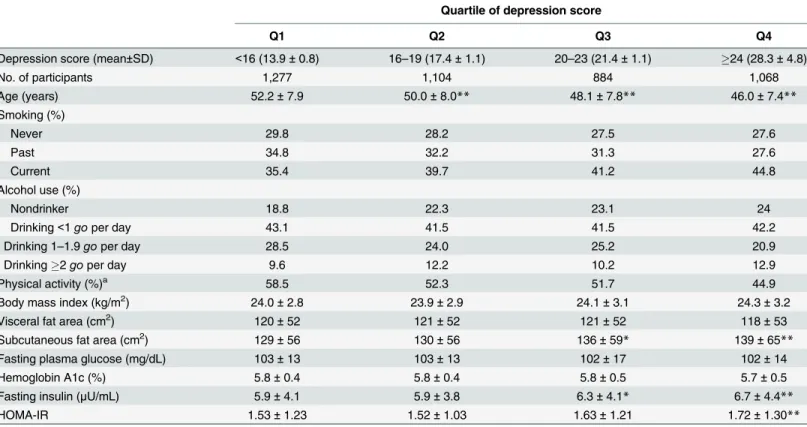
As shown in
Table 2
, participants with high depression scores were significantly younger and
tended not to engage in physical activity than those with low depression scores. Participants in
the highest quartile of depression score showed significantly higher SFA, fasting insulin and
HOMA-IR levels than those in the lowest quartile of depression score.
As shown in
Table 3
, participants in the highest quartile of BMI or SFA were significantly
younger than those in the lowest BMI or SFA. In contrast, participants with the high VFA (Q2
to Q4) were significantly older than those with the lowest VFA. In univariate analysis,
partici-pants in the highest quartile of SFA had significantly higher depression score than those in the
lowest SFA. Participants with high level of fasting insulin (Q2 to Q4) and HOMA-IR (Q2 to
Q4) had significantly higher depression score than those with the lowest.
Table 4
shows the associations between obesity indices, markers of insulin resistance and
the depression score. Depression score was significantly associated with VFA and fasting
insu-lin in men; multivariable-adjusted ORs (95% CI) of high VFA for the lowest through highest
quartile of depression score were 1 (reference), 1.18 (0.97
–
1.42), 1.25 (1.02
–
1.54), 1.23 (1.01
–
Discussion
In the present analysis of male employees without treated diabetes and mental disorder, VFA
and fasting insulin, but not SFA, were significantly associated with EDS after multivariable
adjustment. This study is among a few large-scale population-based studies that reported
depressive symptoms in relation to type of abdominal fat deposition and, to our knowledge,
the first such study in Asia.
Smaller scale studies (n
<
500) that assessed abdominal fat accumulation using a CT or
mag-netic resonance tomography reported a significant association between depression and visceral
fat deposition in women [
17
–
19
]. In a large CT study among a middle-aged population
(n = 3,299), Murabito et al found a significantly increased odds of depressive symptoms in
women, but not in men, with high visceral fat accumulation [
20
]. Vogelzangs et al showed that
high visceral fat at baseline was associated with a significantly increased risk of depression
onset in older men, but not in older women [
21
]. Remigio-Baker et al. reported a significant
relationship between EDS and visceral adiposity in men, but not in women [
22
]. Although
sex-difference in association has been documented, the present result together with previous data
suggest a role of VFA in mood disorder.
In a large study of middle-aged men and women [
20
], subcutaneous adipose tissue was not
significantly associated with EDS in both sexes. Similarly, the present study did not find a
Table 2. Characteristics of study participants.Quartile of depression score
Q1 Q2 Q3 Q4
Depression score (mean±SD) <16 (13.9±0.8) 16–19 (17.4±1.1) 20–23 (21.4±1.1) 24 (28.3±4.8)
No. of participants 1,277 1,104 884 1,068
Age (years) 52.2±7.9 50.0±8.0** 48.1±7.8** 46.0±7.4**
Smoking (%)
Never 29.8 28.2 27.5 27.6
Past 34.8 32.2 31.3 27.6
Current 35.4 39.7 41.2 44.8
Alcohol use (%)
Nondrinker 18.8 22.3 23.1 24
Drinking<1goper day 43.1 41.5 41.5 42.2
Drinking 1–1.9goper day 28.5 24.0 25.2 20.9
Drinking2goper day 9.6 12.2 10.2 12.9
Physical activity (%)a 58.5 52.3 51.7 44.9
Body mass index (kg/m2) 24.0±2.8 23.9±2.9 24.1±3.1 24.3±3.2
Visceral fat area (cm2) 120±52 121±52 121±52 118±53
Subcutaneous fat area (cm2) 129±56 130±56 136±59* 139±65**
Fasting plasma glucose (mg/dL) 103±13 103±13 102±17 102±14
Hemoglobin A1c (%) 5.8±0.4 5.8±0.4 5.8±0.5 5.7±0.5
Fasting insulin (μU/mL) 5.9±4.1 5.9±3.8 6.3±4.1* 6.7±4.4**
HOMA-IR 1.53±1.23 1.52±1.03 1.63±1.21 1.72±1.30**
HOMA-IR: homeostasis model assessment of insulin resistance, Data are means±standard deviation unless stated otherwise a
Combined activities on leisure and commuting (walking) to and from work400 MET-min per week *P<0.05 and
**P<0.01 (versus Q1)
Significant difference across depression categories was observed for smoking, alcohol use and physical activity by chi-squared test (P<0.01).
significant association between SFA and EDS in men after adjustment for age, denying a role of
subcutaneous fat deposition in the etiology of depression. The result is compatible with a
weaker association of SFA than VFA with markers of inflammation and insulin resistance
[
29
,
30
], which are thought to be potential mechanisms underlying the relationship between
depression and obesity.
The association between depression and insulin resistance has been inconsistent, with some
studies showing a positive association [
31
,
32
] while others reporting no association [
33
,
34
]. In
the present study, odds of high fasting insulin and high HOMA-IR increased by nearly 30% in
the highest group of depression score in participants. The finding among participants agrees
with those of a meta-analysis [
24
], reporting a small but significant overall association between
depression and insulin resistance.
Several mechanisms whereby depression induces obesity and impaired glucose metabolism
have been suggested. Depression is associated with disruption of HPA-axis, which increases
blood concentrations of cortisol, leading to insulin resistance [
9
]. Cortisol and insulin stimulate
lipid uptake by activating lipoprotein lipase, and this process is facilitated by high
concentra-tions of cortisol-activate enzyme 11-β-hydroxysteroid dehydrogenase type 1 and glucocorticoid
Table 3. Mean value of age and depression score in each quartile of obesity indices/markers of insulin resistance.Quartile of obesity indices/markers of insulin resistance
Q1 Q2 Q3 Q4
Body mass index (kg/m2) <22.2 22.2–23.9 24–25.7 25.8
No. of participants 1,111 1,104 1,035 1,083
Age (years) 49.5±8.5 49.7±8.0 49.9±7.9 48.1±8.0**
Depression score 19.6±5.8 19.9±5.9 19.8±6.0 20.2±6.4
Visceral fat area (cm2) <85 85–119 120–154 155
No. of participants 1,093 1,095 1,067 1,078
Age (years) 47.7±8.9 48.8±8.3* 49.9±7.5** 50.8±7.5**
Depression score 20.0±6.2 19.9±6.1 19.8±6.1 19.8±5.8
Subcutaneous fat area (cm2) <97 97–127 128–164 165
No. of participants 1,086 1,084 1,081 1,082
Age (years) 50.1±8.4 50.1±8.1 49.9±7.3 47.0±7.7**
Depression score 19.4±5.9 19.5±5.7 19.9±5.8 20.7±6.6**
Fasting plasma glucose (mg/dL) <96 96–100 101–107 108
No. of participants 1,185 1,019 1,107 1,022
Age (years) 47.6±8.6 48.7±8.3** 49.4±7.7** 51.5±7.3**
Depression score 20.2±6.1 20.0±6.1 19.7±6.0 19.6±6.0
Fasting insulin (μU/mL) <3.7 3.7–5.2 5.3–7.6 7.7
No. of participants 1,134 1,069 1,069 1,061
Age (years) 51.0±8.1 49.6±8.1** 48.7±8.1** 47.7±8.0**
Depression score 19.0±5.4 19.8±6.1** 20.0±6.3** 20.6±6.2**
HOMA-IR <0.87 0.87–1.29 1.30–1.96 1.97
No. of participants 1,081 1,086 1,090 1,076
Age (years) 50.9±8.1 49.3±8.2** 48.5±8.1** 48.3±7.8**
Depression score 19.1±5.5 19.8±6.0* 20.2±6.2** 20.5±6.3**
HOMA-IR: homeostasis model assessment of insulin resistance, Data are means±standard deviation unless stated otherwise *P<0.05 and
**P<0.01 (versus Q1).
receptors. Visceral fat contains a higher concentration of glucocorticoid receptors and has
greater lipoprotein lipase activity than subcutaneous fat [
35
,
36
]. In addition, chronic stress
causes glucocorticoid receptor resistance that results in a failure to down-regulate response to
inflammation [
37
], which plays an important role in the development of both insulin resistance
[
38
] and obesity [
39
]. Pro-inflammatory cytokines (such as tumor necrosis factor-α
and
inter-leukin-6) have been reported to be increased in depression [
18
,
40
] and have also been
Table 4. Association of elevated depressive symptoms with obesity indices/markers of insulin resistance.Quartile of depression score Pfor trend
Q1 (<16) Q2 (16–19) Q3 (20–23) Q4 (24)
Overweight/Obesity
No. of cases 435 371 298 386
Age-adjusted OR (95%CI) 1 0.99 (0.83–1.19) 0.95 (0.79–1.13) 0.92 (0.77–1.12) >0.2
ORa(95%CI) 1 0.95 (0.80–1.12) 0.93 (0.77–1.11) 1.00 (0.84–1.19) >0.2
High VFA
No. of cases 308 285 227 258
Age-adjusted OR (95%CI) 1 1.18 (0.98–1.43) 1.26 (1.03–1.54) 1.25 (1.02–1.52) 0.02
ORa(95%CI) 1 1.18 (0.97–1.42) 1.25 (1.02–1.54) 1.23 (1.01–1.51) 0.03
ORb(95%CI) 1 1.34 (1.08
–1.67) 1.39 (1.10–1.76) 1.26 (1.00–1.60) 0.04
ORc(95%CI) 1 1.21 (0.99
–1.49) 1.24 (0.99–1.55) 1.16 (0.93–1.44) 0.17
High SFA
No. of cases 280 257 237 308
Age-adjusted OR (95%CI) 1 0.98 (0.81–1.20) 1.10 (0.90–1.35) 1.12 (0.92–1.36) 0.18
ORa(95%CI) 1 0.97 (0.80
–1.19) 1.09 (0.89–1.34) 1.10 (0.90–1.34) >0.2
ORb(95%CI) 1 1.16 (0.90–1.51) 1.23 (0.93–1.62) 1.16 (0.89–1.51) >0.2
ORd(95%CI) 1 0.91 (0.73–1.14) 0.96 (0.76–1.21) 1.01 (0.81–1.26) >0.2
High fasting glucose
No. of cases 271 232 153 192
Age-adjusted OR (95%CI) 1 1.10 (0.90–1.35) 0.96 (0.76–1.20) 1.12 (0.90–1.40) >0.2
ORa(95%CI) 1 1.11 (0.91–1.41) 0.96 (0.76–1.20) 1.13 (0.91–1.41) >0.2
ORb(95%CI) 1 1.15 (0.93
–1.41) 0.96 (0.76–1.21) 1.12 (0.89–1.40) >0.2 High fasting insulin
No. of cases 275 245 227 314
Age-adjusted OR (95%CI) 1 0.98 (0.80–1.19) 1.13 (0.92–1.38) 1.28 (1.06–1.56) <0.01
ORa(95%CI) 1 0.98 (0.80
–1.19) 1.12 (0.91–1.38) 1.29 (1.06–1.57) <0.01
ORb(95%CI) 1 1.06 (0.85
–1.32) 1.16 (0.92–1.47) 1.33 (1.07–1.67) <0.01 High HOMA-IR
No. of cases 294 263 213 306
Age-adjusted OR (95%CI) 1 1.01 (0.83–1.22) 1.00 (0.82–1.21) 1.27 (1.03–1.55) 0.05
ORa(95%CI) 1 1.00 (0.83
–1.23) 0.99 (0.81–1.21) 1.26 (1.02–1.54) 0.06
ORb(95%CI) 1 1.09 (0.88–1.35) 0.99 (0.79–1.23) 1.28 (1.02–1.62) 0.11
VFA: visceral fat area, SFA: subcutaneous fat area, HOMA-IR: homeostasis model assessment of insulin resistance ORa: (model 1) Adjusted for age, smoking, alcohol drinking, and physical activity
ORb: (model 2) Adjusted for age, smoking, alcohol drinking, physical activity and body mass index ORc: (model 3) Adjusted for age, smoking, alcohol drinking, physical activity and subcutaneous fat area ORd: (model 4) Adjusted for age, smoking, alcohol drinking, physical activity and visceral fat area
Definition (cutoff) of‘High’group (outcome): overweight/obesity25 kg/m2, fasting plasma glucose110 mg/dL highest one-fourth for VFA (155 cm2), SFA (165cm2), fasting insulin (7.7
μU/mL) and HOMA-IR (1.97).
implicated in the development of insulin resistance [
38
]. Depression could deteriorate lifestyle
behaviors including physical activity, dietary habit and sleep rhythm [
12
]. Similar mechanisms
in the opposite direction have also been suggested. Obesity may induce inflammation [
41
] and
HPA-axis dysregulation [
42
]. Obesity increases risk of insulin resistance and diabetes, which
induces cerebral microvascular damage and increase the risk of depression [
43
,
44
].
The present study has some limitations. First, the depression score was not assessed based
on a validated questionnaire. However, questions used in the calculation of the present
depres-sion score were similar to those of standard questionnaires and the present score is well
corre-lated with SDS score. Second, this study is cross-sectional and thus cannot provide data for
causal inference. Third, we did not adjust for potentially important variables including diet,
which may confound the association. Finally, the study participants were employees of a
large-scale company. Caution should be exercised in the application of the present results to a
popu-lation with a different background.
Conclusion
EDS was associated with VFA and markers of insulin resistance in middle-aged Japanese men.
Longitudinal studies are required to confirm the present cross-sectional finding and to
estab-lish temporality of these relationships.
Acknowledgments
The authors thank the participants as well as the clinical and imaging staff at all of the
investi-gator sites.
Author Contributions
Conceived and designed the experiments: SY TM. Analyzed the data: SY TN. Contributed
reagents/materials/analysis tools: YM T. Hayashi. Wrote the paper: SY TM. Reviewed and
edited the manuscript: YM MN T. Honda T. Hayashi.
References
1. Lustman PJ, Anderson RJ, Freedland KE, de Groot M, Carney RM, Clouse RE. Depression and poor glycemic control: a meta-analytic review of the literature. Diabetes Care 2000; 23: 934–942. PMID:
10895843
2. Anderson RJ, Freedland KE, Clouse RE, Lustman PJ. The prevalence of comorbid depression in adults with diabetes: a meta-analysis. Diabetes Care 2001; 24: 1069–1078. PMID:11375373
3. Talbot F, Nouwen A. A review of the relationship between depression and diabetes in adults: is there a link? Diabetes Care 2000; 23: 1556–1562. PMID:11023152
4. Kivimäki M, Lawlor DA, Singh-Manoux A, Batty GD, Ferrie JE, Shipley MJ, et al. Common mental disor-der and obesity: insight from four repeat measures over 19 years: prospective Whitehall II cohort study. BMJ 2009; 339: b3765. doi:10.1136/bmj.b3765PMID:19808765
5. Luppino FS, de Wit LM, Bouvy PF, Stijnen T, Cuijpers P, Penninx BW, et al. Overweight, obesity, and depression: a systematic review and meta-analysis of longitudinal studies. Arch Gen Psychiatry 2010; 67: 220–229. doi:10.1001/archgenpsychiatry.2010.2PMID:20194822
6. Golden SH, Lazo M, Carnethon M, Bertoni AG, Schreiner PJ, Diez Roux AV, et al. Examining a bidirec-tional association between depressive symptoms and diabetes. JAMA 2008; 299: 2751–2759. doi:10. 1001/jama.299.23.2751PMID:18560002
7. de Groot M, Anderson R, Freedland KE, Clouse RE, Lustman PJ. Association of depression and diabe-tes complications: a meta-analysis. Psychosom Med 2001; 63: 619–630. PMID:11485116
8. Katon WJ, Rutter C, Simon G, Lin EH, Ludman E, Ciechanowski P, et al. The association of comorbid depression with mortality in patients with type 2 diabetes. Diabetes Care 2005; 28: 2668–2672. PMID:
9. Yokoyama K, Yamada T, Mitani H, Yamada S, Pu S, Yamanashi T, et al. Relationship between hypo-thalamic-pituitary-adrenal axis dysregulation and insulin resistance in elderly patients with depression. Psychiatry Res 2015; 226: 494–498. doi:10.1016/j.psychres.2015.01.026PMID:25757913
10. Miller GE, Stetler CA, Carney RM, Freedland KE, Banks WA. Clinical depression and inflammatory risk markers for coronary heart disease. Am J Cardiol 2002; 90: 1279–1283. PMID:12480034
11. DiMatteo MR, Lepper HS, Croghan TW. Depression is a risk factor for noncompliance with medical treatment: meta-analysis of the effects of anxiety and depression on patient adherence. Arch Intern Med 2000; 160: 2101–2107. PMID:10904452
12. Lovell GP, Nash K, Sharman R, Lane BR. A cross-sectional investigation of depressive, anxiety, and stress symptoms and health-behavior participation in Australian university students. Nurs Health Sci 2015; 17: 134–142.
13. Masand PS, Gupta S. Long-term side effects of newer-generation antidepressants: SSRIS, venlafax-ine, nefazodone, bupropion, and mirtazapine. Ann Clin Psychiatry 2002; 14: 175–182. PMID:
12585567
14. Herva A, Laitinen J, Miettunen J, Veijola J, Karvonen JT, Läksy K, et al. Obesity and depression: results from the longitudinal Northern Finland 1966 Birth Cohort Study. Int J Obes 2006; 30: 520–527. 15. Zhao G, Ford ES, Li C, Tsai J, Dhingra S, Balluz LS. Waist circumference, abdominal obesity, and
depression among overweight and obese U.S. adults: National Health and Nutrition Examination Sur-vey 2005–2006. BMC Psychiatry 2011; 11: 130. doi:10.1186/1471-244X-11-130PMID:21834955
16. Rivenes AC, Harvey SB, Mykletun A. The relationship between abdominal fat, obesity, and common mental disorders: results from the HUNT study. J Psychosom Res 2009; 66: 269–275. doi:10.1016/j. jpsychores.2008.07.012PMID:19302883
17. Thakore JH, Richards PJ, Reznek RH, Martin A, Dinan TG. Increased intra-abdominal fat deposition in patients with major depressive illness as measured by computed tomography. Biol Psychiatry 1997; 41: 1140–1142. PMID:9146826
18. Kahl KG, Bester M, Greggersen W, Rudolf S, Dibbelt L, Stoeckelhuber BM, et al. Visceral fat deposition and insulin sensitivity in depressed women with and without comorbid borderline personality disorder. Psychosom Med 2005; 67: 407–412. PMID:15911903
19. Everson-Rose SA, Lewis TT, Karavolos K, Dugan SA, Wesley D, Powell LH. Depressive symptoms and increased visceral fat in middle-aged women. Psychosom Med 2009; 71: 410–416. doi:10.1097/ PSY.0b013e3181a20c9cPMID:19398501
20. Murabito JM, Massaro JM, Clifford B, Hoffmann U, Fox CS. Depressive symptoms are associated with visceral adiposity in a community-based sample of middle-aged women and men. Obesity (Silver Spring) 2013; 21: 1713–1719.
21. Vogelzangs N, Kritchevsky SB, Beekman AT, Brenes GA, Newman AB, Satterfield S, et al. Obesity and onset of significant depressive symptoms: results from a prospective community-based cohort study of older men and women. J Clin Psychiatry 2010; 71: 391–399. doi:10.4088/JCP.08m04743blu
PMID:20021992
22. Remigio-Baker RA, Allison MA, Schreiner PJ, Szklo M, Crum RM, Leoutsakos JM, et al. Difference by sex but not by race/ethnicity in the visceral adipose tissue-depressive symptoms association: the Multi-Ethnic Study of Atherosclerosis. Psychoneuroendocrinology 2014; 47: 78–87. doi:10.1016/j.
psyneuen.2014.05.004PMID:25001957
23. Kadowaki T, Sekikawa A, Murata K, Maegawa H, Takamiya T, Okamura T, et al. Japanese men have larger areas of visceral adipose tissue than Caucasian men in the same levels of waist circumference in a population-based study. Int J Obes (Lond) 2006; 30: 1163–1165
24. Kan C, Silva N, Golden SH, Rajala U, Timonen M, Stahl D, et al. A systematic review and meta-analysis of the association between depression and insulin resistance. Diabetes Care 2013; 36: 480–489. doi:
10.2337/dc12-1442PMID:23349152
25. Matsushita Y, Nakagawa T, Yamamoto S, Takahashi Y, Yokoyama T, Noda M, et al. Associations of visceral and subcutaneous fat areas with the prevalence of metabolic risk factor clustering in 6,292 Jap-anese individuals: the Hitachi Health Study. Diabetes Care 2010; 33: 2117–2119. doi: 10.2337/dc10-0120PMID:20460443
26. Yamamoto S, Matsushita Y, Nakagawa T, Hayashi T, Noda M, Mizoue T. Circulating adiponectin levels and risk of type 2 diabetes in the Japanese. Nutr Diabetes 2014; 4: e130. doi:10.1038/nutd.2014.27
PMID:25133442
28. Seino Y, Nanjo K, Tajima N, Kadowaki T, Kashiwagi A, Araki E et al. Report of the Committee on the classification and diagnostic criteria of diabetes mellitus. J Diabetes Investig 2010; 1: 212–228. doi:10. 1111/j.2040-1124.2010.00074.xPMID:24843435
29. Hsieh CJ, Wang PW, Chen TY. The relationship between regional abdominal fat distribution and both insulin resistance and subclinical chronic inflammation in non-diabetic adults. Diabetol Metab Syndr 2014; 6: 49. doi:10.1186/1758-5996-6-49PMID:24684833
30. Preis SR, Massaro JM, Robins SJ, Hoffmann U, Vasan RS, Irlbeck T, et al. Abdominal subcutaneous and visceral adipose tissue and insulin resistance in the Framingham heart study. Obesity (Silver Spring) 2010; 18: 2191–2198.
31. Pearson S, Schmidt M, Patton G, Dwyer T, Blizzard L, Otahal P, et al. Depression and insulin resis-tance: cross-sectional associations in young adults. Diabetes Care 2010; 33: 1128–1133. doi:10.2337/ dc09-1940PMID:20185745
32. Pyykkönen AJ, Räikkönen K, Tuomi T, Eriksson JG, Groop L, Isomaa B. Depressive symptoms, antide-pressant medication use, and insulin resistance: the PPP-Botnia Study. Diabetes Care 2011; 34: 2545–2547. doi:10.2337/dc11-0107PMID:21953801
33. Lawlor DA, Ben-Shlomo Y, Ebrahim S, Davey Smith G, Stansfeld SA, Yarnell JW, et al. Insulin resis-tance and depressive symptoms in middle aged men: findings from the Caerphilly prospective cohort study. BMJ 2005; 330: 705–706. PMID:15684022
34. Roos C, Lidfeldt J, Agardh CD, Nyberg P, Nerbrand C, Samsioe G, et al. Insulin resistance and self-rated symptoms of depression in Swedish women with risk factors for diabetes: the Women's Health in the Lund Area study. Metabolism 2007; 56: 825–829. PMID:17512316
35. Rebuffé-Scrive M, Brönnegard M, Nilsson A, Eldh J, Gustafsson JA, Björntorp P. Steroid hormone receptors in human adipose tissues. J Clin Endocrinol Metab 1990; 71: 1215–1219. PMID:2229280
36. Pedersen SB, Jønler M, Richelsen B. Characterization of regional and gender differences in glucocorti-coid receptors and lipoprotein lipase activity in human adipose tissue. J Clin Endocrinol Metab 1994; 78: 1354–1359. PMID:8200937
37. Cohen S, Janicki-Deverts D, Doyle WJ, Miller GE, Frank E, Rabin BS, et al. Chronic stress, glucocorti-coid receptor resistance, inflammation, and disease risk. Proc Natl Acad Sci USA 2012; 109: 5995–
5999. doi:10.1073/pnas.1118355109PMID:22474371
38. Shoelson SE, Lee J, Goldfine AB. Inflammation and insulin resistance. J Clin Invest 2006; 116:1793–
1801. PMID:16823477
39. Engström G, Hedblad B, Stavenow L, Lind P, Janzon L, Lindgärde F. Inflammation-sensitive plasma proteins are associated with future weight gain. Diabetes 2003; 52: 2097–2101. PMID:12882928
40. Dowlati Y, Herrmann N, Swardfager W, Liu H, Sham L, Reim EK, et al. A meta-analysis of cytokines in major depression. Biol Psychiatry 2010; 67: 446–457. doi:10.1016/j.biopsych.2009.09.033PMID:
20015486
41. Shoelson SE, Herrero L, Naaz A. Obesity, inflammation, and insulin resistance. Gastroenterology 2007; 132: 2169–2180. PMID:17498510
42. Walker BR. Activation of the hypothalamic-pituitary-adrenal axis in obesity: cause or consequence? Growth Horm IGF Res 2001; 11 Suppl A: S91–95. PMID:11527096
43. Huber JD. Diabetes, cognitive function, and blood-brain barrier. Curr Pharm Des 2008; 14: 1594–1600. PMID:18673200