Genetic Chicken Lines That Differ in Their Susceptibility
to
Campylobacter jejuni
Colonization
Xianyao Li1., Christina L. Swaggerty2., Michael H. Kogut2
*, Hsin-I Chiang1, Ying Wang1, Kenneth J. Genovese2, Haiqi He2, Huaijun Zhou1*
1Department of Poultry Science, Texas A&M University, College Station, Texas, United States of America,2Southern Plains Agricultural Research Center, United States Department of Agriculture, Agricultural Research Service, College Station, Texas, United States of America
Abstract
Campylobacter jejuni(C. jejuni) is one of the most common causes of human bacterial enteritis worldwide primarily due to contaminated poultry products. Previously, we found a significant difference inC. jejunicolonization in the ceca between two genetically distinct broiler lines (Line A (resistant) has less colony than line B (susceptible) on day 7 post inoculation). We hypothesize that different mechanisms between these two genetic lines may affect their ability to resist C. jejuni
colonization in chickens. The molecular mechanisms of the local host response toC. jejunicolonization in chickens have not been well understood. In the present study, to profile the cecal gene expression in the response toC. jejunicolonization and to compare differences between two lines at the molecular level, RNA of ceca from two genetic lines of chickens (A and B) were applied to a chicken whole genome microarray for a pair-comparison between inoculated (I) and non-inoculated (N) chickens within each line and between lines. Our results demonstrated that metabolism process and insulin receptor signaling pathways are key contributors to the different response toC. jejunicolonization between lines A and B. WithC. jejuniinoculation, lymphocyte activation and lymphoid organ development functions are important for line A host defenses, while cell differentiation, communication and signaling pathways are important for line B. Interestingly, circadian rhythm appears play a critical role in host response of the more resistant A line toC. jejunicolonization. A dramatic differential host response was observed between these two lines of chickens. The more susceptible line B chickens responded toC. jejuni
inoculation with a dramatic up-regulation in lipid, glucose, and amino acid metabolism, which is undoubtedly for use in the response to the colonization with little or no change in immune host defenses. However, in more resistant line A birds the host defense responses were characterized by an up-regulation lymphocyte activation, probably by regulatory T cells and an increased expression of the NLR recognition receptor NALP1. To our knowledge, this is the first time each of these responses has been observed in the avian response to an intestinal bacterial pathogen.
Citation:Li X, Swaggerty CL, Kogut MH, Chiang H-I, Wang Y, et al. (2010) Gene Expression Profiling of the Local Cecal Response of Genetic Chicken Lines That Differ in Their Susceptibility toCampylobacter jejuniColonization. PLoS ONE 5(7): e11827. doi:10.1371/journal.pone.0011827
Editor:Rodolfo Aramayo, Texas A&M University, United States of America
ReceivedNovember 12, 2009;AcceptedJuly 5, 2010;PublishedJuly 28, 2010
This is an open-access article distributed under the terms of the Creative Commons Public Domain declaration which stipulates that, once placed in the public domain, this work may be freely reproduced, distributed, transmitted, modified, built upon, or otherwise used by anyone for any lawful purpose.
Funding:This project was supported by National Research Initiative Grant no. 2007-35604-17903 from the United States Department of Agriculture (USDA) Cooperative State Research, Education, and Extension Service Animal Genome program. The funders had no role in study design, data collection and analysis, decision to publish, or preparation of the manuscript.
Competing Interests:The authors have declared that no competing interests exist.
* E-mail: [email protected] (MHK); [email protected] (HZ)
.These authors contributed equally to this work.
Introduction
Campylobacter jejuni (C. jejuni) is one of the main food-borne bacterial pathogens of humans in developed countries [1]. Chickens are a major reservoir of C. jejuni with contaminated under-cooked or raw chicken as one of the main sources of human Campylobacterinfections [1]. In the U.S., the cost of campylobac-teriosis is estimated to be $1.5–8.0 billion annually. Reducing Campylobactercontamination in food could save up to$5.6 billion annually [2,3].
The ability of C. jejuni to colonize in chickens has been well documented and the cecum is the primary site of colonization [4]. Studies show that the host genetic background plays an impor-tant role in the response to C. jejuniinfection [5,6,7]. We have previously shown different numbers ofC. jejuniin cecal content at
day 7 post-inoculation (pi) between two broiler lines (lines A vs. line B) where line A is more resistant to cecal colonization byC. jejuni compared to line B [7]. Understanding molecular mecha-nisms contributing to resistance toC. jejuni colonization will be essential for the improvement of genetic resistance to C. jejuni colonization in the chicken. Therefore, cecum including cecal tonsil (one of major lymphoid tissues interacting withC. jejuni) at day 7 pi were collected to elucidate underlining mechanisms affecting resistance and the local host response to C. jejuni colonization.
at a given point in time under uniform experimental condition [12] as was previously carried out in the response toSalmonella infection in chickens [13,14,15,16]. The available chicken genomic sequence [17] provides an opportunity to study the large-scale gene expression profiling of chickens in the response to C. jejuni inoculation. We report here the use of a chicken-specific 44K Agilent microarray [18] to profile host gene expression transcription of ceca between two lines of chickens and characterize their host response followingC. jejuni inoculation.
Therefore, the objectives of the present study were twofold: (1) to evaluate the differences in gene expressionbetweenthese two lines of chickens that differ in their resistance to C. jejuni cecal colonization, and (2) to identify differentially expressed genes withinlines followingC. jejuniinoculation when compared to the non-inoculated controls.
Results
1. Identification of differentially expressed genesbetween lines
The number ofC. jejunicolonization in cecal content at day 7 pi in line A (1.39 log10 cfu (colony-forming unit)) is significantly lower than that in line B (3.50 log10 cfu) [7]. To compare genetic difference between these two lines, the significantly expressed genes between line A and line B in both inoculated and non-inoculated chickens were identified (Fig. 1A).
A. Comparison of gene profile of ceca between lines of non-inoculated birds. Initially, we compared the gene expression profile of the ceca of lines A and B of non- inoculated controls (AN vs. BN), and found 1,779 genes significantly expressed between line A and line B with a false discovery rate (FDR) of 0.577 (Fig. 1A). Of the 1,779 genes, 505 genes were more highly expressed in line A than line B and 1,274 were more highly expressed in line B than line A. Of the more highly expressed genes in line B, 774 had a fold-change .2, and 30 genes had a fold-change.10. The highest fold-change (152) was observed for the dopey family member 1 (DOPEY1, CR353647) gene. Among the genes higher expressed in line A, 368 had a fold-change.2 and 7 genes had a fold-change.10. The highest fold-change (134) was observed for the NDC80 kinetochore complex component, homolog (S. cerevisiae) (NUF2, AJ720907) gene (Table S1).
B. Comparison of gene profile of ceca between lines of C. jejuni inoculated birds. Following inoculation with C. jejuni, we compared the changes in the gene expression profile of the ceca of lines A and B. The results showed that 1,619 genes were differentially expressed with a FDR of 0.288, and 1,174 had higher expression in line B than line A. Among those genes, 640 had a fold-change .2, and 25 genes had a fold-change .10. As observed in the AN/BN comparison, the highest fold-change (128) was the DOPEY1 gene (CR353647). Of the genes that had higher expression in line A, 311 had fold-change .2 and 7 genes had fold-change .10. The highest fold-change was found for the BX265589 (a chicken EST) (Table S2). Greater than 50% of those differentially expressed genes were shared between the AN/BN and AI/BI comparisons (Fig. 2A).
2. Identification of differentially expressed genes between inoculated and non-inoculated birds within lines
A. Within line A. The comparison of inoculated vs. non-inoculated chickens within line A (AI/AN) showed 690 genes significantly expressed with a FDR of 0.174. Of 690 genes, 392
were down-regulated and 298 were up-regulated (Fig. 1B). The highest fold-change (4.0) was observed for the AJ741056 (a chicken EST). Among the down-regulated genes, 46 had a fold-change .2. In the up-regulated genes, 34 had a fold-change .2 (Table S3).
B. Within line B. In the comparison of inoculated vs. non-inoculated chickens within line B (BI/BN), 1,384 genes were differentially expressed with a FDR of 0.182. More genes were Figure 1. Number of significantly differentially expressed genes between comparisons. A: Number of genes with higher expression in one line (A or B) than the other line (B or A) when comparing between lines A and B. White bar represents number of genes with higher expression in line A than line B; Black bar represents number of genes with higher expression in line B than line A. B: Number of up and down-regulated genes followingC. jejuniinoculation within each line (A or B) when comparing inoculated with non-inoculated control chickens. White bar represents number of up-regulated genes; Black bar represents number of down-regulated genes.
up-regulated (962) than down-regulated (422) (Fig. 1B). Of down regulated genes, 62 had a fold-change.2 with the highest fold-change (5.34) found for the CR339022 (a chicken EST). Among up-regulated genes, 82 had a fold-change .2 with the highest fold-change (3.93) observed for the TC225367 (a chicken EST) (Table S4).
To compare differentially expressed genes of inoculated vs. non-inoculated between A line and B line, there were 67 genes shared (28 up-regulated and 36 down-regulated genes with consistent expression direction and three genes with opposite expression direction) (Fig. 2B, Table S5).
There were five genes overlapped in all four comparisons (AN/ BN, AI/BI, AI/AN, BI/BN). They were SOCS3 (AF424806), IL-1b (Y15006), and K60 (Y14971), and the other two were non-annotated chicken ESTs.
3. Gene functional analysis
Functional category enrichment based on the gene ontology (GO) was evaluated on the differentially expressed genes between two different lines and between inoculated and non-inoculated within lines (up- and down-regulated) by Database for Annotation, Visualization and Integrated Discovery (DAVID) 2008 [19]. Three categories are included in GO: biological process (BP),
molecular function (MF), and cellular component (CC). Each of these categories are assigned independently [20]. Due to significant relevance of BP, only functional clusters belonging to this category are presented in the current study.
A. Functional analysis of genetic difference between lines. Comparisons of non-inoculated birds between lines: In the comparison of AN/BN, for the genes with higher expression in line B, four enriched GO terms were observed. These included amino acid metabolic process, insulin receptor signaling pathway, nitrogen compound metabolic process and regulation of insulin receptor signal signaling pathway with fold enrichments of 3.0, 35.7, 2.7, and 47.6, respectively. For the genes with higher expression in line A, one enriched GO term, heart development, was significantly enriched with fold enrichment of 11.7 (Figure 3A). Comparisons of inoculated birds between lines: Although fewer differentially expressed genes were observed in the comparison of AI/BI, more enriched GO terms were obtained (Figure 3B). All significantly enriched GO terms were from genes higher expressed in line B. The enriched GO terms could be roughly grouped into two clusters. The first cluster is comprised of cellular processes and their regulation (biopolymer modification, hormone biosynthetic process, macromolecule metabolic process, protein modification process, regulation of cellular metabolic process, and RNA biosynthetic process). The second cluster centers on signaling pathways including enzyme linked receptor protein signaling pathway, insulin receptor signaling pathway, regulation of insulin receptor signaling pathway, and transmembrane receptor protein tyrosine kinase signaling pathway. Higher fold enrichment (.10) was detected in hormone biosynthetic process, insulin receptor signaling pathway and regulation of insulin receptor signal signaling pathway (12.6, 44.3, and 59.0, respectively).
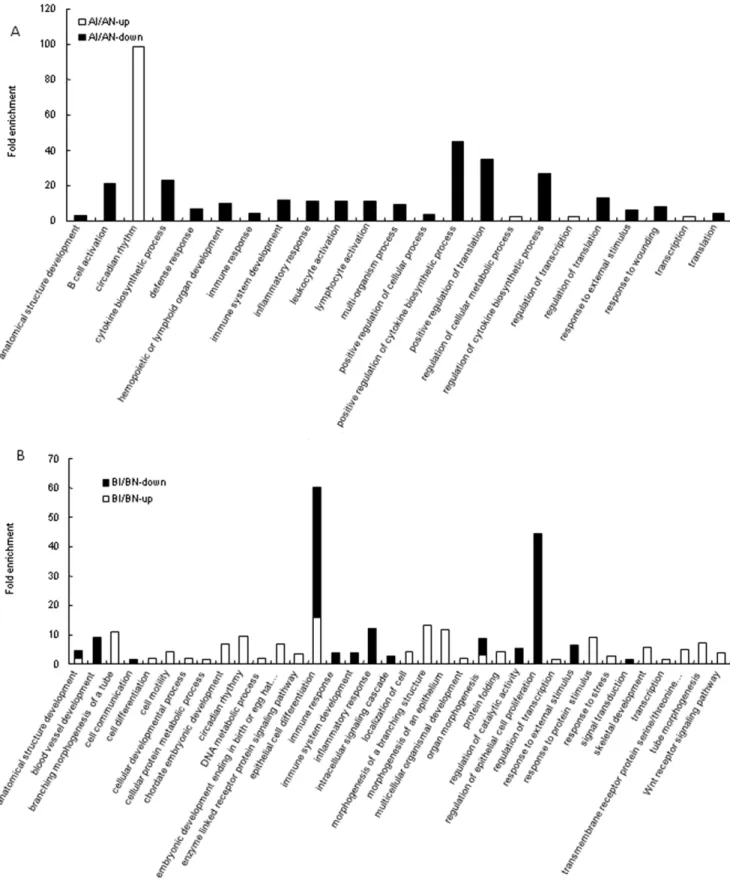
B. Functional analysis associated with C. jejuni colonization within lines. For the comparison of AI/AN, more enriched GO terms were found in the down-regulated genes than up-regulated ones (Figure 4A). Nineteen enriched GO terms were from down-regulated genes. A majority of these enriched GO terms play a role in the immune system, and include B cell activation, cytokine biosynthetic process, defense response, hemopoietic or lymphoid organ development, immune response, immune system development, inflammatory response, leukocyte activation, lymphocyte activation, positive regulation of cytokine biosynthetic process, regulation of cytokine biosynthetic process, response to external stimulus, and response to wounding. The remaining enriched GO terms were comprised of development and metabolic related process such as anatomical structure development, multi-organism process, and regulation of cellular metabolic process. For the up-regulated genes, only circadian rhythm was significantly enriched.
For line B comparison (BI/BN), more enriched GO terms were found in the up-regulated genes following C. jejuni inoculation (Figure 4B). These functional terms could be roughly grouped into five clusters: (1) development and morphogenesis including anatomical structure development, branching morphogenesis of a tube, cell differentiation, cellular developmental process, chordate embryonic development, embryonic development ending in birth or egg hatching, epithelial cell differentiation, morpho-genesis of a branching structure, morphomorpho-genesis of an epithelium, multicellular organismal development, organ morphogenesis, skeletal development, and tube morphogenesis; (2) immune response to protein stimulus and response to stress; (3) cell communication and cell motility; (4) protein and DNA metabolic process; and (5) signaling pathways such as enzyme linked receptor protein signaling pathway and Wnt receptor signaling pathway. Enriched functional terms found in the down-regulated genes Figure 2. Venn diagram showing the number of differentially
included immune response, immune system development, inflam-matory response, response to external stimulus, cell communica-tion, and signal transduction.
4. Immune-related genes
Immune-related genes are biologically important for the host response to antigens. Based on our knowledge and information available, 426 postulated immune-related genes [21,22,23] and gene products were identified in the 44K chicken Agilent array used in the current study.
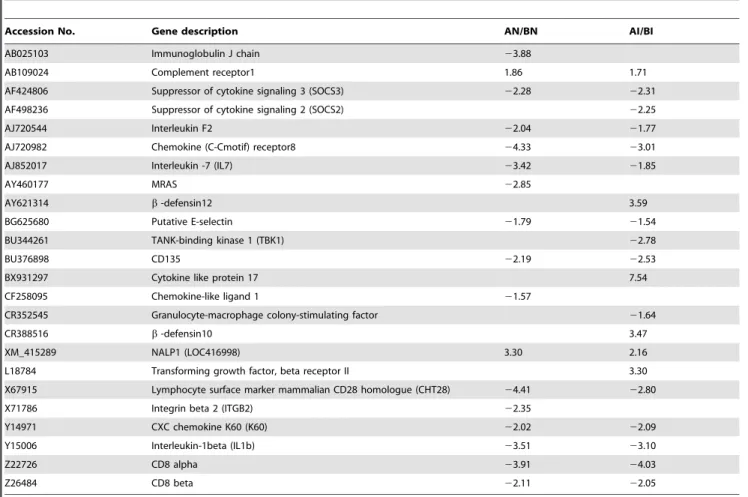
A. Significantly expressed immune-related genes between genetic lines. Due to differences in resistance to C. jejuni colonization between lines A and B, it is expected that some immune-related genes would be differentially expressed between the two lines. The results showed 17 immune-related genes were significantly expressed in the comparison of AN/BN with fold-change ranging from 1.57 (chemokine-like ligand 1, CF258095) to 4.41 (CHT28, X67915) (Table 1). The majority of immune-related genes had higher expression in BN than AN. Only two immune response genes (complement receptor 1, AB109024 and NALP1, XM_415289) had a significantly greater fold change in expression in AN than BN (Table 1).
In the comparison of AI/BI, 20 immune-related genes were significantly expressed with the fold-changes ranging from 1.54 (putative E-selectin, BG625680) to 7.54 (cytokine like protein 17, BX931297) (Table 1). The majority of those immune-related genes (14 out of 20) had higher expression levels in BI than AI. There were 13 immune-related genes shared between AN/BN and AI/BI with the same direction of the regulation (up- or down-regulated).
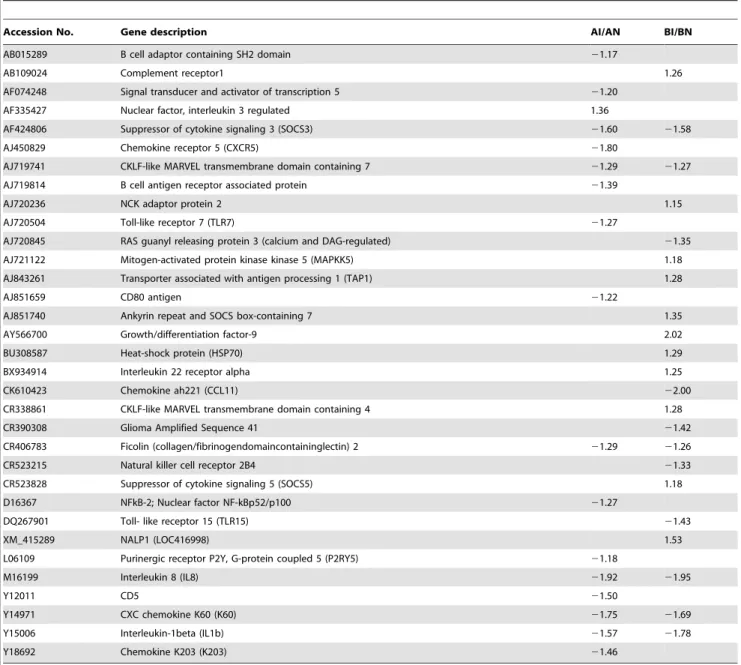
B. Significantly expressed immune-related genes between inoculated and non-inoculated birds within lines. A list of immune-related genes responding toC. jejunicolonization is shown in Table 2. For the comparison of AI/AN, 17 genes were differentially down-regulated. The highest fold-change (1.92) was observed for IL8 (M16199) while one of the toll-like receptors, TLR7 (AJ720504), was differentially expressed with a fold-change of 1.27. Interleukin 3 (IL3) regulated nuclear factor (AF335427) was the only up-regulated gene with a fold-change of 1.36.
For the comparison of BI/BN, 22 genes were differentially expressed with 11 of the immune-related genes up-regulated followingC. jejuniinoculation including Mitogen-activated protein kinase kinase 5 (MAPKK5, AJ721122), Heat-shock protein (HSP70, BU308587), Interleukin 22 receptor alpha (BX934914), and Suppressor of cytokine signaling 5 (SOCS5, CR523528).
5. Validation of gene expression from microarray analysis by quantitative real-time PCR
Quantitative real-time PCR (qRT-PCR) was performed to validate the microarray data and the same RNA samples were used. Ten differentially expressed genes associated with the immune response and circadian rhythm functional terms were selected for the validation by qRT-PCR (The primer sequences were listed in Table S6). The results showed that nine of ten genes selected for validation were consistent with the results obtained from the microarray in terms of significance and direction of the regulation. The STAT5B showed up-regulation in both micro-array and qRT-PCR results, but not statistical significance in qRT-PCR result. Due to the increased sensitivity of qRT-PCR Figure 3. Enriched BP GO terms for significantly expressed genesbetweengenetic lines.A: Enriched GO terms in the comparison of AN/ BN. Note: regulation of insulin receptor signal… represents regulation of insulin receptor signaling pathway. B: Enriched GO terms in the comparison of AI/BI. Note: transmembrane receptor protein tyrosine kinase signalin…represents transmembrane receptor protein tyrosine kinase signaling pathway.
Figure 4. Enriched BP GO terms for significantly expressed genes between inoculated and non-inoculated birdswithinlines.A: Enriched BP GO terms in the comparison of AI/AN. B: Enriched BP GO terms in the comparison of BI/BN. Note: embryonic development ending in birth or egg hat… represents embryonic development ending in birth or egg hatch; transmembrane receptor protein serine/threonie… represents transmembrane receptor protein serine/threonine kinase signaling pathway.
compared to the microarray, the fold-change in the qRT-PCR results were higher than that observed from the microarray analysis (Table 3).
Discussion
In the present study, a genome-wide gene expression profile of host response to C. jejuni inoculation in the ceca from two genetically different broiler lines were studied using a chicken DNA microarray. Expression profiling in the comparison between two genetic lines and their response toC. jejuniinoculationwithin each line were described in the current study. In general, most differentially expressed genes had low fold-changes following C. jejuniinoculation within each line. This is probably due to the fact thatC. jejuniis a commensal bacterium in the chicken and is not invasive in chicken gut.
1. Genetic differencebetweenlines
Global gene expression profile. Genetic and environmental com-ponents contribute to disease resistance in chickens with differences in susceptibility found in a number of diseases including avian leukosis, infectious bronchitis, infectious bursal disease, Marek’s disease, salmonellosis and coccidiosis [24]. The two broiler lines used in this study have been evaluated inSalmonella,Enterococcusand C. jejunichallenge studies [7,25,26,27] and in all instances chickens from line A were more resistant than line B chickens. Collectively, these studies show that these two genetic lines maintain a similar
resistance pattern in response to different pathogens although they were not selected for resistance to any specific pathogen.
Although more differentially expressed genes were found between line A and line B, fewer GO BP terms were significantly enriched for those differentially expressed genes. Most of these differentially expressed genes result from genetic differences between these two lines. In addition, the genes with higher expression in line B from enriched GO BP were mainly associated with metabolic processes including the insulin receptor signaling pathway. The results from the GO BP suggest that upon inoculation withC. jejuni, line B chickens respond with a dramatic up-regulation in lipid, glucose, and amino acid metabolism undoubtedly for use in the response to the colonization. Chickens devote considerable resources and machinery towards self-maintenance including a network of leukocytes specialized to identify and mitigate challenges to self-maintenance. The consequences of ineffective self-maintenance include diminished productivity and dominance by pathogens [28,29,30]. The costs of development of the host defenses come primarily from the expenditure of energy to fuel the inefficient process of an effective immune response and to provide substrates (e.g., amino acids and lipids) for the production of effector leukocytes that protect the bird from infections [31]. The fact that line B chickens must initiate a rapid metabolic response to counter an colonization confirms our earlier results demonstrating the inefficiency of the innate immune cell functional activities in these birds probably due to directing resources to growth [25,26,32,33,34,35].
Table 1.Fold-change of significantly differentially expressed immune-related genesbetweengenetic lines in the microarray results (P,0.01).
Accession No. Gene description AN/BN AI/BI
AB025103 Immunoglobulin J chain 23.88
AB109024 Complement receptor1 1.86 1.71
AF424806 Suppressor of cytokine signaling 3 (SOCS3) 22.28 22.31
AF498236 Suppressor of cytokine signaling 2 (SOCS2) 22.25
AJ720544 Interleukin F2 22.04 21.77
AJ720982 Chemokine (C-Cmotif) receptor8 24.33 23.01
AJ852017 Interleukin -7 (IL7) 23.42 21.85
AY460177 MRAS 22.85
AY621314 b-defensin12 3.59
BG625680 Putative E-selectin 21.79 21.54
BU344261 TANK-binding kinase 1 (TBK1) 22.78
BU376898 CD135 22.19 22.53
BX931297 Cytokine like protein 17 7.54
CF258095 Chemokine-like ligand 1 21.57
CR352545 Granulocyte-macrophage colony-stimulating factor 21.64
CR388516 b-defensin10 3.47
XM_415289 NALP1 (LOC416998) 3.30 2.16
L18784 Transforming growth factor, beta receptor II 3.30
X67915 Lymphocyte surface marker mammalian CD28 homologue (CHT28) 24.41 22.80
X71786 Integrin beta 2 (ITGB2) 22.35
Y14971 CXC chemokine K60 (K60) 22.02 22.09
Y15006 Interleukin-1beta (IL1b) 23.51 23.10
Z22726 CD8 alpha 23.91 24.03
Z26484 CD8 beta 22.11 22.05
Immune-related gene profile. Although a majority of the differentially expressed genes between the two lines were related to metabolic function, several immune-related genes, such as SOCS2, SOCS3, IL 7, NALP1, andb-defensins 10 and 12 were also differentially expressed (Table 1). Intestinal epithelial cells represent the first line of defense against pathogenic bacteria in the lumen of the intestine. Besides acting as a physical barrier, epithelial cells orchestrate the immune response through the production of several innate immune mediator molecules including b-defensins. Defensins are small peptides composed of cysteine-rich cationic molecules with broad-spectrum antimicro-bial activity against bacteria, fungi and certain enveloped viruses [36]. Fourteen b-defensins have been described in chickens [37,38]. b-defensin 3, 4, 8, 13, and 14 gene expression were shown to be significantly down-regulated during C. jejuni inoculation in chicken cells in vitro [39]; whereas b-defensin 2
and 3 are up-regulated during C. jejuni infection in human intestinal epithelial cells [40]. In contrast to the present findings,b -defensin 10 and 12 gene expression were not affected byC. jejuni inoculation in chicken peripheral blood leukocyte [39]. Here, both b-defensins 10 and 12 gene expression were significantly up-regulated in the ceca of AI birds when compared to the ceca of BI birds. These results denote the importance of the roleb-defensins as part of the local intestinal host response in the resistance of line A birds toC. jejunicolonization when compared to line B birds.
Another interesting finding in the present studies was the up-regulation of the NALP1 gene in the ceca from the line A birds. The NALP1 inflammasome, which was the first nucleotide binding and oligomerization domain (NOD)-like receptor (NLR) family molec-ular platform to be identified, is relatively widely expressed and is composed of NALP1, an adaptor known as apoptosis-associated speck-like protein containing card (ASC), and caspase-1 [41,42].
Table 2.Fold-change of significantly differentially expressed immune-related genes between inoculated and non-inoculated chickenswithinlines in microarray results (P,0.01).
Accession No. Gene description AI/AN BI/BN
AB015289 B cell adaptor containing SH2 domain 21.17
AB109024 Complement receptor1 1.26
AF074248 Signal transducer and activator of transcription 5 21.20
AF335427 Nuclear factor, interleukin 3 regulated 1.36
AF424806 Suppressor of cytokine signaling 3 (SOCS3) 21.60 21.58
AJ450829 Chemokine receptor 5 (CXCR5) 21.80
AJ719741 CKLF-like MARVEL transmembrane domain containing 7 21.29 21.27
AJ719814 B cell antigen receptor associated protein 21.39
AJ720236 NCK adaptor protein 2 1.15
AJ720504 Toll-like receptor 7 (TLR7) 21.27
AJ720845 RAS guanyl releasing protein 3 (calcium and DAG-regulated) 21.35
AJ721122 Mitogen-activated protein kinase kinase 5 (MAPKK5) 1.18
AJ843261 Transporter associated with antigen processing 1 (TAP1) 1.28
AJ851659 CD80 antigen 21.22
AJ851740 Ankyrin repeat and SOCS box-containing 7 1.35
AY566700 Growth/differentiation factor-9 2.02
BU308587 Heat-shock protein (HSP70) 1.29
BX934914 Interleukin 22 receptor alpha 1.25
CK610423 Chemokine ah221 (CCL11) 22.00
CR338861 CKLF-like MARVEL transmembrane domain containing 4 1.28
CR390308 Glioma Amplified Sequence 41 21.42
CR406783 Ficolin (collagen/fibrinogendomaincontaininglectin) 2 21.29 21.26
CR523215 Natural killer cell receptor 2B4 21.33
CR523828 Suppressor of cytokine signaling 5 (SOCS5) 1.18
D16367 NFkB-2; Nuclear factor NF-kBp52/p100 21.27
DQ267901 Toll- like receptor 15 (TLR15) 21.43
XM_415289 NALP1 (LOC416998) 1.53
L06109 Purinergic receptor P2Y, G-protein coupled 5 (P2RY5) 21.18
M16199 Interleukin 8 (IL8) 21.92 21.95
Y12011 CD5 21.50
Y14971 CXC chemokine K60 (K60) 21.75 21.69
Y15006 Interleukin-1beta (IL1b) 21.57 21.78
Y18692 Chemokine K203 (K203) 21.46
These proteins are thought to function as sensors that detect conserved microbial components in intracellular compartments, similar to the role of Toll-like receptors (TLRs) at the cell surface and within endosomes. Activation of inflammasomes occurs by recognition of ligands through leucine-rich repeats (LRRs) present in the NALP proteins. This finding of the up-regulation of the NALP1 gene is noteworthy for two reasons: (1) this is the first time that a NLR receptor has been reported to be involved in host defense againstCampylobacterand (2) the up-regulated expression of the NALP1 gene in the ceca of line A birds when compared to line B birds demonstrates the importance of the recognition systems is in the resistance/susceptibility of chickens to Campylobacter. Furthermore, the related cytokines interleukin (IL)-1b and IL-18 are generated as cytosolic precursors that require cleavage by the cysteine protease caspase-1 to generate biologically active IL-1b and IL-18. In the present study, we found only a down-regulation of the IL-1b gene expressed in the ceca from line A birds when compared to line B birds and no change in gene expression in IL-18 in either line. Further studies will be required to evaluate the role of these cytokines in the host response to Campylobacter. However, it is possible that by the time of tissue collection post-inoculation in these studies (day 7), any changes in cytokine gene expression may have been missed in the array and qRT-PCR analysis. Future studies will include a kinetic evaluation of IL-1b and IL-18 gene expression.
2. Host response toC. jejunicolonizationwithinlines
Global gene expression profile. One of the major objectives in this study was to compare the gene expression changes within each line of chickens in the response to C. jejuni inoculation. In the current study, a significant response was found betweenC. jejuni-inoculated chickens and non-inoculated chickens in the gene expression profiles within the ceca of each chicken line. Following C. jejuni inoculation, there were more differentially expressed genes within line B than within line A, specifically more up-regulated genes (962 vs. 392, Figure 2).
Likewise, there was a major difference in the enriched GO terms within the two lines. Within line A, lymphocyte activation and lymphoid organ development were specifically enriched. Immunoregulatory networks play a pivotal role in modulating immune responses to pathogens in the intestine. To preserve tissue
integrity, complementary strategies are in place, including specialized lymphocytes and antigen-presenting cell populations. Regulatory T cells (Tregs) are a central component of this regulatory network by controlling both innate and adaptive immune responses [43]. Tregs integrate with other cellular and molecular components to control immune responses and are critical for intestinal immune homeostasis [44,45,46].
A certain degree of constitutive effector response and inflam-mation is beneficial for the host, not only to maintain integrity of the tissue but also to allow the host to develop protective responses when required. This implies that the steady state regulation of this environment relies on the maintenance of a balance of antagonistic signals allowing the induction and maintenance of various classes of effector lymphocytes. Indeed, at steady state, the gut is home to a large number of lymphocytes that have the capacity to produce regulatory (IL-10 or TGF-b) cytokines. Therefore, we hypothesize that the activation of Treg population of the ceca is responsible for the enriched functional GO activity of lymphocyte activation and lymphoid organ development that was observed. These results indicate a yet another different localized response toC. jejunicolonization in chickens in line A that may play a role in increased resistance to bacterial colonization.
Interestingly, circadian rhythm functional term was significantly enriched with extremely high fold enrichment (98.4) in line A. Circadian rhythms are daily oscillations of multiple biological processes driven by endogenous clocks. Circadian rhythms are known to influence the immune response of mammals through their effects on the circulation of the blood as related to diurnal sleeping/waking and activity cycles. In fact, many immune parameters, such as the number of different subtypes of circulating immune cells and the level of cytokine production in response to infection with bacteria and viruses, have been well documented to display a circadian pattern in mammals [47,48]. In humans, blood cell compartmentalization, such as with peripheral cell counts of neutrophils, T-lymphocyte subsets, B lymphocytes, monocytes, and natural killer (NK) cells, displays a circadian fluctuation across the day [49]. The peak of each subtype of cells in peripheral blood varies with time. The numbers of monocytes, B cells, and T cells reach maximum value during the sleep phase, whereas neutro-phils, NK cells, and activated T cells peak during the waking phase. Generally, these phenomena have been attributed to
Table 3.Comparison of gene expression levels between microarray and qRT-PCR.
Comparison AI/AN BI/BN AN/BN AI/BI
Method
Genes qRT-PCR Micro-array qRT-PCR Micro-array qRT-PCR Micro-array qRT-PCR Micro-array
IL-1b 22.03* 21.57* 22.21* 21.78* 23.77* 23.51*
SOCS3 21.76* 21.60* 22.71* 22.31*
K60 22.21* 21.69* 22.26* 22.02*
IL-8 22.32* 21.92*
GAL10 8.51* 3.47*
CD5 21.92* 21.50*
CD80 1.94* 21.22*
STAT5B 21.34 21.20*
GHRL 3.80* 2.08*
CLOCK 1.72* 1.29* 1.66* 1.40*
Note: Fold-change was listed in the table.
neuroendocrine circuits involving hormonal mediators, such as cortisol, melatonin, and insulin-like growth factor. A similar oscillation has also been observed in rodents [47,50]. Thus, the circadian immunological parameters which affect activity in both humans and rodents are well conserved under baseline physio-logical conditions, indicating parallel clock control mechanisms for the human and mouse immune systems.
In mammals, the molecular apparatus governing circadian rhythms has been elucidated to comprise a transcription-translation feedback loop involving more than 12 genes, including Period2(Per2) [51,52]. ThePeriod 2(Per2) gene is a key molecular component in controlling mammalian circadian rhythms at the levels of gene expression, physiology, and pathogenesis. However, the basic features of molecular clock components in the immune system and the role of clock genes in regulating host immune defenses remain uncharacterized.
Daily rhythmicities are well known in the chicken, and include rhythms in daily egg laying, calling at dawn, and daily changes in physiological functions such as metabolic rate [53], brain temperature [54], heart rate [55] and ovulation [56]. In poultry, circadian rhythms are generated by a transcription-translation-based oscillatory loop that involve clock genes, including Per2 (Period 2) andPer3,Clock, andBmal1(brain and muscle Arnt-like protein 1) [57,58,59]. PER2 forms part of a complex of proteins that inhibits the transcriptional activator that promotes the transcription of clock-controlled genes. Clock genes in quail and chickens have high homologies with those in mammals [56].
The data from the present study is the first report providing evidence for a role of circadian rhythms in poultry resistance toC. jejuni colonization. In addition, validation of two genes from this functional term by qRT-PCR further confirmed the potential role of circadian clock in the host response to C.jejuniinoculation. Most importantly, this is further evidence of a unique mechanism of host defenses in line A birds. Understanding the nature of the circadian clock in the immune system, its role in immune regulation, and avian host defenses is critical for the advancement of our knowledge of immune function which can be used to benefit therapeutic efforts. Because cytokines that are produced by lymphocytes and macrophages are potent mediators of immune responses and the levels of individual cytokines can determine immune effector mechanisms, understanding immune-circadian clock control of specific immune mechanisms may have important applications poultry genetics and resistance to pathogens.
Based on the global gene expression analysis, within line B chickens, colonization with C.jejuniresulted in considerable down-regulation of genes that encode the immune response, immune system development, inflammatory response, epithelial cell regulation and epithelial cell proliferation; all of which are involved in the local response to infection. The gastrointestinal (GI) tract is the largest interface between an animal’s internal milieu and its exterior environment. As such, it forms a physical barrier between both environments. However, the function of the GI tract in the well being of an animal is more complex than this passive role. The GI tract not only regulates the selective entry of nutrients while keeping vigilant against pathogens but also is largely responsible for shaping the immune response. Through specialized receptors and other more general mechanisms, the GI tract is not only able to sense changes in its environment but also to actively respond to these changes. These responses allow the intestine to contribute to the defense against microbes and to the control and regulation of the local immune response. The intestinal epithelium is a sensor of the luminal environment, not only controlling digestive, absorptive, and secretory functions, but also relaying information to the mucosal immune, vascular and
nervous systems. The intestinal epithelium as a critical component of a communications network that is essential for transmitting signals generated in response to infection with microbial pathogens to cells of the innate and acquired immune systems in the underlying intestinal mucosa. The gut-associated lymphoid tissue (GALT) embraces a crucial component of the total immunological capacity of the host in recognizing and selectively handling alien antigens for the initiation of immune responses. The GALT constitutes the largest mass of immune cells in the body and provides specific host defense. Close, tightly orchestrated interac-tions between the intestinal epithelium and the GALT system are critical for normal intestinal absorptive and immunological functions. Nowhere is this interdependence between the innate and acquired systems more pertinent than at the mucosal surface of the GI tract which contains the largest number of immune cells and the highest concentration of pathogens and potential pathogens, but also harmless dietary antigens and large popula-tions of commensal bacterial flora [60]. Thus, the mucosal immune system must be tightly controlled to assess and respond to antigens to which it is exposed and mount an appropriate effector or regulatory response [60,61]. The present data imply that C. jejunicolonization of the B line induces a localized suppression of both the innate (epithelial cell regulation, inflammation) and the adaptive responses that allows the bacteria to colonize the ceca. We speculate that the dramatic up-regulation in lipid, glucose, and amino acid metabolism found in line B birds may well be an attempt to shift resources away from growth to local host defenses. This localized suppressive response within line B birds is remarkably different to that observed in line A birds that appears to up-regulate the local T cell response. Further experiments are required to further characterize and delineate the local responses within each of these lines of chickens.
Immune-related gene profile. Within both lines of chickens, most immune function genes were down-regulated genes followingC. jejuniinoculation. The results provide no clear immunological-mediated mechanisms for the differential ability of birds within a line to be colonized. Further experiments are planned to look more in depth at pathogen recognition and intracellular signaling pathways that mediate the differential heterophil innate immune response that characterize these two lines of chickens.
Conclusions
foundation to further characterize and define the cellular and molecular mechanisms ofC. jejunicolonization in chickens.
Materials and Methods Ethics Statement
These studies were approved by the Institutional Animal Care and Use Committee (IACUC) at Texas A&M University (AUP#2006-234), which meet all federal requirements, as defined in the Animal Welfare Act (AWA) and the Public Health Service Policy (PHS) and the Humane Care and Use of Laboratory Animals.
Chickens,C. jejuniinoculation, and sample collection Two broiler lines, A and B, were obtained from a commercial breeding company. The bacterial inoculation and sample collection were performed as described previously [7]. In brief, C. jejuni strain 5088 was enriched in Bolton broth (Oxoid, Basingstoke, UK) at 42uC for 40 h. Within each line, 80 one-day-old chickens were orally inoculated with 0.5 ml inoculants for a final dose of 1.86105cfu per chicken, and 40 chickens from each line were mock inoculated with Phosphate Buffered Saline (PBS) as controls.
Both inoculated (I) and non-inoculated (N) birds were sacrificed at day 7 post-inoculation (pi). The cecal contents were collected and significantly higher bacterial cfu was found in line B (3.50 log10 cfu) than line A (1.39 log10 cfu) based on the number of bacteria in cecal contents [7]. Because both cecum and cecal tonsil are important lymphoid tissues, which have direct interaction with C. jejuniin cecum, the cecum including cecal tonsil was aseptically harvested and immediately immersed in 10 volumes of RNAlater (Ambion, Austin, TX) for isolation of total RNA.
Total RNA isolation, experimental design, sample labeling, and hybridization
A 15–20 mg sample was removed from RNAlater-stabilized cecum tissue, cut into pieces and placed in a 2 ml centrifuge tube containing 600ml Qiagen RNeasy Mini Kit lysis buffer (Qiagen, Valencia, CA). The PRO200 homogenizer (PRO Scientific, Oxford, CT) was used to homogenize the lysate. Total RNA was isolated from each homogenized sample and treated with TURBO DNAfreeTMKit (Ambion, Austin, TX) according to the manufacturer’s protocol. Forty individual RNA samples were isolated from each inoculated line (AI: inoculated line A, BI: inoculated line B) and twenty from each non-inoculated lines (AN: non-inoculated line A, BN: non-inoculated line B), in total, 120 individual RNA samples were isolated. Five samples in each group were randomly selected to make a pool with equal amounts of RNA. Eight pools were made in each inoculated line (AI and BI) and four in each non-inoculated line (AN and BN), in total, 24 pools were made.
Chicken 44k Agilent microarray was used in the current study. Pair-comparison was performed in the current study to provide four different comparisons: line A vs. line B (AN/BN and AI/BI) and inoculated vs. non-inoculated (AI/AN, BI/BN) and eight biological replicates were used in each comparison with dye balance except AN/BN (four biological replicates).
A 400 ng sample of total RNA from each pooled sample was used for labeling. A pool labeled with Cy3 or Cy5 was hybridized with another pool labeled with Cy5 or Cy3 and then incubated at 65uC for 17 h. The post-hybridization washes were performed according to the manufacturer’s recommendation. The labeling, hybridization and washing procedures were followed according to Agilent’s recommendation and described in detail previously [18].
Microarray data analysis
Before normalization, signal intensity of each probe was filtered against negative controls in the microarray. Different comparisons were made between two lines (AN/BN and AI/BI) and between inoculated and non-inoculated within each line (AI/AN and BI/ BN). Data normalization was performed using locally weighted scatter plot smoothing (LOWESS) [62,63] by R project (http:// www.r-project.org). The normalized natural log intensities were analyzed using a mixed model by SAS (SAS, Cary, NC) with fixed effect of treatment (I or N), line (A or B) and dye (Cy5 or Cy3) and random effect of slide and array. AP,0.01 was considered as significant. Minimum Information About a Microarray Experi-ment (MIAME) information about this experiExperi-ment has been deposited in NCBI’s Gene Expression Omnibus (GEO) [64]. The accession numbers are: platform: GPL6413; series: GSE10257.
Functional annotations for those differentially expressed up- and down-regulated genes were performed through the DAVID 2008 [19]. Statistics related to over representation of functional categories were performed using DAVID, which is based upon a Fisher Exact statistical methodology similar to that described by Al-Shahrour et al [65].
Quantitative real-time PCR
Quantitative real-time PCR (qRT-PCR) was performed as described previously [18] with the listed primers (Table S6). Briefly, 1mg of total RNA was reverse-transcribed into cDNA using random hexamers and ThermoscriptTM RT-PCR system (Invitrogen, Carlsbad, CA). qRT-PCR reagents were loaded by Eppendorf epMotion5070 workstation (Eppendorf, Westbury, NY). The amplification was performed as 1 cycle of 95uC for 10 min, 40 cycles of 59uC for 15 s and 59uC for 1 min using SYBR Green Master Mix and ABI Prism 7900HT system (Applied Biosystems, Foster City, CA). The chicken b-actin gene was used as the internal standard to correct the input of cDNA. Triplicate qRT-PCRs were performed on each cDNA and the average Ct was used for further analysis. The relative quantification values were calculated using the 2-ddCt.
Supporting Information
Table S1 List of signficantly expressed genes in the comparison of AN/BN
Found at: doi:10.1371/journal.pone.0011827.s001 (0.32 MB XLS)
Table S2 List of significantly expressed genes in the comparison of AI/BI
Found at: doi:10.1371/journal.pone.0011827.s002 (0.29 MB XLS)
Table S3 List of significantly expressed genes in the comparison of AI/AN
Found at: doi:10.1371/journal.pone.0011827.s003 (0.14 MB XLS)
Table S4 List of significantly expressed genes in the comparison of BI/BN
Found at: doi:10.1371/journal.pone.0011827.s004 (0.26 MB XLS)
Table S5 Relative expression level of genes shared between AI/ AN and BI/BN
Found at: doi:10.1371/journal.pone.0011827.s005 (0.04 MB XLS)
Found at: doi:10.1371/journal.pone.0011827.s006 (0.03 MB XLS)
Acknowledgments
The authors would like to thank Norman J. Stern from Poultry Microbiological Safety Research Unit, USDA for kindly providing the bacterial strain. The authors thank Igal Y. Pevzner from Cobb-Vantress for providing the chicken lines. Mention of commercial products is for the sole purpose of providing specific information and not a recommendation or endorsement by the USDA.
Author Contributions
Designed the microarray, provided the concepts of the study, and revised the manuscript: HZ. Carried out the microarray experiments, analyzed data and drafted the manuscript: XL. Was responsible for RNA isolation and revision of the manuscript: CLS. Contributed to data interpretation and revision of the manuscript: MHK. Assisted in sample collection, RNA isolation, array hybridization: HIC YW. Assisted in sample collection: KJG HH.
References
1. Altekruse SF, Stern NJ, Fields PI, Swerdlow DL (1999) Campylobacter jejuni— an emerging foodborne pathogen. Emerg Infect Dis 5: 28–35.
2. Buzby JC, Allos BM, Roberts T (1997) The economic burden of Campylobac-ter-associated Guillain-Barre syndrome. J Infect Dis 176 Suppl 2: S192–197. 3. Buzby JC, Roberts T, Allos BM (1997) Estimated Annual Costs of
Campylobacter-Associated Guillain-Barre Syndrome. 70 70.
4. Beery JT, Hugdahl MB, Doyle MP (1988) Colonization of gastrointestinal tracts of chicks by Campylobacter jejuni. Appl Environ Microbiol 54: 2365–2370. 5. Boyd Y, Herbert EG, Marston KL, Jones MA, Barrow PA (2005) Host genes
affect intestinal colonisation of newly hatched chickens by Campylobacter jejuni. Immunogenetics 57: 248–253.
6. Stern NJ, Meinersmann RJ, Cox NA, Bailey JS, Blankenship LC (1990) Influence of host lineage on cecal colonization by Campylobacter jejuni in chickens. Avian Dis 34: 602–606.
7. Li X, Swaggerty CL, Kogut MH, Chiang H, Wang Y, et al. (2008) The paternal effect of Campylobacter jejuni colonization in ceca in broilers. Poult Sci 87: 1742–1747.
8. Hickey TE, Baqar S, Bourgeois AL, Ewing CP, Guerry P (1999) Campylobacter jejuni-stimulated secretion of interleukin-8 by INT407 cells. Infect Immun 67: 88–93.
9. Jones MA, Totemeyer S, Maskell DJ, Bryant CE, Barrow PA (2003) Induction of proinflammatory responses in the human monocytic cell line THP-1 by Campylobacter jejuni. Infect Immun 71: 2626–2633.
10. MacCallum AJ, Harris D, Haddock G, Everest PH (2006) Campylobacter jejuni-infected human epithelial cell lines vary in their ability to secrete interleukin-8 compared to in vitro-infected primary human intestinal tissue. Microbiology 152: 3661–3665.
11. Smith CK, Kaiser P, Rothwell L, Humphrey T, Barrow PA, et al. (2005) Campylobacter jejuni-induced cytokine responses in avian cells. Infect Immun 73: 2094–2100.
12. Rosenberger CM, Pollard AJ, Finlay BB (2001) Gene array technology to determine host responses to Salmonella. Microbes Infect 3: 1353–1360. 13. Chiang H-I, Swaggerty C, Kogut M, Dowd S, Li X, et al. (2008) Gene
expression profiling in chicken heterophils with Salmonella enteritidis stimula-tion using a chicken 44 K Agilent microarray. BMC Genomics 9: 526. 14. van Hemert S, Hoekman AJ, Smits MA, Rebel JM (2006) Gene expression
responses to a Salmonella infection in the chicken intestine differ between lines. Vet Immunol Immunopathol 114: 247–258.
15. van Hemert S, Hoekman AJ, Smits MA, Rebel JM (2007) Immunological and gene expression responses to a Salmonella infection in the chicken intestine. Vet Res 38: 51–63.
16. Zhou H, Lamont SJ (2007) Global gene expression profile after Salmonella enterica Serovar enteritidis challenge in two F8 advanced intercross chicken lines. Cytogenet Genome Res 117: 131–138.
17. International Chicken Genome Sequencing Consortium (2004) Sequence and comparative analysis of the chicken genome provide unique perspectives on vertebrate evolution. Nature 432: 695–716.
18. Li X, Chiang HI, Zhu J, Dowd SE, Zhou H (2008) Characterization of a newly developed chicken 44K Agilent microarray. BMC Genomics 9: 60. 19. Dennis G, Jr., Sherman BT, Hosack DA, Yang J, Gao W, et al. (2003) DAVID:
Database for Annotation, Visualization, and Integrated Discovery. Genome Biol 4: P3.
20. Ashburner M, Ball CA, Blake JA, Botstein D, Butler H, et al. (2000) Gene ontology: tool for the unification of biology. Nat Genet 25: 25–29.
21. Smith J, Speed D, Law AS, Glass EJ, Burt DW (2004) In-silico identification of chicken immune-related genes. Immunogenetics 56: 122–133.
22. Smith J, Speed D, Hocking PM, Talbot RT, Degen WG, et al. (2006) Development of a chicken 5 K microarray targeted towards immune function. BMC Genomics 7: 49.
23. Sick C, Schneider K, Staeheli P, Weining KC (2000) Novel chicken CXC and CC chemokines. Cytokine 12: 181–186.
24. Bumstead N (2003) Genetic resistance and transmission of avian bacteria and viruses. In: Miuir WM, Aggrey SE, eds. Poultry genetics, breeding and biotechnology: CAB International. pp 311–328.
25. Ferro PJ, Swaggerty CL, Kaiser P, Pevzner IY, Kogut MH (2004) Heterophils isolated from chickens resistant to extra-intestinal Salmonella enteritidis infection
express higher levels of pro-inflammatory cytokine mRNA following infection than heterophils from susceptible chickens. Epidemiol Infect 132: 1029–1037. 26. Swaggerty CL, Ferro PJ, Pevzner IY, Kogut MH (2005) Heterophils are
associated with resistance to systemic Salmonella enteritidis infections in genetically distinct chicken lines. FEMS Immunol Med Microbiol 43: 149–154. 27. Swaggerty CL, Lowry VK, Ferro PJ, Pevzner IY, Kogut MH (2005) Disparity in susceptibility to vancomycin-resistant Enterococcus organ invasion in commer-cial broiler chickens that differ in innate immune responsiveness. Food & Agricultural Immunology 16: 1–15.
28. Klasing KC (2007) Nutrition and the immune system. Br Poult Sci 48: 525–537. 29. Kogut MH (2009) Impact of nutrition on the innate immune response to
infection in poultry. J Appl Poult Res 18: 111–124.
30. Kogut MH, Klasing K (2009) An immunologist’s perspective on nutrition, immunity, and infectious diseases: Introduction and overview. J Appl Poult Res 18: 103–110.
31. Klasing KC (2004) The cost of immunity. Acta Zool Sinica 50: 961–969. 32. Swaggerty CL, Kogut MH, Ferro PJ, Rothwell L, Pevzner IY, et al. (2004)
Differential cytokine mRNA expression in heterophils isolated from Salmonella-resistant and -susceptible chickens. Immunology 113: 139–148.
33. Swaggerty CL, Pevzner IY, Ferro PJ, Crippen TL, Kogut MH (2003) Association between in vitro heterophil function and the feathering gene in commercial broiler chickens. Avian Pathology 32: 483488.
34. Swaggerty CL, Pevzner IY, Kaiser P, Kogut MH (2008) Profiling pro-inflammatory cytokine and chemokine mRNA expression levels as a novel method for selection of increased innate immune responsiveness. Veterinary Immunology and Immunopathology 126: 35–42.
35. Swaggerty CL, Pevzner IY, Lowry VK, Farnell MB, Kogut MH (2003) Functional comparison of heterophils isolated from commercial broiler chickens. Avian Pathol 32: 95–102.
36. Lehrer RI, Ganz T (2002) Defensins of vertebrate animals. Curr Opin Immunol 14: 96–102.
37. Lynn DJ, Higgs R, Gaines S, Tierney J, James T, et al. (2004) Bioinformatic discovery and initial characterisation of nine novel antimicrobial peptide genes in the chicken. Immunogenetics 56: 170–177.
38. Lynn DJ, Higgs R, Lloyd AT, O’Farrelly C, Herve-Grepinet V, et al. (2007) Avian beta-defensin nomenclature: a community proposed update. Immunol Lett 110: 86–89.
39. Meade KG, Narciandi F, Cahalane S, Reiman C, Allan B, et al. (2008) Comparative in vivo infection models yield insights on early host immune response to Campylobacter in chickens. Immunogenetics 61: 101–110. 40. Zilbauer M, Dorrell N, Boughan PK, Harris A, Wren BW, et al. (2005)
Intestinal innate immunity to Campylobacter jejuni results in induction of bactericidal human beta-defensins 2 and 3. Infect Immun 73: 7281–7289. 41. Dowds TA, Masumoto J, Zhu L, Inohara N, Nunez G (2004)
Cryopyrin-induced interleukin 1beta secretion in monocytic cells: enhanced activity of disease-associated mutants and requirement for ASC. J Biol Chem 279: 21924–21928.
42. Franchi L, Eigenbrod T, Munoz-Planillo R, Nunez G (2009) The inflamma-some: a caspase-1-activation platform that regulates immune responses and disease pathogenesis. Nat Immunol 10: 241–247.
43. Sakaguchi S, Sakaguchi N, Shimizu J, Yamazaki S, Sakihama T, et al. (2001) Immunologic tolerance maintained by CD25+CD4+regulatory T cells: their common role in controlling autoimmunity, tumor immunity, and transplantation tolerance. Immunol Rev 182: 18–32.
44. Chen Y, Chou K, Fuchs E, Havran WL, Boismenu R (2002) Protection of the intestinal mucosa by intraepithelial gamma delta T cells. Proc Natl Acad Sci U S A 99: 14338–14343.
45. Maloy KJ, Salaun L, Cahill R, Dougan G, Saunders NJ, et al. (2003) CD4+CD25+TR Cells Suppress Innate Immune Pathology Through Cytokine-dependent Mechanisms. The Journal of Experimental Medicine 197: 111–119. 46. Read S, Malmstrom V, Powrie F (2000) Cytotoxic T lymphocyte-associated antigen 4 plays an essential role in the function of CD25(+)CD4(+) regulatory cells that control intestinal inflammation. J Exp Med 192: 295–302. 47. Floyd RA, Krueger JM (1997) Diurnal variation of TNF alpha in the rat brain.
Neuroreport 8: 915–918.
cells in host response to lipopolysaccharide-induced endotoxic shock. Infect Immun 74: 4750–4756.
49. Born J, Lange T, Hansen K, Molle M, Fehm HL (1997) Effects of sleep and circadian rhythm on human circulating immune cells. J Immunol 158: 4454–4464.
50. Panteleeva NG, Gryazeva NI, Verbitskaya LV, Shurlygina AV, Trufakin VA, et al. (2004) Diurnal variations in lymphocyte subpopulations in lymphoid organs of rats with genetic catalepsy and Wistar rats. Bull Exp Biol Med 137: 288–290.
51. Albrecht U (2004) The mammalian circadian clock: a network of gene expression. Front Biosci 9: 48–55.
52. King DP, Takahashi JS (2000) Molecular genetics of circadian rhythms in mammals. Annu Rev Neurosci 23: 713–742.
53. Berman A, Meltzer A (1978) Metabolic rate: its circadian rhythmicity in the female domestic fowl. J Physiol 282: 419–427.
54. Aschoff J, von Saint Paul U (1976) Brain temperature in the unanaesthetized chicken: its circadian rhythm of responsiveness to light. Brain Res 101: 1–9. 55. Tazawa H, Akiyama R, Moriya K (2002) Development of cardiac rhythms in
birds. Comp Biochem Physiol A Mol Integr Physiol 132: 675–689.
56. Nakao N, Yasuo S, Nishimura A, Yamamura T, Watanabe T, et al. (2007) Circadian clock gene regulation of steroidogenic acute regulatory protein gene expression in preovulatory ovarian follicles. Endocrinology 148: 3031–3038.
57. Young MW, Kay SA (2001) Time zones: a comparative genetics of circadian clocks. Nat Rev Genet 2: 702–715.
58. Reppert SM, Weaver DR (2002) Coordination of circadian timing in mammals. Nature 418: 935–941.
59. Ueda HR, Hayashi S, Chen W, Sano M, Machida M, et al. (2005) System-level identification of transcriptional circuits underlying mammalian circadian clocks. Nat Genet 37: 187–192.
60. Neish AS (2009) Microbes in gastrointestinal health and disease. Gastroenter-ology 136: 65–80.
61. Monteleone G, Peluso I, Fina D, Caruso R, Andrei F, et al. (2006) Bacteria and mucosal immunity. Dig Liver Dis 38 Suppl 2: S256–260.
62. Cleveland WS (1974) Robust locally weighted regression and smoothing scatterplots. Journal of the American Statistical Association 74: 829–836. 63. Yang YH, Dudoit S, Luu P, Lin DM, Peng V, et al. (2002) Normalization for
cDNA microarray data: a robust composite method addressing single and multiple slide systematic variation. Nucleic Acids Res 30: e15.
64. Barrett T, Troup DB, Wilhite SE, Ledoux P, Rudnev D, et al. (2007) NCBI GEO: mining tens of millions of expression profiles—database and tools update. Nucleic Acids Res 35: D760–765.