TCD
8, 999–1022, 2014Sub-ice platelet layer and its influence on
freeboard to thickness conversion
D. Price et al.
Title Page
Abstract Introduction
Conclusions References
Tables Figures
◭ ◮
◭ ◮
Back Close
Full Screen / Esc
Printer-friendly Version
Interactive Discussion
Discussion
P
a
per
|
D
iscussion
P
a
per
|
Discussion
P
a
per
|
Discuss
ion
P
a
per
|
The Cryosphere Discuss., 8, 999–1022, 2014 www.the-cryosphere-discuss.net/8/999/2014/ doi:10.5194/tcd-8-999-2014
© Author(s) 2014. CC Attribution 3.0 License.
Open Access
The Cryosphere
Discussions
This discussion paper is/has been under review for the journal The Cryosphere (TC). Please refer to the corresponding final paper in TC if available.
The sub-ice platelet layer and its influence
on freeboard to thickness conversion of
Antarctic sea ice
D. Price1, W. Rack1, P. J. Langhorne2, C. Haas3, G. Leonard4, and K. Barnsdale5
1
Gateway Antarctica, University of Canterbury, Christchurch, New Zealand
2
Department of Physics, University of Otago, Dunedin, New Zealand
3
Department of Earth and Space Science and Engineering, York University, Canada
4
National School of Surveying, University of Otago, Dunedin, New Zealand
5
Spatial Engineering Research Centre, University of Canterbury, Christchurch, New Zealand
Received: 17 January 2014 – Accepted: 22 January 2014 – Published: 6 February 2014
Correspondence to: D. Price ([email protected])
TCD
8, 999–1022, 2014Sub-ice platelet layer and its influence on
freeboard to thickness conversion
D. Price et al.
Title Page
Abstract Introduction
Conclusions References
Tables Figures
◭ ◮
◭ ◮
Back Close
Full Screen / Esc
Printer-friendly Version
Interactive Discussion
Discussion
P
a
per
|
D
iscussion
P
a
per
|
Discussion
P
a
per
|
Discuss
ion
P
a
per
|
Abstract
This is an investigation to quantify the influence of the sub-ice platelet layer on satellite measurements of total freeboard and their conversion to thickness of Antarctic sea ice. The sub-ice platelet layer forms as a result of the seaward advection of supercooled ice shelf water from beneath ice shelves. This ice shelf water provides an oceanic
5
heat sink promoting the formation of platelet crystals which accumulate at the sea ice– ocean interface. The build-up of this porous layer increases sea ice freeboard, and if not accounted for, leads to overestimates of sea ice thickness from surface elevation measurements. In order to quantify this buoyant effect, the solid fraction of the sub-ice platelet layer must be estimated. An extensive in situ data set measured in 2011 in
Mc-10
Murdo Sound in the south-western Ross Sea is used to achieve this. We use drill-hole measurements and the hydrostatic equilibrium assumption to estimate a mean value for the solid fraction of this sub-ice platelet layer of 0.16. This is highly dependent upon the uncertainty in sea ice density. We test this value with independent Global Naviga-tion Satellite System (GNSS) surface elevaNaviga-tion data to estimate sea ice thickness. We
15
find that sea ice thickness can be overestimated by up to 19 %, with a mean deviation of 12 % as a result of the influence of the sub-ice platelet layer. It is concluded that in close proximity to ice shelves this influence should be considered universally when undertaking sea ice thickness investigations using remote sensing surface elevation measurements.
20
1 Introduction
The increasing sea ice extent in the Ross Sea is the main contributor to the overall positive trend in the Antarctic sea ice cover as recorded over the satellite observational period (Parkinson and Cavalieri, 2012). The causes of this increase are unclear, but are likely linked to enhanced sea ice production in areas such as the Ross Sea Polynya
25
TCD
8, 999–1022, 2014Sub-ice platelet layer and its influence on
freeboard to thickness conversion
D. Price et al.
Title Page
Abstract Introduction
Conclusions References
Tables Figures
◭ ◮
◭ ◮
Back Close
Full Screen / Esc
Printer-friendly Version
Interactive Discussion
Discussion
P
a
per
|
D
iscussion
P
a
per
|
Discussion
P
a
per
|
Discuss
ion
P
a
per
|
characterised by the presence of ice shelf margins which are zones of abrupt physical change, in particular with regard to water mass interaction. At the large scale, the interaction of water sourced from ice shelf basal melting, which freshens the surface ocean, has been suggested as a potential contributor to increasing sea ice extent in the Southern Ocean (Bintanja et al., 2013). Of further interest, it is well known that the
5
outflow of supercooled water from the ice shelf cavity creates an additional heat sink to the ocean promoting sea ice growth (Trodahl et al., 2000; Hellmer, 2004; Purdie et al., 2006; Gough et al., 2012), which increases sea ice thickness in close proximity to ice shelves (Hellmer, 2004; Purdie et al., 2006; Hughes et al., 2014). This additional ice that forms as a direct result of oceanic heat flux driven by the availability of supercooled
10
water can be split into three components; platelet (or frazil) crystals suspended in the water column, an unconsolidated porous layer of sub-ice platelets directly beneath the sea ice and a layer of consolidated platelet ice incorporated into the sea ice (Dempsey et al., 2010). The sub-ice platelet layer, which does not contribute to the mechanical integrity of the sea ice cover, and has a very different density than consolidated ice,
15
creates an additional source of buoyancy resulting in an increase in sea ice freeboard. Currently the use of sea ice freeboard measurements from satellite altimetry is the only method to derive large-scale sea ice thickness estimates in the Antarctic (Kurtz and Markus, 2012). Using a freeboard measurement alone to estimate sea ice thickness under the hydrostatic equilibrium assumption could result in an overestimation of sea
20
ice thickness – if the influence of the unknown sub-ice platelet layer thickness turns out to be significant. Further, spatial anomalies in sea ice thickness may be interpreted as indictors of the presence of a sub-ice platelet layer, which in turn may infer the presence of supercooled ice shelf water (ISW) (Hughes et al., 2014). As it is very common for sea ice to abut ice shelves in the Antarctic (Bindschadler et al., 2011), and the extent
25
and persistence of the sub-ice platelet layer is substantially unknown, we consider here the effects of this layer on estimates of sea ice thickness.
TCD
8, 999–1022, 2014Sub-ice platelet layer and its influence on
freeboard to thickness conversion
D. Price et al.
Title Page
Abstract Introduction
Conclusions References
Tables Figures
◭ ◮
◭ ◮
Back Close
Full Screen / Esc
Printer-friendly Version
Interactive Discussion
Discussion
P
a
per
|
D
iscussion
P
a
per
|
Discussion
P
a
per
|
Discuss
ion
P
a
per
|
measurements of the local sea surface height and the sea ice elevation provides the freeboard, which can be used in conjunction with snow depth and the densities of ice and snow to estimate sea ice thickness (Zwally et al., 2008; Kurtz and Markus, 2012; Price et al., 2013). The additional influence of the sub-ice platelet layer has not yet been considered. In order to assess this influence the solid fraction (sf) of the sub-ice
5
platelet layer must be derived. Here sf defines the solid volume of ice per total volume and hence can be calculated from the buoyancy contribution of this layer to the sea ice cover above. The direct measurement of sf is complicated by the inaccessible environ-ment beneath sea ice and the immediate alteration of its properties upon disturbance by drilling due to the unconsolidated nature of the layer. Previous investigations have
10
provided values from 0.2 to 0.5 for sf of the sub-ice platelet layer (Gough et al., 2012). Here we firstly discuss deriving sf under the hydrostatic equilibrium assumption and the influential components which must be considered. We then describe our in situ data set from McMurdo Sound in the south-western Ross Sea (Fig. 1) and briefly de-scribe the sea ice conditions (Figs. 2 and 3). Using this information we estimate a sf
15
value (Fig. 4). We then focus on total freeboard (ice-plus-snow) measurements using Global Navigation Satellite System (GNSS) to estimate sea ice thickness and given our estimate of the sf, demonstrate how these GNSS based estimates are influenced by the presence of a sub-ice platelet layer. Given that GNSS based estimates of sea ice thickness follow the same principles of surface elevation to thickness conversion as
20
satellite altimeter measurements, we consider the observed affects to be applicable to both techniques. Equally, although we use a localized region to constrain our values, we expect the formation of the sub ice platelet layer to be similar in comparable ar-eas of coastal Antarctic sea ice that abut an ice shelf. Therefore, conclusions about its influence may be considered at the larger scale.
TCD
8, 999–1022, 2014Sub-ice platelet layer and its influence on
freeboard to thickness conversion
D. Price et al.
Title Page
Abstract Introduction
Conclusions References
Tables Figures
◭ ◮
◭ ◮
Back Close
Full Screen / Esc
Printer-friendly Version
Interactive Discussion
Discussion
P
a
per
|
D
iscussion
P
a
per
|
Discussion
P
a
per
|
Discuss
ion
P
a
per
|
2 Estimating solid fraction under the hydrostatic equilibrium assumption
To calculate the buoyant influence of the sub-ice platelet layer upon the sea ice cover above, sf must first be derived. Assuming hydrostatic equilibrium sf may be calculated as;
sf=−(ρw−ρi)Ti+(ρwSE)−(ρw−ρs)Ts (ρw−ρi)Tp
(1)
5
whereρw,ρiandρsare the densities of water, sea ice and snow respectively andTi,Tp
andTs are sea ice thickness, sub ice platelet layer thickness and snow depth
respec-tively (see illustration Fig. 2). Surface elevation (SE) is the elevation of the snow/air interface (or ice/air interface ifTs=0) relative to sea level. For our study all values were 10
measured simultaneously at drill holes (see Sect. 3) for the derivation of sf apart from
ρw,ρsandρi. We use a constant value of 1027 kg m− 3
forρwas there is little variability
in observed sea water density (0.1 %) in this area (Albrecht et al., 2006). Uncertainty inρwis therefore ignored. Forρswe use 385 kg m−
3
which is the mean of 18 separate well distributed ρs measurements across the south of McMurdo Sound in November 15
and December 2011.
The selection of a value for ρi is complicated by the range in measurements from
different techniques and the fact that sea ice density exhibits large natural variability. Timco and Frederking (1996) report mean ρi values for first-year (FY) sea ice are
likely in the range of 900 to 920 kg m−3. Previous unpublished direct measurements
20
ofρi in McMurdo Sound from one co-author (Langhorne) have been obtained via the
displacement method in 1992, 1994 and 1996. The 160 measurements ofρi ranged
between 900 and 925 kg m−3, the mean of these previously unpublished data being 915 kg m−3. From the same area Gough et al. (2012) reportρias 934 kg m−
3
estimated from drill-hole and freeboard measurements assuming hydrostatic equilibrium. Using
25
an amended method at seven of our drill-hole sites in 2011 where no sub-ice platelet layer was measured we obtain a mean value of 927 kg m−3
TCD
8, 999–1022, 2014Sub-ice platelet layer and its influence on
freeboard to thickness conversion
D. Price et al.
Title Page Abstract Introduction Conclusions References Tables Figures ◭ ◮ ◭ ◮ Back Close
Full Screen / Esc
Printer-friendly Version Interactive Discussion Discussion P a per | D iscussion P a per | Discussion P a per | Discuss ion P a per |
considering the uncertainties we use a value ofρi=925 kg m− 3
in our calculations, but evaluate and discuss the density dependent sensitivity of sf in the following sections.
The total error for sf can be estimated by error propagation from Eq. (1) using Drosg (2009);
σsf=
ρwSE+ρsTs−ρwTs Tp(ρw−ρi)2
σρi
2
+−T1pσTi
2
+ ρw
(ρw−ρi)TpσSE
2
+ Ts
(ρw−ρi)Tpσρs
2
+ ρs−ρw
(ρw−ρi)TpσTs
2
+
−T12 p
ρ
wSE+ρsTs−ρwTs
(ρw−ρi) −Ti
σTp
2
1/2
(2)
5
where we expect random and independent measurement errors for σρi,σTi,σSE,σρs, σT
s andσTp to be 10 kg m −3
, 0.02 m, 0.01 m, 50 kg m−3, 0.05 m and 0.10 m respectively. As we derive sf andσsf from SE, Ti,Tp,Ts and ρs, the collection of these
measure-ments from a dedicated in situ fieldwork campaign in McMurdo Sound in November
10
and December 2011 is described in the next section.
3 In situ investigation
An extensive drill-hole measurement campaign was carried out in November and De-cember 2011 collecting information on freeboard, snow depth and snow density, sea ice thickness and sub-ice platelet layer thickness for FY sea ice in McMurdo Sound
15
(Fig. 1).
3.1 Drill-hole measurements
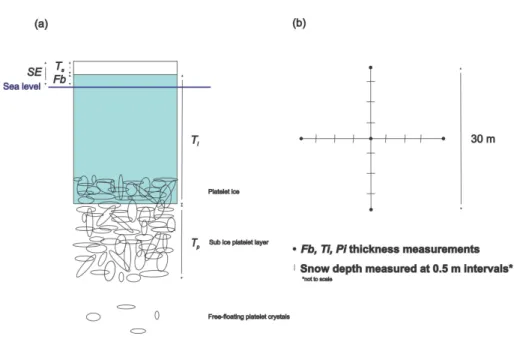
Measurements were undertaken at 40 sites distributed across an area of approximately 1000 km2 in the southern Sound. Cross-profiles with 30 m transects were established at each site, and snow depths were measured at 0.5 m intervals with a ruler (Fig. 2).
TCD
8, 999–1022, 2014Sub-ice platelet layer and its influence on
freeboard to thickness conversion
D. Price et al.
Title Page
Abstract Introduction
Conclusions References
Tables Figures
◭ ◮
◭ ◮
Back Close
Full Screen / Esc
Printer-friendly Version
Interactive Discussion
Discussion
P
a
per
|
D
iscussion
P
a
per
|
Discussion
P
a
per
|
Discuss
ion
P
a
per
|
A mean snow depth for each site was derived from these 120 measurements. Free-board, ice thickness and sub-ice platelet layer thickness were recorded at five locations at each site, once at the central crossing point and at the end points of each transect (Fig. 2). The mean of these was then calculated and taken as representative of the site. Ice thicknesses were measured by using a tape measure with a brass T-anchor
5
attached at the zero mark (Haas and Druckenmiller, 2009). This was deployed vertically through the drill-hole and allowed to rotate to a horizontal alignment when exiting the bottom of the drill-hole at the ice ocean interface. From this position, and as described in Gough et al. (2012) the anchor is slowly pulled upward until some resistance is met and the first measurement is taken. This resistance is taken to mark the sub-ice platelet
10
layer/ocean interface. The tape measure is then pulled harder, forcing the bar to pass through the sub-ice platelet layer until it sits flush against the sea ice/sub-ice platelet layer interface where a second measurement is taken. Snow density was measured at half of the drill-hole sites using a density tube and spring balance. Freeboard, ice thickness and sub-ice platelet layer thickness and snow depth were interpolated
be-15
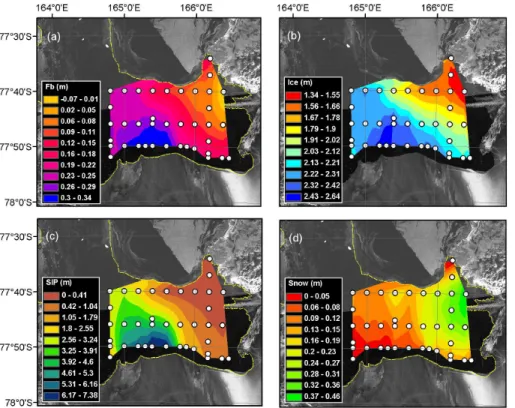
tween sites to produce thickness maps (Fig. 3) using a natural neighbour interpolation method with a maximum point separation of approximately 11 km.
3.2 Maps of sea ice and snow cover characteristics
Prior to our measurements in November and December 2011 the fast FY sea ice in McMurdo Sound experienced undisturbed growth for a minimum of 5 months. There
20
is a clear ice thickness gradient from east to west (Fig. 3). Thinner ice with a typical thickness of 1.5 m is commonplace in the east, particularly in the north east, becoming gradually thicker to the west, where it reaches 2.5 m in thickness. This is significantly higher than the pack ice of the Ross Sea which typically has a thickness of 1 m or less (Worby et al., 2008; Kurtz and Markus, 2012). In comparison to other fast ice areas,
25
TCD
8, 999–1022, 2014Sub-ice platelet layer and its influence on
freeboard to thickness conversion
D. Price et al.
Title Page
Abstract Introduction
Conclusions References
Tables Figures
◭ ◮
◭ ◮
Back Close
Full Screen / Esc
Printer-friendly Version
Interactive Discussion
Discussion
P
a
per
|
D
iscussion
P
a
per
|
Discussion
P
a
per
|
Discuss
ion
P
a
per
|
McMurdo Sound. The mean sea ice thickness as derived from all 39 drill-hole measure-ment sites was 2.11 m. In the southwest, sea ice had been growing for approximately 7 months, two months longer than in the northeast. This is the first of three mechanisms likely responsible for the observed sea ice thickness distribution. The ISW plume is the second mechanism. The influence of this plume on sea ice processes has been
doc-5
umented in studies of sea ice structure and growth (Langhorne et al., 2006; Dempsey et al., 2010; Mahoney et al., 2011; Gough et al., 2012). Satellite altimeter observations have indicated that the locations of the largest increases in multiyear sea ice thickness from 2003–2009 during the NASA ICESat mission (Price et al., 2013) were coincident with the greatest abundance of platelet ice (Dempsey et al., 2010). This region has
10
recently been identified as the location of an ISW plume (Robinson et al., 2014). The thickness and density distributions revealed by a localised airborne freeboard and thick-ness investigation of the McMurdo Ice Shelf (MIS) margin in 2009 (Rack et al., 2013) are supportive of the emergence of such a plume into McMurdo Sound. In 2011, sea ice in the west was comprised almost entirely of platelet ice (Hughes et al., 2014) as
15
would also be expected from the presence of such a plume. The sub-ice platelet layer has an east–west distribution commensurate with the presence of this plume (Hughes et al., 2014). The layer is thickest where it protrudes from the MIS front between 165◦ and 165◦30′E, where it has been measured as 7.5 m in thickness (Figs. 3 and 5). As expected, the sub-ice platelet layer distribution closely follows the platelet distribution
20
as described by Dempsey et al. (2010). As it is not a solid structure and may be mo-bile, the sub-ice platelet layer thickness at a single location may be highly variable over short time scales of hours to days.
The third mechanism which plays a role in the observed sea ice thickness distribution is snow cover. Limited published information is available on the snow depth distribution
25
TCD
8, 999–1022, 2014Sub-ice platelet layer and its influence on
freeboard to thickness conversion
D. Price et al.
Title Page
Abstract Introduction
Conclusions References
Tables Figures
◭ ◮
◭ ◮
Back Close
Full Screen / Esc
Printer-friendly Version
Interactive Discussion
Discussion
P
a
per
|
D
iscussion
P
a
per
|
Discussion
P
a
per
|
Discuss
ion
P
a
per
|
and with exposed sea ice in many places. There is a clear east–west gradient in this pattern, contrary to the sea ice thickness pattern, with deeper snow in the east grad-ually becoming thinner to the west. In the east, where the snow is thicker, it acts as an insulating layer from the atmosphere, limiting sea ice growth. In the west where it is thinner or absent, greater heat flux to the atmosphere results, which in turn facilitates
5
the formation of thicker sea ice.
4 The solid fraction in McMurdo Sound
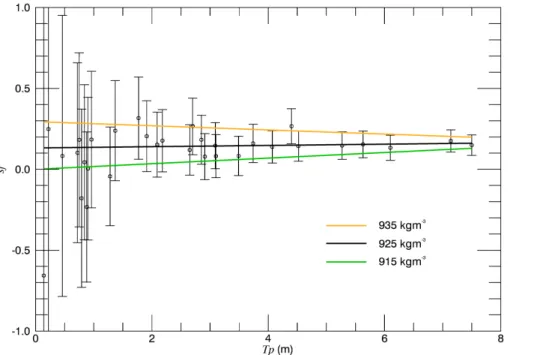
Using our drill-hole measurements the derived sf values using Eq. (1) and the expected error (σsf) from Eq. (2) are shown in black in Fig. 4 withρi=925 kg m−
3
. The derivation of sf is especially sensitive if the sub-ice platelet layer is less than 2 m thick. Sites at
10
which the sub-ice platelet layer is thin commonly produce negative sf values especially whenρi<920 kg m−
3
. Using 32 of 39 sites in our investigation where a sub-ice platelet layer is present and with the removal of 9 further sites where the sub-ice platelet layer was less than 1.5 m results in a mean sf value of 0.16±0.07. Figure 4 displays all sites where a sub-ice platelet layer was present and also linear fits of sf with ρi= 15
915 kg m−3 (green line) and ρi=935 kg m− 3
(orange line). This clearly demonstrates firstly the dependence of sf estimates onρiand secondly the high sensitivity of the sf
calculation where the sub-ice platelet layer is thin.
5 Sea ice thickness from GNSS derived surface elevation
GNSS elevation data were collected for positional and height information across the
20
Sound. The GNSS derived ellipsoidal heights, relative to WGS-84, were calibrated to produce total freeboard (ice-plus-snow) measurements, herein described as GNSS surface elevation (SEGNSS). This calibration was achieved by applying a correction
TCD
8, 999–1022, 2014Sub-ice platelet layer and its influence on
freeboard to thickness conversion
D. Price et al.
Title Page
Abstract Introduction
Conclusions References
Tables Figures
◭ ◮
◭ ◮
Back Close
Full Screen / Esc
Printer-friendly Version
Interactive Discussion
Discussion
P
a
per
|
D
iscussion
P
a
per
|
Discussion
P
a
per
|
Discuss
ion
P
a
per
|
GNSS height measurements within 0.5 km of the drill-hole measurement. This altered the reference frame of the GNSS height data from the WGS-84 ellipsoid to elevation above local sea level and permitted surface elevation information to be recorded at in-creased spatial resolution along each of the four profiles; Northern, Central, Southern and Eastern. Initially sampled at 1 Hz, the GNSS observations were averaged
along-5
track resulting in a ground separation of approximately 100 m. GNSS positions were established using the Precise Relative GNSS technique, referenced to the Scott Base base station located on Ross Island’s Hutt Point Peninsula at 77.85◦S, 166.76◦E. After processing with Trimble Business Centre, mean horizontal and vertical precision were shown to be 0.04 and 0.09 m respectively. All data where the expected vertical
pre-10
cision was greater than 0.17 m were removed. This value was chosen as it removed erroneous data in the west where GNSS precision was lower due to the larger baseline distance (anything over approximately 40 km). In order to compensate for the tidal influ-ence on the GNSS height and subsequently the SEGNSSretrieval, three separate static GNSS stations were deployed on the fast ice (see Fig. 1 for locations). These three
15
stations logged height information at 30 s intervals, which was subsequently down-sampled to 10 min intervals. As the transit time of the mobile GNSS on the sea ice was hours, this information was used to correct the rover GNSS information for tidal height variation between drill-hole cross-over points.
In order to derive sea ice thickness from SEGNSS we need to take into account the
20
effect of the sub-ice platelet layer. Following Zwally et al. (2008) we estimate sea ice thickness without taking account of the sub-ice platelet layer (Tip) in Eq. (3) and then
taking account of it (Ti) in Eq. (4):
Tip=
ρw
ρw−ρiSEGNSS−
ρw−ρs
ρw−ρiTs (3)
Ti=
ρw
ρw−ρi
SEGNSS−
ρw−ρs ρw−ρi
Ts−Tpsf (4)
25
TCD
8, 999–1022, 2014Sub-ice platelet layer and its influence on
freeboard to thickness conversion
D. Price et al.
Title Page
Abstract Introduction
Conclusions References
Tables Figures
◭ ◮
◭ ◮
Back Close
Full Screen / Esc
Printer-friendly Version
Interactive Discussion
Discussion
P
a
per
|
D
iscussion
P
a
per
|
Discussion
P
a
per
|
Discuss
ion
P
a
per
|
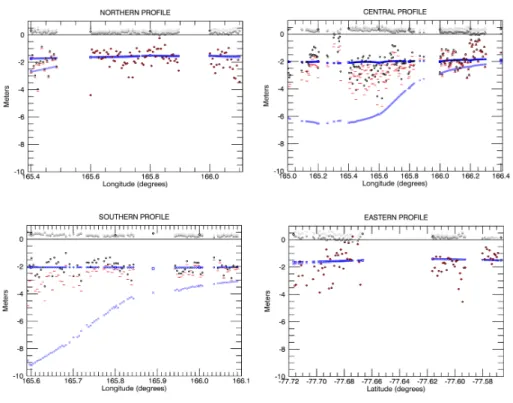
ice thickness along four continuous GNSS surface elevation profiles using Eqs. (3) and (4) (Fig. 5), the mean estimates of which are shown in Table 1. These are compared to coincident measureddrill-hole thickness. Taking the mean for all of the profiles the deviation from drill-hole measured sea ice thickness improves by 0.28 m when the sub-ice platelet layer is taken into consideration. The Northern, Central and Southern
5
profiles show a shift towardsdrill-hole sea ice thickness. The Southern profile shows a drastic improvement from a mean deviation of+0.55 m in thickness neglecting the sub-ice platelet layer to −0.01 m when accounting for it. The Central profile improves from a mean deviation of+0.43 m from thedrill-hole measurements when estimating
Tip to +0.02 m when estimating Ti. The Northern profile improves by 0.03 m but still
10
deviates from the drill-hole sea ice thickness mean by +0.24 m. This small change fromTip toTiis resultant of a negligible mean sub-ice platelet layer thickness of 0.24 m.
The Eastern profile shows no change as the platelet layer recorded there was very thin with a mean thickness of 0.04 m. The Northern and Eastern profiles both have a bias toward higher sea ice thickness estimates than measured at thedrill-holes. This could
15
be a result of the interpolations inability to capture the small scale variability of the snow cover. This could result in underestimations of snow depth and subsequently high sea ice thickness estimates.
The mean of all drill-hole measurements used along the profiles (n=20) of 2.00±0.31 corresponds better to a surface elevation derived sea ice thickness
ac-20
counting for the sub-ice platelet layer (Ti) of 2.11±0.85 m, than one in which it is ig-nored (Tip) giving 2.39±0.99 m.
As the sub-ice platelet layer is not the only source of error when estimating sea ice thickness a full error assessment is shown below. Following Spreen et al. (2006, Eq. 2) with the additional inclusion of the sub-ice platelet layer uncertainty we estimate our
TCD
8, 999–1022, 2014Sub-ice platelet layer and its influence on
freeboard to thickness conversion
D. Price et al.
Title Page
Abstract Introduction
Conclusions References
Tables Figures
◭ ◮
◭ ◮
Back Close
Full Screen / Esc
Printer-friendly Version
Interactive Discussion
Discussion
P
a
per
|
D
iscussion
P
a
per
|
Discussion
P
a
per
|
Discuss
ion
P
a
per
|
final error in sea ice thickness once accounting for the sub-ice platelet layer (σTi) as;
σTi=
ρ
w
ρw−ρiσSEGNSS
2
+ρs−ρw ρw−ρiσTs
2
+Ts(ρs−ρw)+SEGNSSρw
(ρw−ρi)2
σρi
2
+ Ts ρw−ρiσρs
2
+
σT psf
2
+ σsfTp 2
1/2
(5)
Here we estimate uncertainties in ρi and ρs to be 10 kg m− 3
and 60 kg m−3 respec-tively as indicated by the standard deviations of field measurements.Ts andTpvalues
5
used in the thickness calculation are from the interpolation of the measurement sites. Leave-one-out cross validation was used with random selection to assess the accuracy of our interpolation method. Eight drill-hole sites were removed in turn and eight sep-arate interpolations run. This procedure indicated a mean absolute deviation between the removed snow thickness measurement and subsequent interpolation of 0.05 m for
10
Ts and 0.23 m for Tp. These values are used for the uncertainties in each thickness.
The uncertainty in sf is 45 %. The main contributor to the error in sea ice thickness estimation from GNSS measurements is the accuracy of the GNSS surface elevation measurement itself. The mean GNSS vertical elevation uncertainty as indicated by the processing software is 0.09 m. At least 20 measurements are included in our along
15
track averaging to 100 m spacing reducing the random error in surface elevation mea-surements to 0.02 m i.e.σSEGNSS=0.09√
20. For a single GNSS measurement this results
in an expected sea ice thickness error of 0.58 m once the sub-ice platelet layer has been taken into account.
6 Discussion
20
TCD
8, 999–1022, 2014Sub-ice platelet layer and its influence on
freeboard to thickness conversion
D. Price et al.
Title Page
Abstract Introduction
Conclusions References
Tables Figures
◭ ◮
◭ ◮
Back Close
Full Screen / Esc
Printer-friendly Version
Interactive Discussion
Discussion
P
a
per
|
D
iscussion
P
a
per
|
Discussion
P
a
per
|
Discuss
ion
P
a
per
|
than previous estimates, but still within the uncertainty from Gough et al. (2012) of 0.25±0.06, who base their estimate on the measurement of heat fluxes. Our estimate is based on mean freeboard and thickness measurements by applying the hydrostatic equilibrium assumption. The primary systematic uncertainty in the sf estimation is sea ice density (ρi). Our result uses a meanρivalue of 925 kg m−
3
. Under the same criteria
5
as described in Sect. 4 the mean sf varies from 0.03 to 0.36 givenρi values ranging
from 915 to 935 kg m−3respectively. We used 925 kg m−3forρias it represents the
mid-dle range of expectedρiin the study area. With this value an estimate of sf is provided,
but we reiterate the dependence of the calculation on ρi. 915 kg m− 3
is considered a lower estimate of ρi as brine drainage is expected from the base of sea ice cores 10
when undertaking the displacement technique. Assuming hydrostatic equilibrium we derive 927 kg m−3forρi, a higher estimate in better agreement with the 934 kg m−
3
re-ported by Gough et al. (2012). We suggest 934 kg m−3as an upper bound toρi(Timco
and Frederking, 1996) in McMurdo Sound. Furthermore, under a simple measurement set up surface elevation could be slightly suppressed due to the loading of personal and
15
equipment near the drill-hole site. We found after testing this, that the sea ice surface may be suppressed by up to 0.01 m when such loading is present in close proximity to the drill-holes resulting inρioverestimates of approximately 5 kg m−
3
. We also sug-gest that a large number of measurements using our method are necessary as sea ice is not necessarily in hydrostatic equilibrium over very short spatial scales. We do
20
not expect this to have significantly influenced the mean of our freeboard values, and subsequently ourρiestimate as most of our drill-holes were drilled at least 15 m away
from such loading, and our estimate is an average of 35 separate drill-holes. Though we have confidence that other sources of error play a smaller role, their influence can-not be entirely ignored. A 0.1 % uncertainty in water density (ρw) has been reported by 25
Albrecht et al. (2006). This results in a±1 kg m−3 variation in reported mean ρi. Any
larger variations inρwwould result in a larger range in calculatedρi.
measure-TCD
8, 999–1022, 2014Sub-ice platelet layer and its influence on
freeboard to thickness conversion
D. Price et al.
Title Page
Abstract Introduction
Conclusions References
Tables Figures
◭ ◮
◭ ◮
Back Close
Full Screen / Esc
Printer-friendly Version
Interactive Discussion
Discussion
P
a
per
|
D
iscussion
P
a
per
|
Discussion
P
a
per
|
Discuss
ion
P
a
per
|
ments of surface elevation. Without accounting for the sub-ice platelet layer, the mean deviation of estimated level ice thickness from drill-hole measured sea ice thickness is 0.39 m. Taking account of the sub-ice platelet layer the mean deviation is reduced to 0.11 m. Therefore in areas of sea ice in close proximity to ice shelves it can be expected that thicknesses derived from freeboard or surface elevation may deviate from actual
5
thickness by 12 %, with maximum deviations in the order of 19 % as a direct result of not accounting for a sub-ice platelet layer. In our study results may be improved along certain GNSS profiles with better snow depth information.
Platelet ice and sub-ice platelet layers have been documented in many coastal Antarctic regions (Gough, 2012) making this link a key component of the Antarctic
10
coastal sea ice regime. As the GNSS surface elevation sea ice thickness estimation operates under the same fundamental principles as satellite altimetry, this establishes an uncertainty in estimating sea ice thickness from satellite altimetry in proximity to ice shelves from the presence of a sub-ice platelet layer. Given that our estimate of sf is low in the range of reported values, the influence of the sub-ice platelet layer on
15
sea ice thickness estimation from SE measurements could be even more significant. The variability of sf, both vertically through the sub-ice platelet layer and horizontally in a larger spatial sense could not be quantified. This will also play a role in the error of the estimation of sea ice thickness.
7 Conclusions
20
We have used an extensive drill-hole measurement campaign to estimate a solid frac-tion value of 0.16 for the sub-ice platelet layer found under land fast sea ice in McMurdo Sound. Using this information we were able to quantify the error associated with using satellite surface elevation measurements to estimate sea ice thickness. Sea ice thick-ness was overestimated on average by 12 % in southern McMurdo Sound as a result
25
TCD
8, 999–1022, 2014Sub-ice platelet layer and its influence on
freeboard to thickness conversion
D. Price et al.
Title Page
Abstract Introduction
Conclusions References
Tables Figures
◭ ◮
◭ ◮
Back Close
Full Screen / Esc
Printer-friendly Version
Interactive Discussion
Discussion
P
a
per
|
D
iscussion
P
a
per
|
Discussion
P
a
per
|
Discuss
ion
P
a
per
|
we propose the consideration of this influence in future sea ice thickness investigations via satellite altimetry over sea ice in close proximity to ice shelves.
Sub-ice platelet layer formation results from the advection of supercooled ice shelf water from beneath the McMurdo and Ross Ice Shelf cavities providing an oceanic heat sink for sea ice formation. This heat sink contributes to sea ice thicknesses exceeding
5
2.5 m, at least double that of sea ice in pack ice areas of the Antarctic. Given the prevalence of ice shelves around the Antarctic and the fact that approximately 35 % of the Antarctic coastline is fringed by fast ice in austral spring (Fraser et al., 2012), such interaction could be a primary driver of the sea ice thickness distribution near ice shelves. With adequate information on snow loading and using these anomalies
10
in recorded sea ice thicknesses it may be possible to map ISW presence in coastal Antarctica using satellite altimetry measurements.
Acknowledgements. The authors would like to acknowledge the K063 2011 fieldwork team
including Justin Beckers, Alex Gough and Ken Hughes and further the Scott Base staffof 2011. We would like to thank Jean-Francois Baure of Icam School of Engineering, Toulouse, France
15
for processing GNSS data during a University of Canterbury supported internship. We thank Trimble New Zealand for providing the GNSS stations used in this investigation. We are grateful for the logistics support of Antarctica New Zealand. Envisat ASAR data were received through CryoSat cal/val project 4512. This work was carried out at Gateway Antarctica, University of Canterbury, Christchurch, New Zealand.
20
References
Albrecht, N., Vennell, R., Williams, M., Stevens, C., Langhorne, P., Leonard, G., and Haskell, T.: Observation of sub-inertial internal tides in McMurdo Sound, Antarctica, Geophys. Res. Lett., 33, L24606, doi:10.1029/2006GL027377, 2006.
Bindschadler, R., Choi, H., Wichlacz, A., Bingham, R., Bohlander, J., Brunt, K., Corr, H.,
25
TCD
8, 999–1022, 2014Sub-ice platelet layer and its influence on
freeboard to thickness conversion
D. Price et al.
Title Page
Abstract Introduction
Conclusions References
Tables Figures
◭ ◮
◭ ◮
Back Close
Full Screen / Esc
Printer-friendly Version
Interactive Discussion
Discussion
P
a
per
|
D
iscussion
P
a
per
|
Discussion
P
a
per
|
Discuss
ion
P
a
per
|
created for the International Polar Year, The Cryosphere, 5, 569–588, doi:10.5194/tc-5-569-2011, 2011.
Bintanja, R., Van Oldenborgh, G. J., Drijfhout, S. S., Wouters, B., and Katsman, C. A.: Important role for ocean warming and increased ice-shelf melt in Antarctic sea-ice expansion, Nat. Geosci., 6, 376–379, doi:10.1038/ngeo1767, 2013.
5
Comiso, J. C., Kwok, R., Martin, S., and Gordon, A. L.: Variability and trends in sea ice extent and ice production in the Ross Sea, J. Geophys. Res., 116, C04021, doi:10.1029/2010JC006391, 2011.
Dempsey, D. E., Langhorne, P. J., Robinson, N. J., Williams, M. J. M., Haskell, T. G., and Frew, R. D.: Observation and modeling of platelet ice fabric in McMurdo Sound, Antarctica, J.
10
Geophys. Res., 115, C01007, doi:10.1029/2008JC005264, 2010.
Drosg, M.: Dealing with Uncertainties: a Guide to Error Analysis, Springer, Dordrecht, the Netherlands, 2009.
Fraser, A. D., Massom, R. A., Michael, K. J., Galton-Fenzi, B. K., and Lieser, J. L.: East Antarctic landfast sea ice distribution and variability, 2000–2008, J. Climate, 25, 1137–1156,
15
doi:10.1175/JCLI-D-10-05032.1, 2012.
Gough, A. J.: Sea ice near and ice shelf, Doctor of Philosophy Thesis, University of Otago, Dunedin, New Zealand, 2012.
Gough, A. J., Mahoney, A. R., Langhorne, P. J., Williams, M. J. M., Robinson, N. J., and Haskell, T. G.: Signatures of supercooling: McMurdo Sound platelet ice, J. Glaciol., 58, 38–
20
50, doi:10.3189/2012JoG10J218, 2012.
Gow, A. J., Ackley, S. F., Govoni, J. W., and Weeks, W. F.: Physical and structural properties of land-fast sea ice in McMurdo Sound, Antarctica, Antarctic Sea Ice: physical processes, interactions and variability, Antarct. Res. Ser., 74, 355–374, doi:10.1029/AR074p0355, 1998. Haas, C. and Druckenmiller, M.: Ice thickness and roughness measurements, in: Sea-Ice
Hand-25
book, edited by: Eicken, H., University of Alaska Press, Fairbanks, 2009.
Hellmer, H. H.: Impact of Antarctic ice shelf basal melting on sea ice and deep ocean properties, Geophys. Res. Lett., 31, l10307, doi:10.1029/2004GL019506, 2004.
Hughes, K. G., Langhorne, P. J., Leonard, G. H., and Stevens, C. L.: Extension of an ice shelf water plume model beneath sea ice with application in McMurdo Sound, Antarctica. J.
Geo-30
phys. Res.-Oceans, accepted, 2014.
TCD
8, 999–1022, 2014Sub-ice platelet layer and its influence on
freeboard to thickness conversion
D. Price et al.
Title Page
Abstract Introduction
Conclusions References
Tables Figures
◭ ◮
◭ ◮
Back Close
Full Screen / Esc
Printer-friendly Version
Interactive Discussion
Discussion
P
a
per
|
D
iscussion
P
a
per
|
Discussion
P
a
per
|
Discuss
ion
P
a
per
|
Langhorne, P. J., Purdie, C. R., Smith, I. J., Leonard, G. H., Kempema, E. W., Petrich, C., Gribble, M. A., Bond, P. E., and Haskell, T. G.: Antarctic landfast sea ice: the role of platelet ice, in: IAHR International Symposium on Ice, edited by: Saeki, H., Nakanishi Publishing Co. Ltd, Sapporo, Japan, 2006.
Mahoney, A. R., Gough, A. J., Langhorne, P. J., Robinson, N. J., Stevens, C. L.,
5
Williams, M. J. M., and Haskell, T. G.: The seasonal appearance of ice shelf water in
coastal Antarctica and its effect on sea ice growth, J. Geophys. Res., 116, C11032,
doi:10.1029/2011JC007060, 2011.
Parkinson, C. L. and Cavalieri, D. J.: Antarctic sea ice variability and trends, 1979–2010, The Cryosphere, 6, 871–880, doi:10.5194/tc-6-871-2012, 2012.
10
Price, D., Rack, W., Haas, C., Langhorne, P. J., and Marsh, O.: Sea ice freeboard in McMurdo Sound, Antarctica, derived by surface-validated icesat laser altimeter data, J. Geophys. Res.-Oceans, 118, 1–17, doi:10.1002/jgrc.20266, 2013.
Purdie, C. R., Langhorne, P. J., Leonard, G. H., and Haskell, T. G.: Growth of first-year landfast Antarctic sea ice determined from winter temperature measurements, Ann. Glaciol., 44, 170–
15
176, doi:10.3189/172756406781811853, 2006.
Rack, W., Haas, C., and Langhorne, P. J.: Airborne thickness and freeboard measurements over the McMurdo Ice Shelf, Antarctica, and implications for ice density, J. Geophys. Res.-Oceans, 118, 5899–5907, doi:10.1002/2013JC009084, 2013.
Robinson, N. J., Williams, M. J. M., and Stevens, C. L.: Evolution of a supercooled ISW plume
20
with an actively-growing matrix of platelet ice, J. Geophys. Res.-Oceans, accepted, 2014. Spreen, G., Kern, S., Stammer, D., Forsberg, R., and Haarpaintner, J.: Satellite-based
estimates of sea-ice volume flux through fram strait, Ann. Glaciol., 44, 321–328, doi:10.3189/172756406781811385, 2006.
Timco, G. W. and Frederking, R. M. W.: A review of sea ice density, Cold Reg. Sci. Technol.,
25
24, 1–6, 1996.
Trodahl, H. J., McGuinness, M. J., Langhorne, P. J., Collins, K., Pantoja, A. E., Smith, I. J., and Haskell, T. G.: Heat transport in McMurdo Sound first-year fast ice, J. Geophys. Res.-Oceans, 105, 11347–11358, doi:10.1029/1999JC000003, 2000.
Uto, S., Shimoda, H., and Ushio, S.: Characteristics of sea-ice thickness and snow-depth
dis-30
TCD
8, 999–1022, 2014Sub-ice platelet layer and its influence on
freeboard to thickness conversion
D. Price et al.
Title Page
Abstract Introduction
Conclusions References
Tables Figures
◭ ◮
◭ ◮
Back Close
Full Screen / Esc
Printer-friendly Version
Interactive Discussion
Discussion
P
a
per
|
D
iscussion
P
a
per
|
Discussion
P
a
per
|
Discuss
ion
P
a
per
|
Worby, A. P., Geiger, C. A., Paget, M. J., Van Woert, M. L., Ackley, S. F., and Delib-erty, T. L.: Thickness distribution of Antarctic sea ice, J. Geophys. Res., 113, 1–14, doi:10.1029/2007JC004254, 2008.
Zwally, H. J., Yi, D., Kwok, R., and Zhao, Y.: ICESat measurements of sea ice freeboard and estimates of sea ice thickness in the Weddell Sea, J. Geophys. Res., 113, C02S15,
5
TCD
8, 999–1022, 2014Sub-ice platelet layer and its influence on
freeboard to thickness conversion
D. Price et al.
Title Page
Abstract Introduction
Conclusions References
Tables Figures
◭ ◮
◭ ◮
Back Close
Full Screen / Esc
Printer-friendly Version
Interactive Discussion
Discussion
P
a
per
|
D
iscussion
P
a
per
|
Discussion
P
a
per
|
Discuss
ion
P
a
per
|
Table 1.Mean drill-hole measured, surface elevation derived sea ice thickness (Tip) and surface
elevation sub-ice platelet layer corrected thickness (Ti) with standard deviations for each profile.
The mean sub-ice platelet layer thickness (Tp) for each profile is also displayed.
Profile Drill-hole (m) Tip(m) Ti(m) MeanTp(m)
Northern 1.69±0.13 1.96±0.77 1.93±0.75 0.24±0.42
Central 2.19±0.16 2.62±1.02 2.21±0.90 2.53±1.70
Southern 2.33±0.06 2.88±0.70 2.32±0.56 3.30±2.29
TCD
8, 999–1022, 2014Sub-ice platelet layer and its influence on
freeboard to thickness conversion
D. Price et al.
Title Page
Abstract Introduction
Conclusions References
Tables Figures
◭ ◮
◭ ◮
Back Close
Full Screen / Esc
Printer-friendly Version
Interactive Discussion
Discussion
P
a
per
|
D
iscussion
P
a
per
|
Discussion
P
a
per
|
Discuss
ion
P
a
per
|
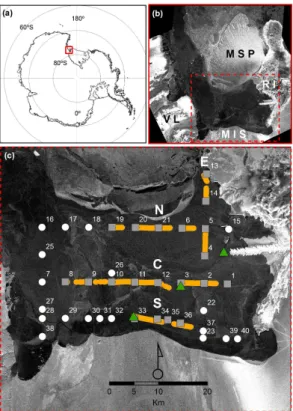
Fig. 1. (a)Location of the study area (b)Envisat Wide Swath Advanced Synthetic Aperture
Radar (ASAR) image (31 August 2011) of McMurdo Sound showing the first-year fast ice area. The McMurdo Sound Polynya (MSP) is driven by offshore winds from Ross Island (RI) in the east. Victoria Land (VL) and the McMurdo Ice Shelf (MIS) are also identified.(c) Magnified
view of red box in(b)with an ASAR image from 28 September 2011. Drill-hole measurement
TCD
8, 999–1022, 2014Sub-ice platelet layer and its influence on
freeboard to thickness conversion
D. Price et al.
Title Page
Abstract Introduction
Conclusions References
Tables Figures
◭ ◮
◭ ◮
Back Close
Full Screen / Esc
Printer-friendly Version
Interactive Discussion
Discussion
P
a
per
|
D
iscussion
P
a
per
|
Discussion
P
a
per
|
Discuss
ion
P
a
per
|
Fig. 2. (a)Typical vertical profile through first-year sea ice in McMurdo Sound in austral spring,
adapted from Gough et al. (2012). Surface elevation (SE) describes the combined protrusion of the ice freeboard (Fb) and snow cover (Ts) above sea level. Ice thickness (Ti) describes the sea ice formed from heat flux to the atmosphere along with the platelet ice which is the incorporated as the sea ice-ocean interface advances into accumulating platelets below. The sub-ice platelet layer accumulates beneath (Tp). Platelet crystals float freely in the water column
TCD
8, 999–1022, 2014Sub-ice platelet layer and its influence on
freeboard to thickness conversion
D. Price et al.
Title Page
Abstract Introduction
Conclusions References
Tables Figures
◭ ◮
◭ ◮
Back Close
Full Screen / Esc
Printer-friendly Version
Interactive Discussion
Discussion
P
a
per
|
D
iscussion
P
a
per
|
Discussion
P
a
per
|
Discuss
ion
P
a
per
|
Fig. 3. Interpolated maps of drill-hole measurements of (a) freeboard (b) ice thickness, (c)
TCD
8, 999–1022, 2014Sub-ice platelet layer and its influence on
freeboard to thickness conversion
D. Price et al.
Title Page
Abstract Introduction
Conclusions References
Tables Figures
◭ ◮
◭ ◮
Back Close
Full Screen / Esc
Printer-friendly Version
Interactive Discussion
Discussion
P
a
per
|
D
iscussion
P
a
per
|
Discussion
P
a
per
|
Discuss
ion
P
a
per
|
Fig. 4.Solid fraction (sf) derived by Eq. (1) (black circles) and expected errors from Eq. (2)
TCD
8, 999–1022, 2014Sub-ice platelet layer and its influence on
freeboard to thickness conversion
D. Price et al.
Title Page
Abstract Introduction
Conclusions References
Tables Figures
◭ ◮
◭ ◮
Back Close
Full Screen / Esc
Printer-friendly Version
Interactive Discussion
Discussion
P
a
per
|
D
iscussion
P
a
per
|
Discussion
P
a
per
|
Discuss
ion
P
a
per
|
Fig. 5.The four profiles with GNSS derived surface elevation (light grey), interpolated drill-hole