TCD
9, 1705–1733, 2015Comparing ice discharge through
West Antarctic Gateways
M. A. Martin et al.
Title Page
Abstract Introduction
Conclusions References
Tables Figures
◭ ◮
◭ ◮
Back Close
Full Screen / Esc
Printer-friendly Version Interactive Discussion
Discussion
P
a
per
|
Discussion
P
a
per
|
Discussion
P
a
per
|
Discussion
P
a
per
The Cryosphere Discuss., 9, 1705–1733, 2015 www.the-cryosphere-discuss.net/9/1705/2015/ doi:10.5194/tcd-9-1705-2015
© Author(s) 2015. CC Attribution 3.0 License.
This discussion paper is/has been under review for the journal The Cryosphere (TC). Please refer to the corresponding final paper in TC if available.
Comparing ice discharge through West
Antarctic Gateways: Weddell vs.
Amundsen Sea warming
M. A. Martin1, A. Levermann1,2, and R. Winkelmann1,2
1
Potsdam Institute for Climate Impact Research, Potsdam, Germany
2
University of Potsdam, Potsdam, Germany
Received: 26 February 2015 – Accepted: 3 March 2015 – Published: 17 March 2015
Correspondence to: M. A. Martin ([email protected])
TCD
9, 1705–1733, 2015Comparing ice discharge through
West Antarctic Gateways
M. A. Martin et al.
Title Page
Abstract Introduction
Conclusions References
Tables Figures
◭ ◮
◭ ◮
Back Close
Full Screen / Esc
Printer-friendly Version Interactive Discussion
Discussion
P
a
per
|
Discussion
P
a
per
|
Discussion
P
a
per
|
Discussion
P
a
per
|
Abstract
Future changes in Antarctic ice discharge will be largely controlled by the fate of the floating ice shelves, which exert a back-stress onto Antarctica’s marine outlet glaciers. Ice loss in response to warming of the Amundsen Sea has been observed and investi-gated as a potential trigger for the marine ice-sheet instability. Recent observations and
5
simulations suggest that the Amundsen Sea Sector might already be unstable which would have strong implications for global sea-level rise. At the same time, regional ocean projections show much stronger warm-water intrusion into ice-shelf cavities in the Weddell Sea compared to the observed Amundsen warming. Here we present re-sults of numerical ice sheet modelling with the Parallel Ice Sheet Model (PISM) which
10
show that idealized, step-function type ocean warming in the Weddell Sea leads to more immediate ice discharge with a higher sensitivity to small warming levels than the same warming in the Amundsen Sea. This is consistent with the specific combination of bedrock and ice topography in the Weddell Sea Sector which results in an ice sheet close to floatation. In response to even slight ocean warming, ice loss increases rapidly,
15
peaks and declines within one century. While the cumulative ice loss in the Amundsen Sea Sector is of similar magnitude after five centuries of continued warming, ice loss increases at a slower pace and only for significantly higher warming levels. Although there is more marine ice stored above sea level in close vicinity of the grounding line compared to the Weddell Sea Sector, the ice sheet is farther from floatation and the
20
grounding line initially retreats more slowly.
1 Introduction
Projecting sea-level rise for the next centuries requires a deep understanding of the physical processes involved and remains a major challenge for climate-change re-search. One of the biggest uncertainties lies within the dynamic contribution from the
25
TCD
9, 1705–1733, 2015Comparing ice discharge through
West Antarctic Gateways
M. A. Martin et al.
Title Page
Abstract Introduction
Conclusions References
Tables Figures
◭ ◮
◭ ◮
Back Close
Full Screen / Esc
Printer-friendly Version Interactive Discussion
Discussion
P
a
per
|
Discussion
P
a
per
|
Discussion
P
a
per
|
Discussion
P
a
per
Alley, 2011; Rignot et al., 2011) and the ocean-ice interaction beneath the buttressing ice shelves (Dupont and Alley, 2005; Pritchard and Ligtenberg, 2012). Loss of buttress-ing as a result of increased sub-shelf meltbuttress-ing can lead to groundbuttress-ing line retreat, but the bed topography cannot serve as the sole factor for the determination of glacial re-sponse in a real three-dimensional system (e.g., Gudmundsson, 2013; Gudmundsson
5
et al., 2012).
Significant warming of the Amundsen Sea (Jacobs et al., 2011) and the ongoing changes (Favier et al., 2014; Jenkins et al., 2010; Joughin et al., 2014; Mouginot et al., 2014; Rignot et al., 2014; Shepherd et al., 2002) of Pine Island and Thwaites Glaciers have put the Amundsen Sea Sector into special focus (Docquier et al., 2014; Parizek
10
et al., 2013). And while observations in the Weddell Sea Sector show that the Filchner Ronne Ice Shelf is currently thickening (Shepherd et al., 2010), regional ocean-sea-ice projections (Hellmer et al., 2012) indicate the possibility of an abrupt warming of the surrounding waters by more than 2 K within the 21st century, due to the elimination of a protective oceanic front that currently shields the ice-shelf cavity from warmer
Antarc-15
tic circumpolar waters. The Institute and Möller Glaciers feeding the Filchner Ronne Ice Shelf are located in a basin with a steep reverse bed slope showing few small-scale topographic features which could halt retreat of the grounding line between grounded ice sheet and floating ice shelf (Ross et al., 2012). Within the group of ice streams feeding the Filchner Ronne Ice Shelf, these glaciers have been identified as the ones
20
most quickly responding to melting at their grounding lines by a recent modelling study (Wright et al., 2014). Reconstructions based on radio-echo sounding suggest that this area might have been ocean floor during the last interglacial (Bingham and Siegert, 2009; Joughin et al., 2006), indicating that potential significant grounding-line retreat is not unprecedented.
25
TCD
9, 1705–1733, 2015Comparing ice discharge through
West Antarctic Gateways
M. A. Martin et al.
Title Page
Abstract Introduction
Conclusions References
Tables Figures
◭ ◮
◭ ◮
Back Close
Full Screen / Esc
Printer-friendly Version Interactive Discussion
Discussion
P
a
per
|
Discussion
P
a
per
|
Discussion
P
a
per
|
Discussion
P
a
per
|
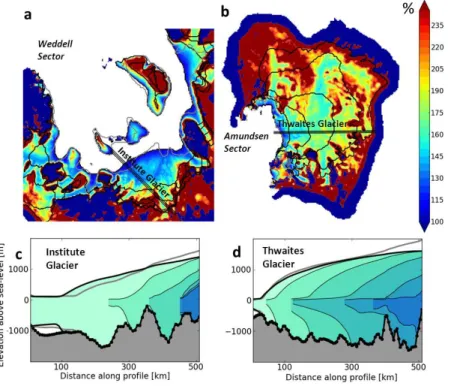
ice-sheet instability. One major difference lies in the specific combination of bed deep-ness and ice thickdeep-ness: while a large area of the ice sheet in the Weddell Sea Sector (namely the Institute and Möller Glaciers flowing around the Bungenstock Ice Rise) is currently close to floatation such that comparatively small changes in ice thickness at the grounding line lead to its retreat, this is not the case in the Amundsen Sea Sector.
5
Although the steep ice surface slope there results in a huge amount of ice stored above sea level in close vicinity to the grounding line, that very ice needs to get into motion first in order to reach the floatation criterion before contributing to sea-level rise.
2 Experiments
In order to identify which aspect of this differing ice- and bedrock topography
domi-10
nates, we investigate the ice-dynamic response of these two basins to an idealized step-function type ocean warming using the Parallel Ice Sheet Model (PISM, Bueler and Brown, 2009; Martin et al., 2011; Winkelmann et al., 2011). In order to capture ice-model uncertainty, an ensemble of 22 parameter combinations and resolutions from 24 to 2.5 km are used. Simulations are started from a set of steady states which
dif-15
fer in the model parameters governing basal resistance and ice softness but give the best match to observed grounding-line positions in both Weddell and Amundsen Sea Sectors within a wider range of parameters (see Appendix A3). The qualitative fea-tures of the ice surface gradients of Institute and Möller Glaciers (comparatively flat) and Thwaites Glacier (steepest near the grounding line) are well-captured (Fig. 1c and
20
d), although the initial ice thickness in the former ice streams is overestimated; possi-ble consequences are discussed below. Both gateways are investigated for the entire ice-parameter ensemble within the same model set-up allowing for direct comparison at 12 km resolution, while a limitation to representative ensemble members and a re-gional setup was necessary due to computational constraints for the simulations with
25
TCD
9, 1705–1733, 2015Comparing ice discharge through
West Antarctic Gateways
M. A. Martin et al.
Title Page
Abstract Introduction
Conclusions References
Tables Figures
◭ ◮
◭ ◮
Back Close
Full Screen / Esc
Printer-friendly Version Interactive Discussion
Discussion
P
a
per
|
Discussion
P
a
per
|
Discussion
P
a
per
|
Discussion
P
a
per
is spanning almost one order of magnitude (see Appendix A1 and A3). So while the question of resolution is certainly crucial for model-based projections, the uncertainty of model results is also heavily impacted by the choice of ice model parameters. We aim to show the full uncertainty within PISM by varying both, ice model parameters and resolutions, for our strictly comparative type of analysis that is not meant to be
5
understood as a projection.
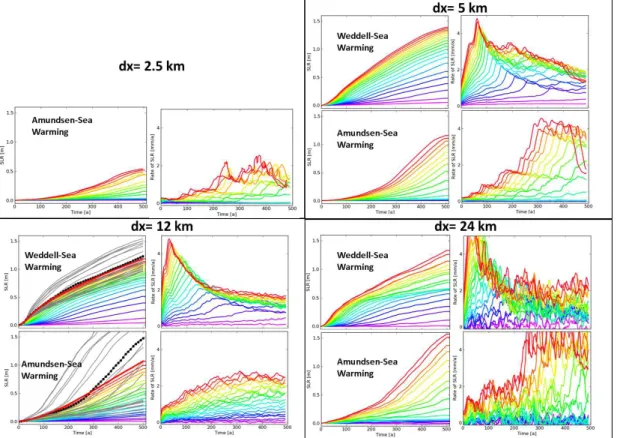
At resolutions of 2.5 to 5 km, the dynamic representation of the transition zone and the sub-grid treatment of the grounding line allow for a qualitative (i.e. “shape of the curve” regarding time and forcing dependence) representation of the grounding-line motion as apparent from the comparison with available full-Stokes simulations of
10
grounding-line motion (Feldmann et al., 2014; Pattyn et al., 2013) (for more details see Appendix A1). In a set of simple forcing experiments, a step change in ocean tem-peratures between 0.1 and 2 K is instantaneously switched on in each sector and the additional discharge in terms of sea-level-relevant ice loss is compared.
3 Results 15
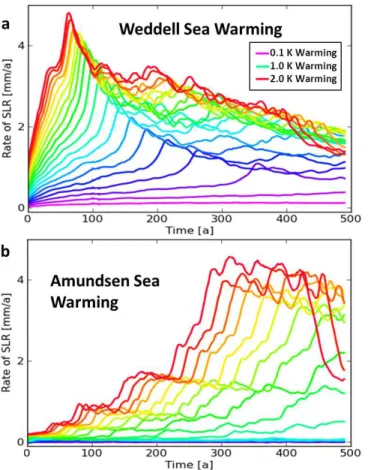
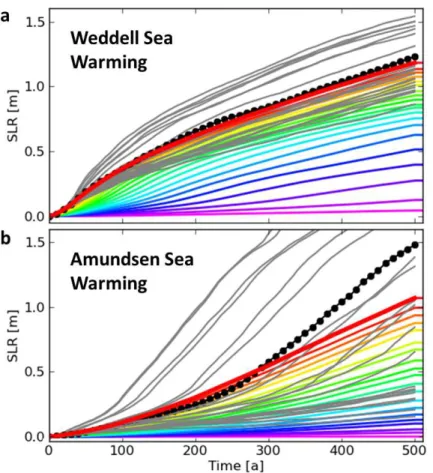
We find that the same ocean warming leads to fundamentally different responses of the two sectors. The strongest response in terms of the rate of sea-level rise (Fig. 2) occurs within the first century in the Weddell Sea Sector and is associated with rapid grounding-line retreat, mostly along the Institute and Möller Glaciers (Fig. 1a). The same warming of the Amundsen Sea initiates comparatively slow grounding-line retreat
20
of Thwaites Glacier at first, followed by increasing rates of ice loss as the grounding line eventually moves deeper into Central West Antarctica.
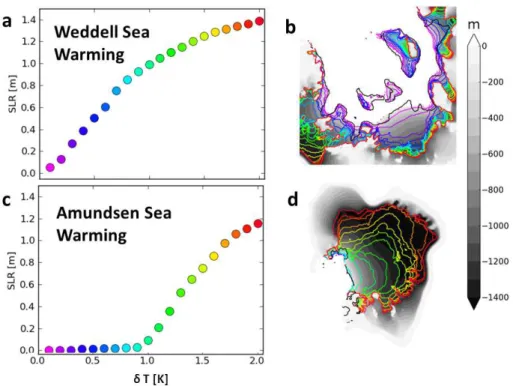
The sensitivity of ice loss to the strength of ocean warming also fundamentally differs for the two gateways (Fig. 3). We observe strong incremental ice loss per degree of warming in the Weddell Sea Sector for warming levels up to 0.8 K (Fig. 3a). Especially
25
TCD
9, 1705–1733, 2015Comparing ice discharge through
West Antarctic Gateways
M. A. Martin et al.
Title Page
Abstract Introduction
Conclusions References
Tables Figures
◭ ◮
◭ ◮
Back Close
Full Screen / Esc
Printer-friendly Version Interactive Discussion
Discussion
P
a
per
|
Discussion
P
a
per
|
Discussion
P
a
per
|
Discussion
P
a
per
|
loss is less pronounced and it occurs through the topographically stronger constrained Evans and Rutford ice streams. The situation is different for Amundsen Sea warming. While ice loss after five centuries is negligible for warming levels up to 0.9 K (Fig. 3c) because the grounding line does not significantly retreat (Fig. 3d), strong incremental ice loss per degree of ocean warming is triggered beyond 0.9 K.
5
4 Discussion
The vulnerability of an ice sheet in terms of susceptibility to positive feedbacks asso-ciated with grounding line retreat is – for our experimental setup – not a question of self-sustained ice loss, which occurs over much longer time scales (Mengel and Lev-ermann, 2014). We rather test the vulnerability to continued forcing, the “gear” that
10
translates warmer ocean waters into loss of buttressing, increased ice discharge and grounding line retreat (Drouet et al., 2013). We propose that this gear is inter alia char-acterized by the specific combination of ice- and bedrock topography of the gateways where the major ice streams flow into the ocean. Figure 1 visualizes the grounding-line migration for representative ensemble members with 5 km resolution and 2 K of
15
ocean warming. In the Weddell Sea Sector, the overdeepening below Institute and Möller Glaciers is associated with an ice sheet just thin enough to be close to floata-tion (Fig. 4). This means that even slight changes in ice thickness at the grounding line lead to its retreat, exposing the underside of the newly formed ice shelf to the continuing forcing by warm ocean waters, leading to further thinning and retreat. This
20
mechanism ultimately results in high rates of sea-level rise: although the amount of ice above floatation is limited near the grounding line, the speed of grounding line re-treat over-compensates this limitation. In the Amundsen Sea Sector, by contrast, the ice sheet upstream of the grounding line is characterized by a steep surface gradient. Therefore, although there is a comparably pronounced overdeepening of the bedrock,
25
overesti-TCD
9, 1705–1733, 2015Comparing ice discharge through
West Antarctic Gateways
M. A. Martin et al.
Title Page
Abstract Introduction
Conclusions References
Tables Figures
◭ ◮
◭ ◮
Back Close
Full Screen / Esc
Printer-friendly Version Interactive Discussion
Discussion
P
a
per
|
Discussion
P
a
per
|
Discussion
P
a
per
|
Discussion
P
a
per
mation of the initial ice thickness in Institute and Möller Glaciers reduces the simulated speed of grounding line retreat and therefore counteracts the reported high rate of ice loss, although the effect is difficult to quantify.
Other possible reasons for the different consequences of Weddell and Amundsen Sea warming include basal resistance, ice hardness and differences in ice shelf
but-5
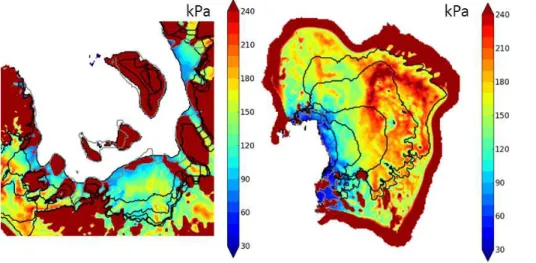
tressing. While it has been argued that basal resistance is slightly larger in Thwaites Glacier than in the Institute Möller Basin (Joughin et al., 2006, 2009; Ross et al., 2012) this is not the case in our simulations, which compute basal resistance according to a pseudo-plastic sliding law involving yield stress of saturated till (Fig. 5). Therefore, it is possible that basal resistance in reality plays an amplifying role and further increases
10
the effect discussed here; it is, however, unlikely to counter it. The same line of reason-ing applies to the modeled vertically averaged hardness (Fig. 6), which is larger in the Weddell Sea Sector and can thereby not explain the effect.
The thick and confined Filchner Ronne Ice Shelf has the potential to exert more buttressing than the ice shelves in the Amundsen Sea Embayment, such that its
disin-15
tegration could imply a stronger dynamical disruption. However, we chose not to com-pare the ice response of the different gateways to the same hypothetical reduction in buttressing, but rather compare the ice response to the same change in ocean temper-ature, and let the response of the ice shelves and therefore the ice sheet be determined by – if not elaborated but at least plausible – basic physical principles (compare
Ap-20
pendix A2). Even if it was possible to accurately compare simulations based on the relative increase in actual sub-shelf melting instead of ocean temperature, one can estimate that the qualitative and quantitative difference of the ice response would re-main. The ratio of actual ice thickness and floatation ice thickness is apparently a good measure for the grounding line retreat that can be expected for continued warm-water
25
TCD
9, 1705–1733, 2015Comparing ice discharge through
West Antarctic Gateways
M. A. Martin et al.
Title Page
Abstract Introduction
Conclusions References
Tables Figures
◭ ◮
◭ ◮
Back Close
Full Screen / Esc
Printer-friendly Version Interactive Discussion
Discussion
P
a
per
|
Discussion
P
a
per
|
Discussion
P
a
per
|
Discussion
P
a
per
|
5 Conclusions
While it cannot be claimed that PISM represents the temporal evolution of the ice re-sponse to ocean warming in a quantitatively accurate way, the qualitative difference between the Weddell and Amundsen Sea Sectors can be explained by the different ice- and bedrock topography which is independent of the specific representation of
5
the ice-dynamics in the model. Our results are not to be understood as a projection, mainly because of the experimental setup of step-function type forcing, but also for var-ious other reasons: those include the basic parameterization of sub-shelf melt rates as a function of ocean temperatures and shelf base elevation, the limited spatial resolution of bed and ice topography and the fixed surface accumulation. Also relevant is the fact
10
that we use steady states of the ice sheet as starting points for our simulations, which are presented as either an un-weighted mean of the ice physics ensemble or focus on a representative ensemble member. Nevertheless our results can provide insight about potential future differences between major West Antarctic gateways. In spite of its current stability compared to the Amundsen Sector, the ice sheet draining into the
15
TCD
9, 1705–1733, 2015Comparing ice discharge through
West Antarctic Gateways
M. A. Martin et al.
Title Page
Abstract Introduction
Conclusions References
Tables Figures
◭ ◮
◭ ◮
Back Close
Full Screen / Esc
Printer-friendly Version Interactive Discussion
Discussion
P
a
per
|
Discussion
P
a
per
|
Discussion
P
a
per
|
Discussion
P
a
per
Appendix A: Methods
A1 Ice sheet model
Simulations were carried out with the Parallel Ice Sheet Model (PISM, based on version stable0.5) at a horizontal resolution of 24, 15, 12, 5 km and for the Amundsen Sea Sector also 2.5 km (compare Figs. 7 and 8). Although even this resolution is arguably
5
too low for capturing the details of the stress balance in features such as narrow ice streams (compare Favier et al., 2014), 10 to 20 grid cells for a 50 km wide ice stream are sufficient for the strictly comparative analysis presented here. Sub-grid scale basal drag and sub-shelf melting at the grounding line ensure a more realistic grounding-line motion. While without the former PISM fails the reversibility test in the original
10
MISMIP intercomparison at 16 km resolution and succeeds at 1 km (Pattyn et al., 2013), intermediate resolutions are tested by Feldmann et al. (2014), along with new sub-grid features. They enhance the model performance considerably, even at resolutions as coarse as 5 or 12 km.
PISM captures lateral resistance as well stress transmission across the grounding
15
line by using the hybrid shallow approximation (Bueler and Brown, 2009; Winkelmann et al., 2011). The model hence simulates the loss of buttressing caused by ice-shelf thinning (Gagliardini et al., 2010) and the possible resulting grounding-line retreat. The kinematic calving law allows for a gradual retreat of the calving front in response to changes in the velocity field. Therefore, buttressing can also reduce as a result of
20
calving front retreat behind pinning points like, e.g., Berker Island.
The simulated ice topography is especially sensitive to basal drag (Gladstone et al., 2012). In order to cover the full sliding-specific uncertainty in PISM, a three-dimensional parameter space for basal sliding is therefore sampled in the experiments presented here, and resolutions dependence is checked as well (see Sect. A3 and Figs. 8 and 9).
25
TCD
9, 1705–1733, 2015Comparing ice discharge through
West Antarctic Gateways
M. A. Martin et al.
Title Page
Abstract Introduction
Conclusions References
Tables Figures
◭ ◮
◭ ◮
Back Close
Full Screen / Esc
Printer-friendly Version Interactive Discussion
Discussion
P
a
per
|
Discussion
P
a
per
|
Discussion
P
a
per
|
Discussion
P
a
per
|
A2 Boundary conditions
PISM is run using the ALBMAP bedrock topography (Le Brocq et al., 2010) like in the SeaRISE effort (Bindschadler et al., 2013; Nowicki et al., 2013). Compare also Fig. 11 for an Antarctica-wide display of this measure from ALBMAP data. The influ-ence of bedrock roughness on grounding line migration for different resolutions is hard
5
to quantify. At least for the 5 km simulations the original bedrock data did not need to be smoothed. Steady surface temperature and mass balance fields from RACMO (Van de Berg et al., 2006) serve as climatic input data. Constant-in-time present day (av-eraged 1950–1980) temperature- and salinity fields from ocean modeling with BRIOS (Timmermann et al., 2002) are used for preparation of the initial states of the
Antarc-10
tic Ice Sheet, translated into melt rates by a basic three equation system (Scheduikat and Olbers, 1990). The melt rates therefore roughly adapt to changing ice-shelf depth, while effects of sub-shelf circulation changes are ignored. Although this procedure is not particularly realistic, it suffices for the comparative type of analysis of idealized experiments that we are performing. In the experiments, a uniform and time-constant
15
anomaly in ocean temperatures between 0.1 and 2 K is applied. Gaps in the original ocean-temperature and salinity fields in the ice-shelf cavity, which become larger as the grounding line retreats and the ice-shelf cavities extend to formerly grounded marine areas, are filled using a simple 2d-lateral diffusion equation.
A3 Experimental design 20
In this study we are using PISM exclusively. Since alternative approximations to the stress balance, among other things, can strongly influence a model’s response to loss in buttressing (Favier et al., 2014), we aim at exploring a broad range of free parame-ters within PISM. In order to cover the full sliding-specific uncertainty, which has been identified to have the strongest impact on the models response to ice shelf thinning
25
TCD
9, 1705–1733, 2015Comparing ice discharge through
West Antarctic Gateways
M. A. Martin et al.
Title Page
Abstract Introduction
Conclusions References
Tables Figures
◭ ◮
◭ ◮
Back Close
Full Screen / Esc
Printer-friendly Version Interactive Discussion
Discussion
P
a
per
|
Discussion
P
a
per
|
Discussion
P
a
per
|
Discussion
P
a
per
the yield stress according to the Mohr–Coulomb Model for saturated till, (Paterson, 1994; compare also Winkelmann et al., 2011), basal resistance exponent m (which determines the degree to which the pseudo-plastic till model is linear or plastic, com-pare PISM manual) and enhancement factorESSA(Fig. 9, compare Winkelmann et al.,
2011). The enhancement factor governing ice softness relevant for vertical shearing,
5
ESIA, is fixed to a value of 4.5, as its influence on the ice response to sub-shelf melting is weak. The preparation of the initial states with 15 km resolution consists of 300 ka of thermal equilibration, followed by a transitional run of 20 ka simulating full ice dynamics with present-day ocean temperatures reduced by 0.05 K. The following 50 ka dynamic run with present-day oceanic input brings the modeled ice sheet close to a steady
10
state.
From all combinations of the three ice-flow parameters we select those 24 which allow for an at least rough match of grounding-line positions (Fig. 9). There is a clear distinction between those model versions and others, namely the abrupt collapse of significant parts of the ice sheet or the similar abrupt grounding of a significant fraction
15
of the ice shelf when sampling the parameter space. Because we are using steady states of the ice sheet as starting points for our simulations, there would be no qualified exactness added when being more selective in the model versions. In order to constrain the initial state better, a historically validated (Hillenbrand et al., 2013) dynamical spin-up of an ensemble of model versions would be necessary, in order to exclude those
20
that are over- or underresponsive to external perturbations (Aschwanden et al., 2013). This, however, is beyond the scope of this paper.
In order to rescale the horizontal resolution to 12 km, two thousand years of simula-tion time with steady input are added, which excludes two further ensemble members such that our final ensemble consists of 22 initial states. A representative ensemble
25
TCD
9, 1705–1733, 2015Comparing ice discharge through
West Antarctic Gateways
M. A. Martin et al.
Title Page
Abstract Introduction
Conclusions References
Tables Figures
◭ ◮
◭ ◮
Back Close
Full Screen / Esc
Printer-friendly Version Interactive Discussion
Discussion
P
a
per
|
Discussion
P
a
per
|
Discussion
P
a
per
|
Discussion
P
a
per
|
computational constraints. They are performed for the representative ensemble mem-bers indicated in Fig. 9a.
The forcing experiments for the entire ice-physics ensemble are performed without any changes in ice-model parameters after spin-up. They employ a uniform temper-ature anomaly in the specified ocean sectors, which is switched on instantaneously
5
and kept at the same level during the entire simulation time of 500 years. Results from control runs without ocean warming (drift of less than 0.15 cm sea-level equivalent per century for 5 km simulations) are subtracted for all time-series.
Acknowledgements. This study was supported by the German Federal Ministry of Education and Research (BMBF, grant 01LP1171A). We thank M. Mengel, T. Albrecht and J. Feldmann
10
for their collaboration and help during model setup.
References
Aschwanden, A., Aðalgeirsdóttir, G., and Khroulev, C.: Hindcasting to measure ice sheet model sensitivity to initial states, The Cryosphere, 7, 1083–1093, doi:10.5194/tc-7-1083-2013, 2013.
15
Bamber, J. L., Riva, R. E. M., Vermeersen, B. L. A., and LeBrocq, A. M.: Reassessment of the potential sea-level rise from a collapse of the West Antarctic Ice Sheet, Science, 324, 901–903, doi:10.1126/science.1169335, 2009.
Bindschadler, R. A., Nowicki, S., Abe-Ouchi, A., Aschwanden, A., Choi, H., Fastook, J., Granzow, G., Greve, R., Gutowski, G., Herzfeld, U., Jackson, C., Johnson, J., Khroulev,
20
C., Levermann, A., Lipscomb, W. H., Martin, M. A., Morlighem, M., Parizek, B. R., Pol-lard, D., Price, S. F., Ren, D., Rignot, E., Saito, F., Sato, T., Seddik, H., Seroussi, H., Taka-hashi, K., Walker, R., Wang, W. L.: Ice-sheet model sensitivities to environmental forcing and their use in projecting future sea level (the SeaRISE project), J. Glaciol., 59, 195–224, doi:10.3189/2013JoG12J125, 2013.
25
TCD
9, 1705–1733, 2015Comparing ice discharge through
West Antarctic Gateways
M. A. Martin et al.
Title Page
Abstract Introduction
Conclusions References
Tables Figures
◭ ◮
◭ ◮
Back Close
Full Screen / Esc
Printer-friendly Version Interactive Discussion
Discussion
P
a
per
|
Discussion
P
a
per
|
Discussion
P
a
per
|
Discussion
P
a
per
Bueler, E. and Brown, J.: The shallow shelf approximation as a sliding law in a thermomechan-ically coupled ice sheet model, J. Geophys. Res., 114, F03008, doi:10.1029/2008JF001179, 2009.
Docquier, D., Pollard, D., and Pattyn, F.: Thwaites Glacier grounding-line retreat: influence of width and buttressing parameterizations, J. Glaciol., 60, 305–313,
5
doi:10.3189/2014JoG13J117, 2014.
Drouet, A. S., Docquier, D., Durand, G., Hindmarsh, R., Pattyn, F., Gagliardini, O., and Zwinger, T.: Grounding line transient response in marine ice sheet models, The Cryosphere, 7, 395–406, doi:10.5194/tc-7-395-2013, 2013.
Dupont, T. K. and Alley, R. B.: Assessment of the importance of shelf buttressing to
ice-10
sheet flow, Geophys. Res. Lett., 32, L04503, doi:10.1029/2004GL022024, 2005.
Favier, L., Durand, G., Cornford, S. L., Gudmundsson, G. H., Gagliardini, O., Gillet-Chaulet, F., Zwinger, T., Payne, A. J., and Le Brocq, A. M.: Retreat of Pine Island Glacier controlled by marine ice-sheet instability, Nat. Clim. Chang., 4, 117–121, doi:10.1038/nclimate2094, 2014. Feldmann, J., Albrecht, T., Khroulev, C., Pattyn, F., and Levermann, A.:
Resolution-15
dependent performance of grounding line motion in a shallow model compared with a full-Stokes model according to the MISMIP3d intercomparison, J. Glaciol., 60, 353–360, doi:10.3189/2014JoG13J093, 2014.
Gagliardini, O., Durand, G., Zwinger, T., Hindmarsh, R. C. A., and Le Meur, E.: Coupling of ice-shelf melting and buttressing is a key process in ice-sheets dynamics, Geophys. Res. Lett.,
20
37, L14501, doi:10.1029/2010GL043334, 2010.
Gladstone, R. M., Payne, A. J., and Cornford, S. L.: Resolution requirements for grounding-line modelling: sensitivity to basal drag and ice-shelf buttressing, Ann. Glaciol., 53, 97–105, 2012.
Gudmundsson, G. H.: Ice-shelf buttressing and the stability of marine ice sheets, The
25
Cryosphere, 7, 647–655, doi:10.5194/tc-7-647-2013, 2013.
Gudmundsson, G. H., Krug, J., Durand, G., Favier, L., and Gagliardini, O.: The stability of grounding lines on retrograde slopes, The Cryosphere, 6, 1497–1505, doi:10.5194/tc-6-1497-2012, 2012.
Hellmer, H. H., Kauker, F., Timmermann, R., Determann, J., and Rae, J.: Twenty-first-century
30
TCD
9, 1705–1733, 2015Comparing ice discharge through
West Antarctic Gateways
M. A. Martin et al.
Title Page
Abstract Introduction
Conclusions References
Tables Figures
◭ ◮
◭ ◮
Back Close
Full Screen / Esc
Printer-friendly Version Interactive Discussion
Discussion
P
a
per
|
Discussion
P
a
per
|
Discussion
P
a
per
|
Discussion
P
a
per
|
Hillenbrand, C.-D., Bentley, M. J., Stolldorf, T. D., Hein, A. S., Kuhn, G., Graham, A. G. C. C., Fogwill, C. J., Kristoffersen, Y., Smith, J. A., Anderson, J. B., Larter, R. D., Melles, M., Hodg-son, D. A., Mulvaney, R., and Sugden, D. E.: Reconstruction of changes in the Weddell Sea sector of the Antarctic Ice Sheet since the Last Glacial Maximum, Quaternary Sci. Rev., 100, 111–136, doi:10.1016/j.quascirev.2013.07.020, 2013.
5
Jacobs, S. S., Jenkins, A., Giulivi, C. F., and Dutrieux, P.: Stronger ocean circulation and increased melting under Pine Island Glacier ice shelf, Nat. Geosci., 8, 519–523, doi:10.1038/ngeo1188, 2011.
Jenkins, A., Dutrieux, P., and Jacobs, S.: Observations beneath Pine Island Glacier in West Antarctica and implications for its retreat, Nat. Geosci., 3, 468–472, doi:10.1038/ngeo890,
10
2010.
Joughin, I. and Alley, R. B.: Stability of the West Antarctic ice sheet in a warming world, Nat. Geosci., 4, 506–513, doi:10.1038/ngeo1194, 2011.
Joughin, I., Bamber, J. L., Scambos, T., Tulaczyk, S., Fahnestock, M., and MacAyeal, D. R.: Integrating satellite observations with modelling: basal shear stress of the Filcher-Ronne
15
ice streams, Antarctica, Philos. T. R. Soc. A, 364, 1795–1814, doi:10.1098/rsta.2006.1799, 2006.
Joughin, I., Tulaczyk, S., Bamber, J., Blankenship, D., Holt, J., Scambos, T., and Vaughan, D.: Basal conditions for Pine Island and Thwaites Glaciers determined using satellite and air-borne data, J. Glaciol., 55, 245–257, 2009.
20
Joughin, I., Smith, B. E., and Medley, B.: Marine ice sheet collapse potentially un-derway for the Thwaites Glacier Basin, West Antarctica, Science, 344, 735–783, doi:10.1126/science.1249055, 2014.
Le Brocq, A. M., Payne, A. J., and Vieli, A.: An improved Antarctic dataset for high resolution nu-merical ice sheet models (ALBMAP v1), Earth Syst. Sci. Data, 2, 247–260,
doi:10.5194/essd-25
2-247-2010, 2010.
Ma, Y., Gagliardini, O., Ritz, C., Gillet-Chaulet, F., Durand, G., and Montagnat, M.: Enhance-ment factors for grounded ice and ice shelves inferred from an anisotropic ice-flow model, J. Glaciol., 56, 805–812, doi:10.3189/002214310794457209, 2010.
Martin, M. A., Winkelmann, R., Haseloff, M., Albrecht, T., Bueler, E., Khroulev, C., and
Lever-30
TCD
9, 1705–1733, 2015Comparing ice discharge through
West Antarctic Gateways
M. A. Martin et al.
Title Page
Abstract Introduction
Conclusions References
Tables Figures
◭ ◮
◭ ◮
Back Close
Full Screen / Esc
Printer-friendly Version Interactive Discussion
Discussion
P
a
per
|
Discussion
P
a
per
|
Discussion
P
a
per
|
Discussion
P
a
per
Meehl, G. A., Stocker, T. F., Collins, W. D., Friedlingstein, P., Gaye, A. T., Gregory, J. M., Zhao, A. K., Knutti, R., Murphy, J. M., Noda, A., Raper, S. C. B., Watterson, I. G., Weaver, A. J., and Zhao, Z.-C.: Climate Change 2007: The Physical Science Basis. Contribution of Working Group I to the Fourth Assessment Report of the Intergovernmental Panel on Cli-mate Change, in IPCC, edited by: Solomon, S., Qin, D., Manning, M., Chen, Z., Marquis, M.,
5
Averyt, K. B., Tignor, M., and Miller, H. L., Cambridge University Press, Cambridge, UK and New York, NY, USA, 2007.
Mengel, M. and Levermann, A.: Ice plug prevents irreversible discharge from East Antarctica, Nat. Clim. Chang., 4, 451–455, doi:10.1038/NCLIMATE2226, 2014.
Mouginot, J., Rignot, E., and Scheuchl, B.: Sustained increase in ice discharge from the
Amund-10
sen Sea Embayment, West Antarctica, from 1973 to 2013, Geophys. Res. Lett., 41, 1576– 1584, doi:10.1002/2013GL059069, 2014.
Nowicki, S., Bindschadler, R. A., Abe-Ouchi, A., Aschwanden, A., Bueler, E., Choi, H., Fas-took, J., Granzow, G., Greve, R., Gutowski, G., Herzfeld, U., Jackson, C., Johnson, J., Khroulev, C., Larour, E., Levermann, A., Lipscomb, W. H., and Martin, M. A., and Morlighem,
15
M., Parizek, B. R., Pollard, D., Price, S. F., Ren, D., Rignot, E., Saito, F., Sato, T., Seddik, H., Seroussi, H., Takahashi, K., Walker, R., and Wang, W. L.: Insights into spatial sensitivities of ice mass response to environmental change from the SeaRISE ice sheet modeling project I: Antarctica, J. Geophys. Res.-Earth, 118, 1002–1024, doi:10.1002/jgrf.20081, 2013.
Parizek, B. R., Christianson, K., Anandakrishnan, S., Alley, R. B., Walker, R. T., Edwards, R. A.,
20
Wolfe, D. S., Bertini, G. T., Rinehart, S. K., Bindschadler, R. A., and Nowicki, S. M. J.: Dy-namic (in)stability of Thwaites Glacier, West Antarctica, J. Geophys. Res.-Earth, 118, 638– 655, doi:10.1002/jgrf.20044, 2013.
Paterson, W. S. B.: The Physics of Glaciers, edited by: Pergamon, Elsevier, Oxford, 1994. Pattyn, F., Perichon, L., Durand, G., Favier, L., Gagliardini, O., Hindmarsh, R. C. A., Zwinger, T.,
25
Albrecht, T., Cornford, S., Docquier, D., Fürst, J. J., Goldberg, D., Gudmundsson, G. H., Hum-bert, A., Hütten, M., Huybrechts, P., Jouvet, G., Kleiner, T., Larour, E., Martin, D., Morlighem, M., Payne, A. J., Pollard, D., Rückamp, M., Rybak, O., Seroussi, H., Thoma, M., and Wilkens, N.: Grounding-line migration in plan-view marine ice-sheet models: results of the ice2sea MISMIP3d intercomparison, J. Glaciol., 59, 410–422, doi:10.3189/2013JoG12J129, 2013.
30
TCD
9, 1705–1733, 2015Comparing ice discharge through
West Antarctic Gateways
M. A. Martin et al.
Title Page
Abstract Introduction
Conclusions References
Tables Figures
◭ ◮
◭ ◮
Back Close
Full Screen / Esc
Printer-friendly Version Interactive Discussion
Discussion
P
a
per
|
Discussion
P
a
per
|
Discussion
P
a
per
|
Discussion
P
a
per
|
Rignot, E., Velicogna, I., van den Broeke, M. R., Monaghan, A., and Lenaerts, J.: Acceleration of the contribution of the Greenland and Antarctic ice sheets to sea level rise, Geophys. Res. Lett., 38, 1–5, doi:10.1029/2011GL046583, 2011.
Rignot, E., Mouginot, J., Morlighem, M., Seroussi, H., and Scheuchl, B.: Widespread, rapid grounding line retreat of Pine Island, Thwaites, Smith, and Kohler glaciers, West Antarctica,
5
from 1992 to 2011, Geophys. Res. Lett., 41, 3502–3509, doi:10.1002/2014GL060140, 2014. Ross, N., Bingham, R. G., Corr, H. F. J., Ferraccioli, F., Jordan, T. A., Le Brocq, A.,
Rip-pin, D. M., Young, D., Blankenship, D. D., and Siegert, M. J.: Steep reverse bed slope at the grounding line of the Weddell Sea sector in West Antarctica, Nat. Geosci., 5, 393–396, doi:10.1038/ngeo1468, 2012.
10
Scheduikat, M. and Olbers, D. J.: A one-dimensional mixed layer model beneath the Ross Ice Shelf with tidally induced vertical mixing, Antarct. Sci., 2, 29–42, doi:10.1017/S0954102090000049, 1990.
Shepherd, A., Wingham, D., and Mansley, J.: Inland thinning of the Amundsen Sea sector, West Antarctica, Geophys. Res. Lett., 29, 7–10, 2002.
15
Shepherd, A., Wingham, D., Wallis, D., Giles, K., Laxon, S., and Sundal, A. V.: Recent loss of floating ice and the consequent sea level contribution, Geophys. Res. Lett., 37, L13503, doi:10.1029/2010GL042496, 2010.
Timmermann, R., Beckmann, A., and Hellmer, H. H.: Simulations of ice–ocean dynamics in the Weddell Sea 1. Model configuration and validation, J. Geophys. Res., 107, 3024,
20
doi:10.1029/2000JC000741, 2002.
Van de Berg, W. J., Van den Broeke, M. R., Reijmer, C. H., and Van Meijgaard, E.: Reassess-ment of the Antarctic surface mass balance using calibrated output of a regional atmospheric climate model, J. Geophys. Res., 111, D11104, doi:10.1029/2005JD006495, 2006.
Winkelmann, R., Martin, M. A., Haseloff, M., Albrecht, T., Bueler, E., Khroulev, C., and
Lever-25
mann, A.: The Potsdam Parallel Ice Sheet Model (PISM-PIK) – Part 1: Model description, The Cryosphere, 5, 715–726, doi:10.5194/tc-5-715-2011, 2011.
Wright, A. P., Le Brocq, A. M., Cornford, S. L., Bingham, R. G., Corr, H. F. J., Ferraccioli, F., Jor-dan, T. A., Payne, A. J., Rippin, D. M., Ross, N., and Siegert, M. J.: Sensitivity of the Weddell Sea sector ice streams to sub-shelf melting and surface accumulation, The Cryosphere, 8,
30
TCD
9, 1705–1733, 2015Comparing ice discharge through
West Antarctic Gateways
M. A. Martin et al.
Title Page
Abstract Introduction
Conclusions References
Tables Figures
◭ ◮
◭ ◮
Back Close
Full Screen / Esc
Printer-friendly Version Interactive Discussion
Discussion
P
a
per
|
Discussion
P
a
per
|
Discussion
P
a
per
|
Discussion
P
a
per
|
TCD
9, 1705–1733, 2015Comparing ice discharge through
West Antarctic Gateways
M. A. Martin et al.
Title Page
Abstract Introduction
Conclusions References
Tables Figures
◭ ◮
◭ ◮
Back Close
Full Screen / Esc
Printer-friendly Version Interactive Discussion
Discussion
P
a
per
|
Discussion
P
a
per
|
Discussion
P
a
per
|
Discussion
P
a
per
Figure 3.Forcing-dependence of sea-level response to Weddell vs. Amundsen Sea warming, 5 km resolution.(a, c)Sea-level rise after 5 centuries for different levels of ocean-warming. The dependence of the sea-level response on the forcing is qualitatively different for the two basins.
TCD
9, 1705–1733, 2015Comparing ice discharge through
West Antarctic Gateways
M. A. Martin et al.
Title Page
Abstract Introduction
Conclusions References
Tables Figures
◭ ◮
◭ ◮
Back Close
Full Screen / Esc
Printer-friendly Version Interactive Discussion
Discussion
P
a
per
|
Discussion
P
a
per
|
Discussion
P
a
per
|
Discussion
P
a
per
Figure 4. Ratio of ice thickness and floatation ice thickness, H/Hf (shading [%]) during the
TCD
9, 1705–1733, 2015Comparing ice discharge through
West Antarctic Gateways
M. A. Martin et al.
Title Page
Abstract Introduction
Conclusions References
Tables Figures
◭ ◮
◭ ◮
Back Close
Full Screen / Esc
Printer-friendly Version Interactive Discussion
Discussion
P
a
per
|
Discussion
P
a
per
|
Discussion
P
a
per
|
Discussion
P
a
per
|
TCD
9, 1705–1733, 2015Comparing ice discharge through
West Antarctic Gateways
M. A. Martin et al.
Title Page
Abstract Introduction
Conclusions References
Tables Figures
◭ ◮
◭ ◮
Back Close
Full Screen / Esc
Printer-friendly Version Interactive Discussion
Discussion
P
a
per
|
Discussion
P
a
per
|
Discussion
P
a
per
|
Discussion
P
a
per
|
TCD
9, 1705–1733, 2015Comparing ice discharge through
West Antarctic Gateways
M. A. Martin et al.
Title Page
Abstract Introduction
Conclusions References
Tables Figures
◭ ◮
◭ ◮
Back Close
Full Screen / Esc
Printer-friendly Version Interactive Discussion
Discussion
P
a
per
|
Discussion
P
a
per
|
Discussion
P
a
per
|
Discussion
P
a
per
Figure 9.Characterization of the ice-physics ensemble (for 15 and 12 km resolution). The three ice-parameters explored are the pore-water fractionFPW, the enhancement factor ESSA and
the basal resistance exponentm (see Eqs. 10 and 13 in Winkelmann et al., 2011) and ex-ponent m in Eq. (1) on page 35 in the PISM manual, version stable0.5, respectively). FPW
and m both determine basal resistance.ESSAcontrols the ice softness but also affects sliding, since the SSA velocity is used as sliding velocity in PISM (Bueler and Brown, 2009). Color-ing characterizes the relative deviation [%] in upper surface elevation compared to ALBMAP data. The representative ensemble member, which is the same that was used for the SeaRISE project (Bindschadler et al., 2013; Nowicki et al., 2013) (squared) has the parameter combi-nationFPW=0.91,ESSA=0.6 andm=0.25. It also applies to the 24 km-resolution simulation. The letters W and A indicate the parameter combinations used in the regional simulations with resolutions of 5 and 2.5 km of the Weddell and Amundsen Sea Sector, respectively.(a) The
FPW−ESSA subspace of the three-dimensional parameter space (withm=0.25) is
character-ized for the Weddell Sector. Parameter combinations are excluded if the modeled grounding-line is located too far upstream (red circles) or downstream (dark blue circles) of the observed position. Clear blue circles represent 11 of the initial states, from which simulations are started. The ensemble is closed in the sense that in this subspace all directions are fully explored to a point where no acceptable state of the Antarctic Ice Sheet could be simulated. Values of
ESSA>1.0 are excluded for physical reasons (compare Ma et al., 2010).(b)For the three pa-rameter combinations of (FPW,ESSA)=(0.92,0.5); (0.91,0.6); (0.90,0.7), the influence of basal resistance exponent m is tested for 15 km horizontal resolution. Those parameter combinations where significant ice loss (through grounding-line retreat) compared to ALBMAP occurs during spin-up foreitherone of the two regions are excluded from the ensemble (medium red to dark red circles). Crosses indicate ensemble members that exhibit proper grounding-line positions for 15 km horizontal resolution, but not at 12 km. This leaves 11 additional parameter combi-nations arising from sampling the m axis (white and light rose coloring, except for those with
TCD
9, 1705–1733, 2015Comparing ice discharge through
West Antarctic Gateways
M. A. Martin et al.
Title Page
Abstract Introduction
Conclusions References
Tables Figures
◭ ◮
◭ ◮
Back Close
Full Screen / Esc
Printer-friendly Version Interactive Discussion
Discussion
P
a
per
|
Discussion
P
a
per
|
Discussion
P
a
per
|
Discussion
P
a
per
|
TCD
9, 1705–1733, 2015Comparing ice discharge through
West Antarctic Gateways
M. A. Martin et al.
Title Page
Abstract Introduction
Conclusions References
Tables Figures
◭ ◮
◭ ◮
Back Close
Full Screen / Esc
Printer-friendly Version Interactive Discussion
Discussion
P
a
per
|
Discussion
P
a
per
|
Discussion
P
a
per
|
Discussion
P
a
per
![Figure 6. Vertically averaged hardness [Pa s −3 ] for 5 km resolution.](https://thumb-eu.123doks.com/thumbv2/123dok_br/16404408.193871/23.918.101.592.171.451/figure-vertically-averaged-hardness-pa-s-km-resolution.webp)

![Figure 11. Map of H/H f [%] for ALBMAP data for marine Antarctic regions.](https://thumb-eu.123doks.com/thumbv2/123dok_br/16404408.193871/29.918.98.692.76.568/figure-map-of-albmap-data-marine-antarctic-regions.webp)
