TCD
7, 5051–5095, 2013Uncertainties in Arctic sea ice thickness and
volume
M. Zygmuntowska et al.
Title Page
Abstract Introduction
Conclusions References
Tables Figures
◭ ◮
◭ ◮
Back Close
Full Screen / Esc
Printer-friendly Version Interactive Discussion
Discussion
P
a
per
|
D
iscussion
P
a
per
|
Discussion
P
a
per
|
Discuss
ion
P
a
per
|
The Cryosphere Discuss., 7, 5051–5095, 2013 www.the-cryosphere-discuss.net/7/5051/2013/ doi:10.5194/tcd-7-5051-2013
© Author(s) 2013. CC Attribution 3.0 License.
Open Access
The Cryosphere
Discussions
This discussion paper is/has been under review for the journal The Cryosphere (TC). Please refer to the corresponding final paper in TC if available.
Uncertainties in Arctic sea ice thickness
and volume: new estimates and
implications for trends
M. Zygmuntowska1, P. Rampal1, N. Ivanova1, and L. H. Smedsrud2
1
Nansen Environmental and Remote Sensing Center, Bergen, Norway 2
Geophysical Institute, University of Bergen, Norway
Received: 4 September 2013 – Accepted: 13 September 2013 – Published: 11 October 2013
Correspondence to: M. Zygmuntowska ([email protected])
TCD
7, 5051–5095, 2013Uncertainties in Arctic sea ice thickness and
volume
M. Zygmuntowska et al.
Title Page
Abstract Introduction
Conclusions References
Tables Figures
◭ ◮
◭ ◮
Back Close
Full Screen / Esc
Printer-friendly Version Interactive Discussion
Discussion
P
a
per
|
D
iscussion
P
a
per
|
Discussion
P
a
per
|
Discuss
ion
P
a
per
Abstract
Sea ice volume has been found to decrease in the last decades, evoked by changes in sea ice area and thickness. Estimates of sea ice area and thickness rely on a number of geophysical parameters which introduce large uncertainties. To quantify these un-certainties we use freeboard retrievals from ICESat and investigate different
assump-5
tions on snow depth, sea ice density and area. We find that uncertainties in ice area are of minor importance for the estimates of sea ice volume during the cold season in the Arctic basin. The choice of mean ice density used when converting sea ice freeboard into thickness mainly influences the resulting mean sea ice thickness, while snow depth on top of the ice is the main driver for the year-to-year variability,
partic-10
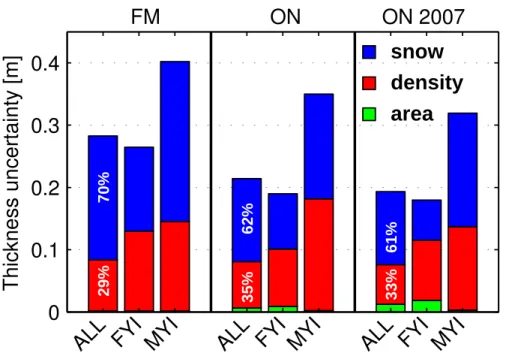
ularly in late winter. The absolute uncertainty in the mean sea ice thickness is 0.28 m in February/March and 0.21 m in October/November. The uncertainty in snow depth contributes up to 70 % of the total uncertainty and the ice density 30–35 %, with higher values in October/November. We find large uncertainties in the total sea ice volume and trend. The mean total sea ice volume is 10 120±1278 km3 in October/November
15
and 13 254±1858 km3 in February/March for the time period 2005–2007. Based on
these uncertainties we obtain trends in sea ice volume of−1445±531 km3a−1in
Oc-tober/November and −875±257 km3a−1 in February/March over the ICESat period
(2003–2008). Our results indicate that, taking into account the uncertainties, the de-cline in sea ice volume in the Arctic between the ICESat (2003–2008) and CryoSat-2
20
(2010–2012) periods may have been less dramatic than reported in previous studies.
1 Introduction
Remotely sensed estimates of sea ice area and thickness reveal a dramatic decline in Arctic sea ice volume in the last decades (Kwok et al., 2009; Laxon et al., 2013). This decline mirrors changes in the Arctic heat budget (e.g. Kurtz et al., 2011; Perovich
TCD
7, 5051–5095, 2013Uncertainties in Arctic sea ice thickness and
volume
M. Zygmuntowska et al.
Title Page
Abstract Introduction
Conclusions References
Tables Figures
◭ ◮
◭ ◮
Back Close
Full Screen / Esc
Printer-friendly Version Interactive Discussion
Discussion
P
a
per
|
D
iscussion
P
a
per
|
Discussion
P
a
per
|
Discuss
ion
P
a
per
|
Aagaard and Carmack, 1989; McPhee et al., 2009). As they are of primary importance for the Arctic (Screen and Simmonds, 2010) and the global climate system (Outten and Esau, 2012) these remotely sensed data have been analysed in many studies. Unfortunately, many of the studies lack a sufficient estimate of uncertainties. We fill this gap and quantify total uncertainties in sea ice thickness and volume in the Arctic basin.
5
We further identify the main factors contributing to the uncertainties, analysing snow depth, sea ice density and area. We provide uncertainties averaged over the Arctic basin and analyse the spatial and seasonal variability.
Arctic sea ice area has been observed from satellites over the last 40 yr starting with the Nimbus 5 electrically scanning microwave radiometer (ESMR) in 1972. A decrease
10
in sea ice area was detected in the early 1990’s (Serreze et al., 1995; Parkinson et al., 1999) and has continued at an increased rate in the last decade (Cavalieri and Parkin-son, 2012). The average difference in annual sea ice area among the most known algorithms can reach up to±1.3 million km2(Ivanova et al., 2013), but it seems difficult to get a grip on which algorithm produces the most correct estimates.
15
Until the 1990s, our knowledge of Arctic sea ice thickness was determined by sparse field campaigns or submarine measurements giving only limited insight into the over-all Arctic sea ice thickness. Based on submarine data from the central Arctic region Rothrock et al. (1999) found a decline in Arctic sea ice draft, the part of the ice below the water level, of 1.3 m from the 1960’s to 1980’s. Over the last decade both laser
20
and radar altimeters have been used to estimate sea ice thickness on a basin wide scale (Laxon et al., 2003; Kwok et al., 2004). Analysing measurements from the laser altimeter on-board ICESat Kwok et al. (2009) found a decline in Arctic sea ice thick-ness of 0.18 m a−1between 2003 and 2008. Spatially the strongest decline was found in the region covered by Multi-Year-Ice between Greenland and the North Pole. These
25
TCD
7, 5051–5095, 2013Uncertainties in Arctic sea ice thickness and
volume
M. Zygmuntowska et al.
Title Page
Abstract Introduction
Conclusions References
Tables Figures
◭ ◮
◭ ◮
Back Close
Full Screen / Esc
Printer-friendly Version Interactive Discussion
Discussion
P
a
per
|
D
iscussion
P
a
per
|
Discussion
P
a
per
|
Discuss
ion
P
a
per
submarines and satellites, Kwok and Rothrock (2009) determined that the Arctic mean ice thickness in October/November declined from 3.02 m in the 1960’s to 1.92 m in the 1990’s, and then to 1.43 m during the ICESat period 2003–2007.
Sea ice thickness is a quantity that cannot be measured directly by satellite based instruments. Altimeters on board satellites measure the elevation of the Earth surface
5
and by identifying leads between the ice floes, the freeboard (the height of the ice above the water level) can be derived. The thickness is calculated by assuming hydrostatic equilibrium and estimating the density of sea ice and snow and the snow depth on top of the ice. These quantities may vary both in space and time and introduce large uncertainties in the sea ice thickness estimates.
10
Decline in sea ice area and thickness results in a reduction of sea ice volume. Based on data from the laser altimeter on board ICESat, Kwok et al. (2009) found a net loss of 5400 km3in October/November and 3500 km3in February/March during the ICESat record from 2003 to 2008. Recent results, exploring new data from the radar altimeter on-board CryoSat-2, report a further decline in Arctic sea ice volume (Laxon et al.,
15
2013). The average sea ice volume in October/November for 2010 and 2011 was esti-mated to be 7560 km3, i.e. 64 % of the 2003–2008 mean value estimated from ICESat (Kwok et al., 2009). For the maximum annual value in February/March, the sea ice volume was estimated to be 14 819 km3, i.e. 91 % of the previous ICESat value (Laxon et al., 2013).
20
To investigate the influence of snow depth, sea ice density, and area on sea ice thick-ness and volume estimates we use freeboard retrievals from ICESat, together with dif-ferent assumptions on snow and ice properties, and sea ice concentration derived from different algorithms. Uncertainties are calculated with a Monte-Carlo-approach based on probability distribution functions for the three parameters. Our approach is diff
er-25
TCD
7, 5051–5095, 2013Uncertainties in Arctic sea ice thickness and
volume
M. Zygmuntowska et al.
Title Page
Abstract Introduction
Conclusions References
Tables Figures
◭ ◮
◭ ◮
Back Close
Full Screen / Esc
Printer-friendly Version Interactive Discussion
Discussion
P
a
per
|
D
iscussion
P
a
per
|
Discussion
P
a
per
|
Discuss
ion
P
a
per
|
depth. In Sect. 3 we describe how sea ice thickness is estimated and provide a descrip-tion of the Monte-Carlo approach used to calculate uncertainties in sea ice thickness and volume. Results on the uncertainties in sea ice thickness and volume are given in Sect. 4 and a detailed discussion, including implications on the trend in sea ice volume, is given in Sect. 5.
5
2 Data
To calculate sea ice thickness and volume, we combine satellite based retrievals of sea ice freeboard, type and area. In this section we will describe the data sets and the processing steps used to derive the necessary parameters for our analysis.
2.1 Sea ice freeboard
10
The starting point of this paper is the ICESat freeboard retrieval. The Geoscience Laser Altimeter System (GLAS) on ICESat is using a 1064 nm laser channel for surface al-timetry, with an expected accuracy of 15 cm. The satellite orbit has an inclination of 94◦ and measurements have a resolution of 60 m across and 170 m along track (Zwally et al., 2002). ICESat was in orbit for almost 6 yr from 2003 to 2009 but was
gener-15
ally operating only for two separated periods each year in February/March and Oc-tober/November. In our study we use the data set from NSIDC (Yi and Zwally, 2009) which is available for the campaigns from October/November 2005 to 2007 (see Table 1 for more information) and provides sea ice freeboard information along track. Further details on the original processing and the freeboard retrieval is provided e.g. in Zwally
20
et al. (2002). The laser measures the top of the snow on the ice, if snow is present, and the freeboard value retrieved is thus the combined value for sea ice and snow.
For comparison we also use the gridded sea ice thickness data set from JPL avail-able at http://rkwok.jpl.nasa.gov/icesat/download.html. A detailed description of this data set can be found in Kwok and Cunningham (2008).
TCD
7, 5051–5095, 2013Uncertainties in Arctic sea ice thickness and
volume
M. Zygmuntowska et al.
Title Page
Abstract Introduction
Conclusions References
Tables Figures
◭ ◮
◭ ◮
Back Close
Full Screen / Esc
Printer-friendly Version Interactive Discussion
Discussion
P
a
per
|
D
iscussion
P
a
per
|
Discussion
P
a
per
|
Discuss
ion
P
a
per
2.2 Sea ice type
Information about sea ice type is derived from QuikSCAT scatterometer data. QuikSCAT provides normalized radar cross section (sigma0) measurements of the Earth’s surface. In this study we use daily averaged gridded QuikSCAT data processed at the Brigham Young University (BYU) for each mid-day of the evaluated periods
5
(ftp://ftp.scp.byu.edu/data/qscat/SigBrw). The small hole around the North Pole (0.5◦N) is filled with a nearest neighbor interpolation. Backscatter is converted into Multi-Year-Ice fraction using the method described in Kwok (2004). This method is based on a re-lationship between the Multi-Year-Ice fraction from high resolution RADARSAT/RGPS images and sigma0 backscatter from QuikSCAT (see Fig. 6 in Kwok, 2004). We
10
checked that our results are consistent with the fields published in Kwok (2004) and Polyakov et al. (2011) for 1 January from 2000 to 2008.
The backscatter from scatterometers is sensitive to the physical properties of sea ice that change after sea ice has survived the melting season. Thus the term MYI, as defined in this study, refers to sea ice that survived one summer, but may actually be
15
younger than one year. However as scatterometers only capture the surface properties, this method does not allow us to account for the part of FYI growing from the bottom during winter freezing, and therefore underestimates the fraction of FYI.
In this study we use two different approaches to define the sea ice type: a fraction of the ice type per pixel, as described above, and a binary classification. To get the
20
binary sea ice classification between First-Year-Ice (FYI) and Multi-Year-Ice (MYI) for each pixel we used a threshold of 50 % for the sea ice type. This binary classification has been used in previous studies, e.g. Kwok et al. (2009).
2.3 Sea ice area
Sea ice area is derived from sea ice concentration estimates based on brightness
tem-25
TCD
7, 5051–5095, 2013Uncertainties in Arctic sea ice thickness and
volume
M. Zygmuntowska et al.
Title Page
Abstract Introduction
Conclusions References
Tables Figures
◭ ◮
◭ ◮
Back Close
Full Screen / Esc
Printer-friendly Version Interactive Discussion
Discussion
P
a
per
|
D
iscussion
P
a
per
|
Discussion
P
a
per
|
Discuss
ion
P
a
per
|
NSIDC (Maslanik and Stroeve, 2004, updated 2012). Various algorithms exist to derive sea ice concentration from this type of measurements. The underlying theory behind the algorithms is that sea ice and open water emit differently across the frequency spectrum. The measured brightness temperatures are therefore a linear combination of these two temperatures, with weights according to the concentration of sea ice and
5
water. Algorithms differ due to the use of different frequencies, tie-points for ice and wa-ter, and are sensitive to changes in the physical temperature of the surface and weather filters (Comiso et al., 1997). Ice concentration products used in this study are based on 11 different algorithms and are listed in Table 2. A detailed comparison of them can be found in Ivanova et al. (2013), where the differences in sea ice concentration, area
10
and extent were quantified and analysed both seasonally and regionally.
2.4 Snow depth
Our knowledge of snow depth on top of Arctic sea ice is limited. Snow depth can be measured directly in the field but these measurements are limited to field campaigns in a local area during a couple of weeks. The most comprehensive compilation of in-situ
15
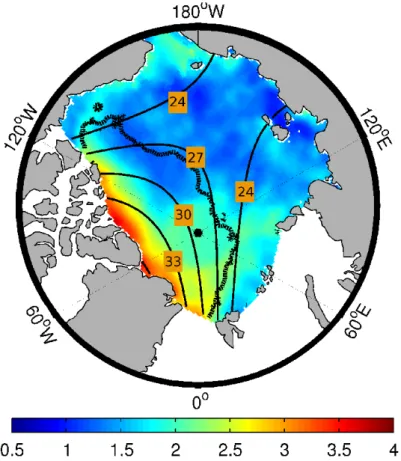
data so far is based on man-made observations taken during soviet drifting stations between 1954 and 1991. Warren et al. (1999, W99 here after) created a climatology of monthly snow depth by fitting a two-dimensional quadratic function for each month independently of the year. The mean winter (October–April) snow depth from W99 is shown in Fig. 1 as thin contour lines. Because MYI was the dominating ice type during
20
those decades, the climatology represents snow depth on MYI.
Another way to obtain information about snow depth on a basin wide scale are re-trievals from passive microwave sensors (Markus and Cavalieri, 1998). In this case snow depth is calculated using the spectral gradient ratio of the 18.7 GHz and 37 GHz vertical polarization channels. In our study we use the data sets based on AMSR-E
25
TCD
7, 5051–5095, 2013Uncertainties in Arctic sea ice thickness and
volume
M. Zygmuntowska et al.
Title Page
Abstract Introduction
Conclusions References
Tables Figures
◭ ◮
◭ ◮
Back Close
Full Screen / Esc
Printer-friendly Version Interactive Discussion
Discussion
P
a
per
|
D
iscussion
P
a
per
|
Discussion
P
a
per
|
Discuss
ion
P
a
per
FYI or MYI it needs further development (Markus et al., 2006; Brucker and Markus, 2013).
In our freeboard estimates we require that the freeboard should always be positive. Negative freeboard, as a result of e.g. ice flooding is common in Antarctica due to the large snow fall in that region (Lytle and Ackley, 2001), but this has not been observed to
5
a large degree in the Arctic. We therefore replaced the snow depth with the freeboard value in the cases where the snow depth was larger than the freeboard.
3 Methods
To combine the data sets we described above, we re-gridded them following a polar stereographic projection on a 25 km grid. For snow depth we used the mean value of
10
the two periods, in fall and late winter (see Table 1) when freeboard measurements were available. For sea ice area we used the mean over the ICESat period and for the MYI fraction the mid-day of each ICESat period. As the export of MYI is only about 10 % each year (Smedsrud et al., 2011) we believe that the change in MYI fraction is slow enough to allow for this simplification.
15
ICESat has an orbit inclination of 94◦, hence for a considerable percentage of the Arctic Ocean, no freeboard measurements are available. To fill this data hole we use the MYI fraction around the hole as a proxy for sea ice thickness. The same method has previously been used by Kwok et al. (2009) and provides a simple way to get an estimate of sea ice thickness and volume on a basin-wide scale. Other data gaps,
20
mostly occurring in the shelf areas, have been filled similarly, using the fraction of MYI in the adjacent pixels.
3.1 Sea ice thickness estimates
TCD
7, 5051–5095, 2013Uncertainties in Arctic sea ice thickness and
volume
M. Zygmuntowska et al.
Title Page
Abstract Introduction
Conclusions References
Tables Figures
◭ ◮
◭ ◮
Back Close
Full Screen / Esc
Printer-friendly Version Interactive Discussion
Discussion
P
a
per
|
D
iscussion
P
a
per
|
Discussion
P
a
per
|
Discuss
ion
P
a
per
|
hydrostatic equilibrium, which results in the following equation for the sea ice thickness (SIT):
SIT=fis· ρw ρw−ρi−
hs·
ρw−ρs ρw−ρi
(1)
where fis is the snow-ice freeboard as retrieved from ICESat, hs is the snow depth, andρw,ρs, andρiare the densities of water, snow and ice, respectively. The thickness
5
depends on the measured freeboard, and the snow and sea ice properties. Forρwwe use a value of 1024 kg m−3and forρs270 kg m−
3
in October/November and 330 kg m−3 in February/March, following Warren et al. (1999). To investigate the influence ofρiand
hson sea ice thickness estimates on a basin-wide scale we analyse a number of data sets for these two parameters as described below in Sects. 3.2 and 3.3.
10
Equation (1) describes the “true” sea ice thickness, which is the averaged thickness of the ice in a certain area. An observer on the ice would think this is the most mean-ingful value of ice thickness. We also analyse the effective sea ice thickness, which is defined as the mean sea ice thickness including open water areas. We use the sea ice concentration to account for the open water in each pixel and compute the effective
15
sea ice thickness as following:
SITeff=SIT·SIC [0, 1] (2)
where SITeffis the effective sea ice thickness, SIT is the sea ice thickness as described in Eq. (1), and SIC is the sea ice concentration. This is the most common diagnostic in current sea ice models in which sea ice mainly grows thermodynamically and rather
20
homogeneously over a grid cell.
3.2 Sea ice density – selecting values
TCD
7, 5051–5095, 2013Uncertainties in Arctic sea ice thickness and
volume
M. Zygmuntowska et al.
Title Page
Abstract Introduction
Conclusions References
Tables Figures
◭ ◮
◭ ◮
Back Close
Full Screen / Esc
Printer-friendly Version Interactive Discussion
Discussion
P
a
per
|
D
iscussion
P
a
per
|
Discussion
P
a
per
|
Discuss
ion
P
a
per
no salt is expected to have a density of 916 kg m−3. Newly frozen FYI, however, con-tains a substantial amount of salt water that increases the sea ice density. Concen-trated sea water with a salinity higher than 35 is termed brine, and brine salinities can reach values up to 100 depending on the sea ice temperature. In course of time the brine drains out and is replaced by air. Density of MYI is thus expected to be lower
5
than that of FYI, in particular in the freeboard part above water level, and values vary largely among sources (e.g Timco and Frederking, 1996; Kovacs, 1996; Alexandrov et al., 2010; Forström et al., 2011). To investigate and visualize the influence of sea ice density on sea ice thickness we explored different values ranging from 882 kg m−3 to
925 kg m−3 (see Table 3). We first assumed the sea ice density to be the same over
10
the entire Arctic (D1–D4), and second we varied the sea ice density dependent on ice type (D5 and D6). For the second approach, we chose the ice type either by a binary classification (D5) or by accounting for the fraction of MYI per pixel (D6).
3.3 Snow depth – selecting values
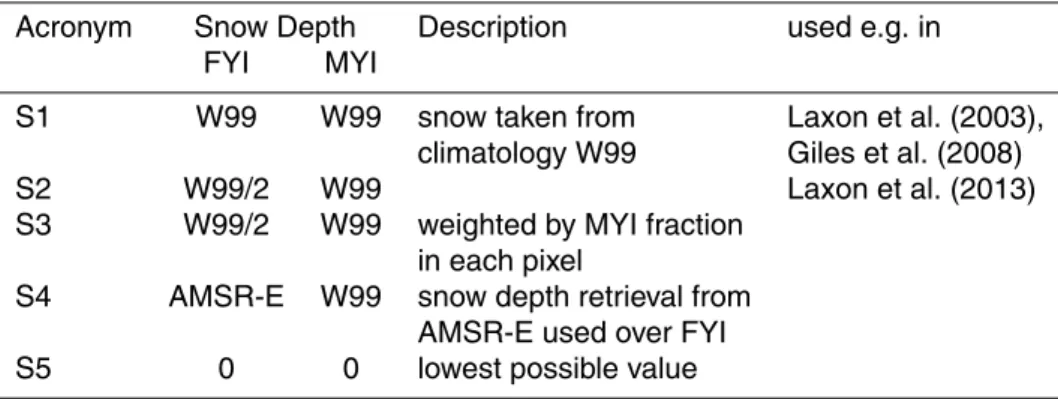
To assess the influence of snow depth on sea ice thickness estimates we used the
15
snow depth retrieval from AMSR-E, and the W99 climatology. Additionally we used a modification of W99 based on results from airborne measurements of snow depth. Evaluating snow depth data from the Operation IceBridge campaigns, Kurtz and Farrell (2011) found that snow load is reduced by 50 % over FYI compared to climatological values of W99. An overview of our selected values is presented in Table 4. As for the
20
ice density we either used the same assumption over FYI and MYI (S1 and S5) or used different assumptions for the two ice types (S2–S4). Snow depth weighted by MYI fraction (S3) has been calculated as follows:
Hs=W99·(0.5+0.5·MYIfraction) (3)
where W99 is snow depth based on climatological values from Warren et al. (1999).
TCD
7, 5051–5095, 2013Uncertainties in Arctic sea ice thickness and
volume
M. Zygmuntowska et al.
Title Page
Abstract Introduction
Conclusions References
Tables Figures
◭ ◮
◭ ◮
Back Close
Full Screen / Esc
Printer-friendly Version Interactive Discussion
Discussion
P
a
per
|
D
iscussion
P
a
per
|
Discussion
P
a
per
|
Discuss
ion
P
a
per
|
different from our approach. Therefore the pixels considered as FYI are slightly different than based on the MYI fraction derived from QuikSCAT.
3.4 Monte-Carlo approach to calculate uncertainty
The uncertainties of sea ice volume and thickness are calculated using a Monte-Carlo approach. This is a probabilistic method based on repeated calculations of the results,
5
using input variables changed by a random selection from their probability distributions. In our study the result is the effective sea ice thickness (or sea ice volume) and the input variables are sea ice area, density and snow depth. To calculate the uncertainty coming from a single parameter we varied this parameter and kept the other two fixed at the mean value of their respective PDFs. The assumed probability distributions of mean
10
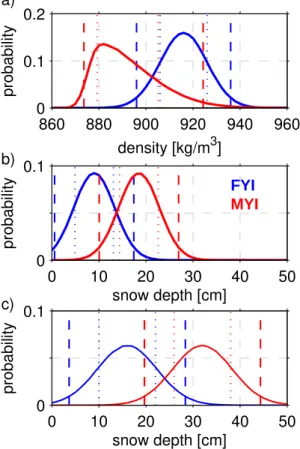
sea ice density and mean snow depth are shown in Fig. 2. For the sea ice area we assumed each of the eleven algorithms to be equally likely (PDF not shown).
The distribution of snow depth follows the W99 climatology over MYI and is reduced by 50 % over FYI. For the standard deviation of the distributions we use the reported inter-annual variability from the W99 climatology, of i.e. 4.3 cm in October/November
15
and 6.2 cm in February/March. This is consistent with uncertainties found for the AMSR-E retrieval (Brucker and Markus, 2013), so we believe that our assumptions are still conservative. In Fig. 2 we show separate distributions for MYI and FYI for visu-alization, but in reality the correlation between snow depth on FYI and MYI has to be considered. For each Monte-Carlo calculation we therefore picked one random value
20
from the MYI distribution and took half of this value for the FYI. For the campaign in spring 2007 we used a PDF which was one centimeter higher then shown in Fig. 2, because the campaign took place in March/April.
For the distribution of sea ice density we also assumed different values for FYI and MYI. For FYI we assumed a mean value of 916 kg m−3 and a standard deviation of
25
±10 kg m−3 which is smaller than reported in other studies (Alexandrov et al., 2010;
TCD
7, 5051–5095, 2013Uncertainties in Arctic sea ice thickness and
volume
M. Zygmuntowska et al.
Title Page
Abstract Introduction
Conclusions References
Tables Figures
◭ ◮
◭ ◮
Back Close
Full Screen / Esc
Printer-friendly Version Interactive Discussion
Discussion
P
a
per
|
D
iscussion
P
a
per
|
Discussion
P
a
per
|
Discuss
ion
P
a
per
based on field observations from a local area and a given time. For the MYI density we assume a slightly skewed distribution as MYI generally includes areas of FYI, both from bottom freezing and refrozen leads, and literature values vary widely among sources. The mode of the density distribution is 882 kg m−3, while the mean is slightly higher, i.e. 990 kg m−3.
5
The analysis of the freeboard retrieval itself and its associated uncertainties were described in a clear and concise manner by Zwally et al. (2002) and Kwok et al. (2007) and is behind the scope of this study. For our results we focus on how snow depth, sea ice density and area influence sea ice thickness estimates, and we consequently pro-duce results as for example 2.2±0.3 m. We will term the±0.3 m the sea ice thickness
10
“uncertainty”. We will not use the word “error”, because that term refers particularly to instrumental error, as for example, in the freeboard retrieval itself. In this way the word “uncertainty” covers the “geophysical assumptions” of the sea ice thickness esti-mate. This is also true when it comes to “thickness uncertainty” stemming from the sea ice area estimates from the different algorithms. These differences also have a
“geo-15
physical” explanation in the way the algorithms treat thin sea ice, melt ponds, snow properties and the atmosphere.
4 Results
In this section we first illustrate the influence of selected values for density and snow depth on the sea ice thickness estimates. We further show uncertainties in effective
20
TCD
7, 5051–5095, 2013Uncertainties in Arctic sea ice thickness and
volume
M. Zygmuntowska et al.
Title Page
Abstract Introduction
Conclusions References
Tables Figures
◭ ◮
◭ ◮
Back Close
Full Screen / Esc
Printer-friendly Version Interactive Discussion
Discussion
P
a
per
|
D
iscussion
P
a
per
|
Discussion
P
a
per
|
Discuss
ion
P
a
per
|
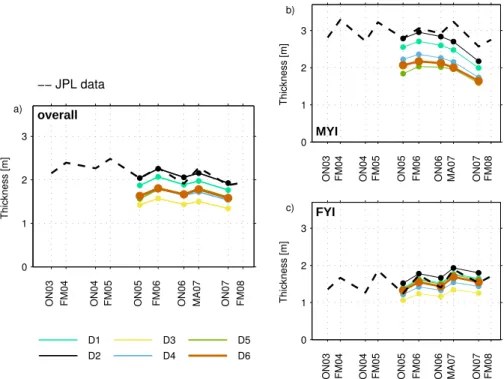
4.1 Sea ice density influence on sea ice thickness
Mean sea ice thickness calculated over the whole Arctic basin using different assump-tions on sea ice density is shown in Fig. 3. The assumpassump-tions are listed in Table 3. The same snow depth was used for all calculations, and corresponds to climatological val-ues from W99 over MYI, and half of the valval-ues over FYI weighted by MYI fraction per
5
pixel (S3 in Table 4).
We show that the mean sea ice thickness is strongly influenced by the choice of sea ice density, while the trend and the annual cycle are hardly affected. The resulting mean values in October/November range between 1.39 m and 2.00 m. At the end of winter, in February/March sea ice thickness has increased and ranges between 1.53 m and
10
2.20 m. Because the influence of sea ice density increases with sea ice thickness, we found the range to be smaller for FYI (about 55 cm), and larger for MYI (about 80 cm). The sub-grid scale variability of sea ice density due to sea ice type only influences the mean sea ice thickness by a few centimeters, and the difference between D5 and D6 in Fig. 3 is too small to be visible. The trend in FYI and MYI thickness is diametric:
15
While thickness of MYI is decreasing over the period (Fig. 3b) the thickness of FYI is increasing (Fig. 3c). A number of processes could contribute to such an increase in thickness and we will come back to these in the discussion section.
From October/November to February/March the FYI thickness increases by about 0.25 m, representing “normal winter growth” over areas that were open water in
20
the beginning of the freezing season. However it is surprising and rather counter-intuitive to see that the mean thickness of MYI does not increase between Octo-ber/November 2006 and February/March 2007 (Fig. 3b). To get more insight into this peculiarity and the inter-annual variability we proceed with analyzing the impact of snow depth on the mean sea ice thickness estimates.
TCD
7, 5051–5095, 2013Uncertainties in Arctic sea ice thickness and
volume
M. Zygmuntowska et al.
Title Page
Abstract Introduction
Conclusions References
Tables Figures
◭ ◮
◭ ◮
Back Close
Full Screen / Esc
Printer-friendly Version Interactive Discussion
Discussion
P
a
per
|
D
iscussion
P
a
per
|
Discussion
P
a
per
|
Discuss
ion
P
a
per
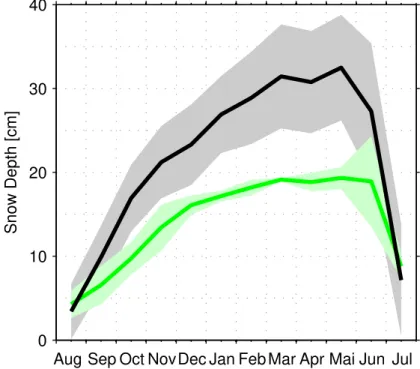
4.2 Snow depth estimates over Arctic sea ice
Figure 4 compares the climatology from W99 representing snow depth on MYI, and the snow depth retrieval from AMSR-E over FYI. Based on the W99 climatology the mean snow depth on the Arctic sea ice increases from near zero in August to a maximum in spring. The accumulation rate is as high as 5 cm month−1 from August to January,
5
before lowering to about 2 cm month−1 until March. The snow increases somewhat further until May, before solar radiation is strong enough to melt the snow in June and July. At the end of summer only a few cm of snow are left. The inter-annual variability in the W99 climatology ranges from 3–8 cm, and is largest in the winter period.
Based on the AMSR-E snow depth retrieval the snow accumulation over the winter
10
season has a similar shape, with a maximum in late winter in phase with the W99 climatology. The accumulation rate, however, is much lower and the maximum value of about 19 cm is only 54 % of the climatological value from W99. One can speculate that this is not only a result of snow falling into water, but is additionally caused by changed atmospheric conditions. These might also have influenced the snow depth on MYI and
15
can explain some of peculiarities mentioned in the previous section.
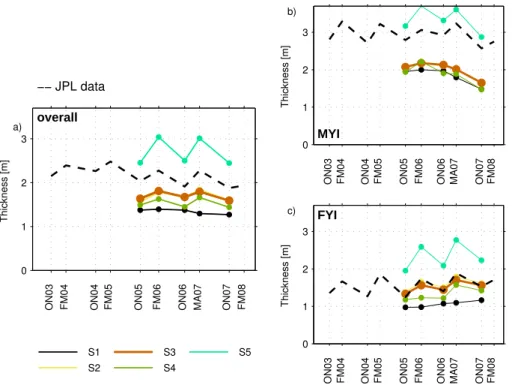
4.3 Snow depth influence on sea ice thickness
Mean sea ice thickness calculated from ICESats’ freeboard observations over the whole Arctic ocean using different assumptions on snow depth is shown in Fig. 5. The different assumptions are given in Table 4. For sea ice density we used the
ice-type-20
dependent method (D6 in Table 3) weighted by MYI fraction per pixel.
Mean sea ice thickness in October/November ranges between 1.28 m and 2.45 m, but goes down to 1.62 m if we exclude the “no snow” assumption, which is unrealistic but still considered as a reference. In February/March the mean sea ice thickness ranges between 1.33 m and 3.00 m, or 1.79 m if the no-snow assumption is left out.
25
TCD
7, 5051–5095, 2013Uncertainties in Arctic sea ice thickness and
volume
M. Zygmuntowska et al.
Title Page
Abstract Introduction
Conclusions References
Tables Figures
◭ ◮
◭ ◮
Back Close
Full Screen / Esc
Printer-friendly Version Interactive Discussion
Discussion
P
a
per
|
D
iscussion
P
a
per
|
Discussion
P
a
per
|
Discuss
ion
P
a
per
|
cm only (compare S2 and S3 in Fig. 5), which is similar to the results found for the sub-grid scale variability of ice density (Fig. 3).
Using climatological snow depth from W99 for FYI we found no increase in sea ice thickness in the winter season (S1 in Fig. 5). This is a counter intuitive and an unre-alistic result, indicating that the W99 snow depth needs revision, as sea ice is indeed
5
expected to increase in thickness during an Arctic winter. Reducing the climatological values from W99 by half or using available passive microwave retrievals from AMSR-E over FYI results in a increase of winter growth to about 40 cm (S2–S4 in Fig. 5).
For MYI we can only use the W99 climatology for snow depth as no other data sets are available. The resulting spread in Fig. 5b is due to the different MYI classifications
10
in the retrievals. The absence of MYI thickening between October/November 2006 and February/March 2007 (Fig. 3b), that we mentioned in the previous section could thus be explained by an overestimation of snow depth in February/March, which results in an underestimation of sea ice thickness.
4.4 Spatial distribution and absolute uncertainties
15
So far we have shown the range of spatially averaged sea ice thickness estimates over the Arctic Ocean as the results of different selected values for sea ice density and snow depth. To get more insight into how the uncertainties in ice density, snow depth and sea ice area contribute quantitatively to the total uncertainty in the sea ice thickness estimates, we introduce results from the Monte-Carlo approach. As the sea
20
ice area is considered now, the results represent uncertainties in the effective sea ice thickness. The single uncertainties are calculated keeping two of the parameters fixed at the mean values, while varying the third according to the PDFs shown in Fig. 2. We used the MYI fraction in each pixel when calculating the ice type dependent values for sea ice density and snow depth (see Eq. 3).
25
TCD
7, 5051–5095, 2013Uncertainties in Arctic sea ice thickness and
volume
M. Zygmuntowska et al.
Title Page
Abstract Introduction
Conclusions References
Tables Figures
◭ ◮
◭ ◮
Back Close
Full Screen / Esc
Printer-friendly Version Interactive Discussion
Discussion
P
a
per
|
D
iscussion
P
a
per
|
Discussion
P
a
per
|
Discuss
ion
P
a
per
February/March (±0.28 m), and we found snow depth to be the largest contributor to
the total uncertainties with up to 70 %. Ice density contributes with 30–35 % with higher values in October/November due to the small snow cover at that time of year. The area contribution also increase in October/November but remains below 10 %.
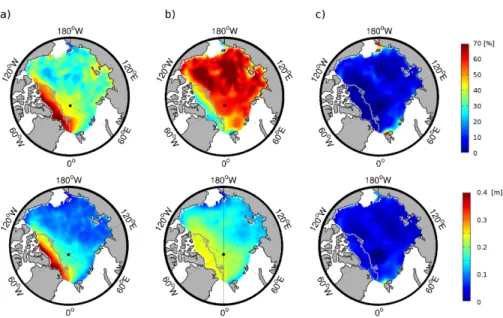
The spatial distributions of these uncertainties in absolute values and their relative
5
contribution to the total uncertainties are shown in the maps of Fig. 7. We show only results for October/November but the spatial distribution of uncertainties are very simi-lar in winter. Overall, the absolute uncertainty resulting from sea ice density is around 0.1 m to 0.2 m for FYI, with uncertainties increasing for the thicker sea ice between the North Pole and Greenland (Fig. 7a). The transition from FYI to MYI also marks the
tran-10
sition from the smaller to the larger uncertainties, stemming from the larger uncertainty in density for MYI that we assumed in our analysis (see Fig. 2). For MYI the uncertain-ties in the sea ice thickness estimates resulting from sea ice density are therefore up to 70 %, while over FYI its relative contribution remains mostly below 40 %.
The absolute uncertainties resulting from uncertainties in snow depth show a similar
15
pattern, with smaller values for thin FYI (from 0.1 m) and increasing for the thicker part between the North Pole and Greenland to 0.25 m. The relative contribution from uncertainties in snow depth accounts for only about 40 % of the total uncertainty for the MYI but up to more than 70 % for FYI.
Uncertainty in effective sea sea thickness resulting from the different sea ice area
20
algorithms is less than 5 % or 10 cm (Fig. 7c). This is caused by the high ice concentra-tions inside our selected Arctic Ocean area of interest (Fig. 1). When ice concentraconcentra-tions approach 100 %, there is little difference between the algorithms, and the related un-certainties become small. Some larger values are visible in Fig. 7c in the marginal ice zone north of Svalbard and in the vicinity of the Bering Strait. In these locations the
25
TCD
7, 5051–5095, 2013Uncertainties in Arctic sea ice thickness and
volume
M. Zygmuntowska et al.
Title Page
Abstract Introduction
Conclusions References
Tables Figures
◭ ◮
◭ ◮
Back Close
Full Screen / Esc
Printer-friendly Version Interactive Discussion
Discussion
P
a
per
|
D
iscussion
P
a
per
|
Discussion
P
a
per
|
Discuss
ion
P
a
per
|
4.5 Sea ice volume uncertainties
The evolution of sea ice volume over time and the related uncertainties calculated using a Monte-Carlo approach are shown in Fig. 8. We estimate the mean Arctic sea ice volume between 2005 and 2007 to be 10 120±1278 km3in October/November, and
to increase to 13 254±1858 km3in February/March (see green curve in Fig. 8).
5
The ice volume in October/November 2007 stands out as a major anomaly, follow-ing the steady reduction in MYI for the length of our record, and a large decrease in FYI volume since February/March 2007. The loss of FYI ice volume from Febru-ary/March 2007 to October/November is more than 50 % or about 4700 km3. This is especially remarkable as FYI volume actually increased from October/November 2005
10
until February/March 2007. In October/November 2005 MYI was the dominant ice type, but has lost almost 50 %, or∼3000 km3 of its volume until 2007. Because of this
de-crease, relative uncertainties in sea ice volume are increasing, and exceed 30 % at the end of the analysis period.
Absolute uncertainties and the relative contributions arising from uncertainties in sea
15
ice density, snow depth and sea ice area are shown in Fig. 9. In February/March 73 % of the uncertainty is caused by uncertainties in snow depth. The snow contribution reduces to 55 % in October/November because of the thinner snow cover during this time of the year, similar to the absolute uncertainties for thickness (Fig. 6). Density thus plays a larger role during October/November but remains smaller than uncertainties
20
TCD
7, 5051–5095, 2013Uncertainties in Arctic sea ice thickness and
volume
M. Zygmuntowska et al.
Title Page
Abstract Introduction
Conclusions References
Tables Figures
◭ ◮
◭ ◮
Back Close
Full Screen / Esc
Printer-friendly Version Interactive Discussion
Discussion
P
a
per
|
D
iscussion
P
a
per
|
Discussion
P
a
per
|
Discuss
ion
P
a
per
5 Discussion
We have calculated uncertainties in the estimates of Arctic sea ice thickness and vol-ume. The uncertainties represented in this study arise from three different parameters that are set up when estimating sea ice thickness and volume: sea ice density, snow depth and sea ice area. Below we will first discuss the findings for sea ice thickness
5
and its uncertainties and then discuss our results for sea ice volume, its uncertainties, and implications for its recent trend.
5.1 Sea ice thickness
We found that the choice of sea ice density significantly changes the estimated mean sea ice thickness. Our mean sea ice thickness ranges from 1.45 m to 2.09 m using
10
a range for sea ice density in accordance with the values seen in the literature. While the density affects the mean sea ice thickness, the snow depth affects its annual cycle and the inter-annual variability. The W99 snow depth climatology results in a under-estimation of winter growth and indicates that the climatology is outdated, also over MYI.
15
The range of densities we used captures the real ice density, but it remains an unre-solved issue whether the density has changed, or will be changing, due to a change in sea ice type over the Arctic Ocean, or due to changing weather conditions like warm-ing temperatures and later ocean freeze-up. The snow depth has already been affected by these changing weather conditions (Hezel et al., 2012; Kurtz et al., 2011), and our
20
study confirms that the climatological values from W99 do not represent the current snow conditions over the Arctic sea ice.
Absolute changes in snow depth do not have to be considered solely, but to de-rive accurate estimates for sea ice thickness, it is additionally important to capture its inter-annual variability. Passive microwave retrievals seem to be reliable over smooth
25
TCD
7, 5051–5095, 2013Uncertainties in Arctic sea ice thickness and
volume
M. Zygmuntowska et al.
Title Page
Abstract Introduction
Conclusions References
Tables Figures
◭ ◮
◭ ◮
Back Close
Full Screen / Esc
Printer-friendly Version Interactive Discussion
Discussion
P
a
per
|
D
iscussion
P
a
per
|
Discussion
P
a
per
|
Discuss
ion
P
a
per
|
tion (Rampal et al., 2009), so the retrievals may actually become less accurate in the future. Over MYI, the lack of more recent and accurate snow depth retrievals remains an issue, and explains why we have used the climatological values from W99 for this ice type in all our analysis. Recently, a new snow depth algorithm for thick ice has been developed (Maaß et al., 2013), based on brightness temperatures from the longwave
5
passive microwave radiometer on-board SMOS. The algorithm requires more valida-tion, but first results show very good agreement with airborne campaigns. The second way to retrieve information about snow depth on Arctic sea ice is to combine precipita-tion from atmospheric reanalysis and ice drift data from satellite products (used in e.g Kwok and Cunningham, 2008; Kurtz et al., 2011). The accuracy of the reanalysis data
10
depends on the model set up and the data assimilation method which is not always reliable over the Arctic ocean (Screen and Simmonds, 2011) and also varies signifi-cantly between different data sources (Bitz and Fu, 2008). Our results show that snow significantly affects the sea ice thickness estimates and an accurate method to retrieve snow depth will be essential to derive absolute values and trends in sea ice thickness
15
in the future.
Using the Monte-Carlo approach we estimate the mean absolute uncertainty of ef-fective sea ice thickness to be ±0.21 m in October/November and ±0.28 m in
Febru-ary/March. These values are lower than previously found uncertainties in sea ice thick-ness derived from laser altimetry: Kwok et al. (2009) reported an uncertainty of 0.5 m,
20
Giles et al. (2007) 0.76 m and Forström et al. (2011) 0.93 m. Our value however should be understood as an uncertainty on the mean sea ice thickness, while the uncertainties in the mentioned studies are rather uncertainties per measurement or pixel. Addition-ally, we did not include errors in measured sea ice freeboard, but this can only explain a difference of a few centimeters.
25
TCD
7, 5051–5095, 2013Uncertainties in Arctic sea ice thickness and
volume
M. Zygmuntowska et al.
Title Page
Abstract Introduction
Conclusions References
Tables Figures
◭ ◮
◭ ◮
Back Close
Full Screen / Esc
Printer-friendly Version Interactive Discussion
Discussion
P
a
per
|
D
iscussion
P
a
per
|
Discussion
P
a
per
|
Discuss
ion
P
a
per
0.26 m in fall and 0.1 m in spring. In spring this bias is within the range of our uncer-tainties while in fall it is slightly larger than unceruncer-tainties found in our study.
Our analysis provides some possible explanation for the discrepancies found be-tween the sea ice thickness estimates from ICESat and PIOMAS. Schweiger et al. (2011) found a larger difference between the two data sets north of Greenland and
5
the Canadian Archipelago than in other areas, with ICESat giving values around 0.7 m larger than results from PIOMAS. As estimates from PIOMAS agree better with in-situ data in this area, they hypothesized that ICESat retrievals may overestimate the sea ice thickness in this area of the Arctic ocean. A part of this discrepancy could be ex-plained by the choice of sea ice density. In the data set from JPL the sea ice density
10
is chosen to be 925 kg m−3
and reducing it to 882 kg m−3
lowers the sea ice thickness about 0.5 m (see Fig. 3). This explanation is supported by the apparently lower diff er-ence between sea ice thickness estimates from PIOMAS and CryoSat-2 (Laxon et al., 2013), where the reduced value for sea ice density has been used to convert freeboard into thickness. More comparison, however, is needed for verification.
15
5.2 Sea ice volume
We calculated the sea ice volume for the three years between 2005 and 2007 with a Monte-Carlo approach using probability distribution functions for sea ice density, snow depth and area as described in Sect. 3.4. We estimate a mean sea ice volume of 10 120±1278 km3 (12.7 %) in October/November, increasing to 13 254±1858 km3
20
(14 %) in February/March. In February/March snow depth accounts for more than 70 % of the uncertainty. In October/November, when snow depth is lower, the density be-comes more important and accounts for 43 % of the total uncertainty.
These large uncertainties resulting from sea ice density can be illustrated using the selected values for the density as described in Sect. 3.2. Using a sea ice density of
25
TCD
7, 5051–5095, 2013Uncertainties in Arctic sea ice thickness and
volume
M. Zygmuntowska et al.
Title Page
Abstract Introduction
Conclusions References
Tables Figures
◭ ◮
◭ ◮
Back Close
Full Screen / Esc
Printer-friendly Version Interactive Discussion
Discussion
P
a
per
|
D
iscussion
P
a
per
|
Discussion
P
a
per
|
Discuss
ion
P
a
per
|
produces a sea ice volume about 5 % smaller than our Monte-Carlo based volume estimates (see green dotted line in Fig. 8 and line 4 in Table 5).
ICESat data have been freely available and have therefore been analyzed in many studies (e.g. Spreen et al., 2006; Kwok and Cunningham, 2008; Farrell et al., 2009; Kurtz et al., 2011; Schweiger et al., 2011). Only a minority of them, however, conducted
5
detailed calculations of uncertainties and errors. A detailed but completely different approach to calculate the uncertainty in sea ice volume based on ICESat data was used by Kwok et al. (2009). The uncertainty was calculated as the sum of uncorrelated errors for each pixel:σT=N1/2(A2cσ
2 h+h
2 σA2
c)
1/2
, whereσhandσA
care the uncertainties
in cell thickness (h) and cell area (Ac),σT uncertainties in total thickness, and N the
10
number of grid cells. Assuming an error of 0.5 m for sea ice thickness, the resulting sea ice volume uncertainty in this study was given as 33 km3. This approach is valid for uncertainties in sea ice thickness stemming from sea ice freeboard observation which are to a large extent uncorrelated. In our analysis we did not account for the errors in the instrumental freeboard observations, but uncertainties resulting from mean snow
15
depth, sea ice density and area. These geophysical uncertainties should be understood more as a bias - not as uncorrelated errors. This also explains why our ice volume uncertainty becomes as high as±1858 km3in February/March, a value 56 times higher
than the uncertainty calculated by Kwok et al. (2009).
A bias in sea ice thickness as measure of uncertainty that propagates in the
esti-20
mates of uncertainty in sea ice volume has been previously used to assess uncertain-ties in modeled Arctic sea ice volume with PIOMAS (Schweiger et al., 2011). This is comparable to the uncertainties in our studies, and the resulting uncertainties in sea ice volume of 6.3 % in spring and 10 % in fall are of the same order (14 % and 12.7 % in our study for the two season, respectively). While Schweiger et al. (2011) used the
dif-25
TCD
7, 5051–5095, 2013Uncertainties in Arctic sea ice thickness and
volume
M. Zygmuntowska et al.
Title Page
Abstract Introduction
Conclusions References
Tables Figures
◭ ◮
◭ ◮
Back Close
Full Screen / Esc
Printer-friendly Version Interactive Discussion
Discussion
P
a
per
|
D
iscussion
P
a
per
|
Discussion
P
a
per
|
Discuss
ion
P
a
per
5.3 Implications for trends in sea ice volume
The calculated uncertainties have implications on trends in sea ice volume. Our time series of ICESats’ freeboard measurements from NSIDC is rather short, ranging from 2005 to 2007, which is admittedly too short to allow for robust calculations of trends. We therefore applied our calculated uncertainties of 12.7 % in February/March and
5
14 % in October/November to the longer time series processed at JPL (Kwok and Cunningham, 2008). Using a weighted regression (weighted by 1 std−2) we obtain
a trend of−1445±531 km3a−1in October/November and−875±257 km3a−1in
Febru-ary/March. The calculated trends are close to previous findings from Kwok et al. (2009) of −1237 km3a−1 in October/November and −862 km3a−1 and February/March,
re-10
spectively.
ICESat operated until 2008, and efforts to produce long-term trends by merging ICESat data with recent CryoSat-2 data is ongoing. Laxon et al. (2013) produced the first estimates and concluded on a loss of ice volume in October/November of 4291 km3between the mean of the ICESat period (2003–2008) and the CryoSat-2
pe-15
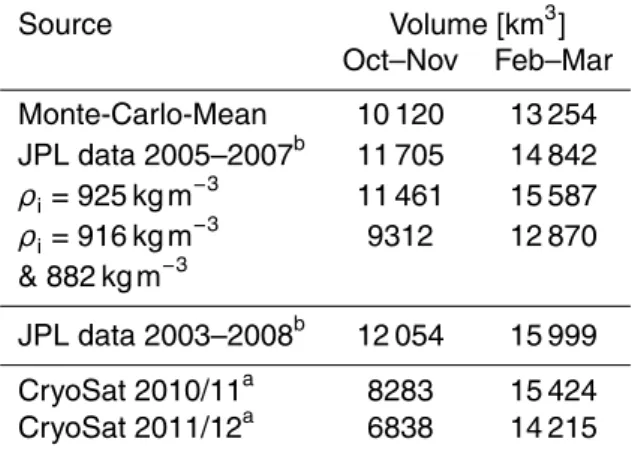
riod (2010–2012), which is a loss of about 36 %. In February/March they estimated a smaller loss of about 1479 km3. In Table 5 we compare our results to the ICESat values from JPL (Kwok and Cunningham, 2008) and CryoSat-2 values from Laxon et al. (2013) illustrating the importance of the density estimate. Despite a consistent long-term change between ICESat and CryoSat-2 there are also differences that can
20
be elucidated by our new results on uncertainties. The main difference is the high den-sity of 925 kg m−3in the JPL dataset used when converting freeboard measurements to thickness, compared to the values of 882 kg m−3 and 916 kg m−3 used by Laxon et al. (2013) for CryoSat-2. Adjusting the values for sea ice density in the ICESat pe-riod accordingly (see Table 5) allows for a more consistent comparison between the
25
TCD
7, 5051–5095, 2013Uncertainties in Arctic sea ice thickness and
volume
M. Zygmuntowska et al.
Title Page
Abstract Introduction
Conclusions References
Tables Figures
◭ ◮
◭ ◮
Back Close
Full Screen / Esc
Printer-friendly Version Interactive Discussion
Discussion
P
a
per
|
D
iscussion
P
a
per
|
Discussion
P
a
per
|
Discuss
ion
P
a
per
|
the Arctic ice volume has even increased from the end of the considered ICESat period 2007 up to March 2011.
The low loss, and in particular the increase, of sea ice volume between the ICESat and CryoSat-2 period is an interesting and somewhat surprising result, raising ques-tions about the accuracy of our methods. Indeed, the increase in February/March may
5
partly be an artifact due to the snow depth assumed and the differences in the mea-surement techniques. The ice freeboard from ICESat is measured using a laser whose signal is reflected from the snow–air interface, while the radar signal from CryoSat-2 is assumed to be reflected from the snow–ice interface. Hence for ICESat data, more snow results in thinner sea ice, while for CryoSat-2 more snow results in thicker sea
10
ice estimate. As stated above, the W99 climatology is overestimating the snow depth on Arctic sea ice, not only over FYI (as previously found by Kurtz and Farrell, 2011) but also over MYI. Therefore our estimates of ice thickness and volume from ICESat might be too low and estimates based on CryoSat-2 too high, which could artificially lead to the low loss, or increase, of ice volume between the two periods.
15
On the other hand, the moderate ice loss as found in this study in fall is consistent with synoptic airborne measurements during summer showing little change in sea ice thickness (Haas et al., 2010) and with satellite based retrievals showing a slight recov-ery of MYI fraction from 2008 till 2010 (Stroeve et al., 2012). On year-to-year timescales a temporal recovery of Arctic sea ice is indeed possible given e.g. an effective loss of
20
insulation caused by the autumn snow ending in the ocean and not on the sea ice (Notz, 2009; Tietsche et al., 2011).
In this study we are not able to perform a detailed calculation of uncertainties for the CryoSat-2 data as, so far, no freeboard data is available. Previous studies show that uncertainties in snow depth influence the sea ice thickness estimates to a much
25
TCD
7, 5051–5095, 2013Uncertainties in Arctic sea ice thickness and
volume
M. Zygmuntowska et al.
Title Page
Abstract Introduction
Conclusions References
Tables Figures
◭ ◮
◭ ◮
Back Close
Full Screen / Esc
Printer-friendly Version Interactive Discussion
Discussion
P
a
per
|
D
iscussion
P
a
per
|
Discussion
P
a
per
|
Discuss
ion
P
a
per
To get more robust results on long term trends, further evaluation of the radar altime-ter on board CryoSat-2 is needed, and more reliable estimates of sea ice density and snow depth on the Arctic sea ice are necessary. Our results indicate a less dramatic decline of Arctic sea ice volume than reported in previous studies, but it is not possible to draw quantitative conclusions about changes in sea ice volume between the ICESat
5
period (2003–2008) and the CryoSat-2 (2010–2012) period.
6 Conclusions
Remotely sensed observations of Arctic sea ice thickness and volume are available for the last decade. In accordance with documented loss of sea ice area over the last 30 yr, available studies point to a dramatic loss of sea ice volume. We have shown here that
10
such estimates of Arctic sea ice volume rest on a number of geophysical parameters that have influence on the overall mean, the year-to-year variability, and the trends. The overall uncertainties appear larger than previous studies suggest, and the dramatic ice loss appears smaller.
Despite the large number of algorithms available, and the associated uncertainties of
15
∼1.3 million km2, uncertainties in area do not carry on to the sea ice volume estimates
in cold seasons. They become important when concentrations are well below 100 %, like in the marginal ice zone, and may therefore become more important in the future caused by the ongoing sea ice retreat in the Arctic.
The choice of the mean density to be used when converting ICESat derived
free-20
board measurements to sea ice thickness has a major influence on the resulting mean thickness, but does not alter the year-to-year variability. To obtain accurate estimates of changes in sea ice volume and thickness in the future, the change from mainly Multi-Year-Ice to First-Multi-Year-Ice and the corresponding changes in sea ice density also has to be considered.
25
TCD
7, 5051–5095, 2013Uncertainties in Arctic sea ice thickness and
volume
M. Zygmuntowska et al.
Title Page
Abstract Introduction
Conclusions References
Tables Figures
◭ ◮
◭ ◮
Back Close
Full Screen / Esc
Printer-friendly Version Interactive Discussion
Discussion
P
a
per
|
D
iscussion
P
a
per
|
Discussion
P
a
per
|
Discuss
ion
P
a
per
|
indicate that climatological values from Warren et al. (1999) not only overestimate the snow load on First-Year-Ice compared to the present day climate, but also give incorrect values for Multi-Year-Ice.
The absolute uncertainty in mean effective sea ice thickness derived from the laser altimeter on-board ICESat is 0.28 m in February/March and 0.21 in October/November.
5
The uncertainty in snow depth contributes up to 70 % of the total error, and the ice density 30–35 % with higher values in October/November.
We find large uncertainties in total sea ice volume and trend. For the total sea ice volume the mean is 10 120±1278 km3in October/November and 13 254±1858 km3in
February/March for our time period from 2005 till 2007. We obtain a trend of−875±
10
257 km3a−1
in February/March and−1445±531 km3a−1 in October/November in the
ICESat period 2003–2008.
Our results still reveal a decline in sea ice volume between the ICESat (2003–2008) and the CryoSat-2 (2010–2012) periods, but less dramatic than reported in previous studies. However, quantitative conclusions about a change of sea ice volume are hard
15
to make, considering the large uncertainties found in our study.
Acknowledgements. This work is supported by the Research Council of Norway, through the
projects CISAR no. 202313/V30 and the project ArcticSIV no. 207584. We also acknowledge Laurent Bertino for his help on the statistical methods used for this study and Timothy Williams for language corrections. We thank the National Snow and Ice Data Center, University of Col-20
orado, Boulder, USA for providing the input data for the sea ice concentration algorithms.
References
Aagaard, K. and Carmack, E.: The role of sea ice and other fresh water in the Arctic circulation, J. Geophys. Res., 94, 14485–14498, doi:10.1029/JC094iC10p14485, 1989. 5053
Alexandrov, V., Sandven, S., Wahlin, J., and Johannessen, O. M.: The relation between sea ice 25
TCD
7, 5051–5095, 2013Uncertainties in Arctic sea ice thickness and
volume
M. Zygmuntowska et al.
Title Page
Abstract Introduction
Conclusions References
Tables Figures
◭ ◮
◭ ◮
Back Close
Full Screen / Esc
Printer-friendly Version Interactive Discussion
Discussion
P
a
per
|
D
iscussion
P
a
per
|
Discussion
P
a
per
|
Discuss
ion
P
a
per
Bitz, C. M. and Fu, Q.: Arctic warming aloft is data set dependent, Nature, 455, 3–4, doi:10.1038/nature07258, 2008. 5069
Brucker, L. and Markus, T.: Arctic-scale assessment of satellite passive microwave derived snow depth on sea ice using operation IceBridge airborne data, J. Geophys. Res., 118, 2892–2905, doi:10.1002/jgrc.20228, 2013. 5058, 5061, 5068
5
Cavalieri, D. J., Gloersen, P., and Campbell, W. J.: Determination of sea ice parameters with the Nimbus 7 SMMR, J. Geophys. Res, 89, 5355–5369, doi:10.1029/JD089iD04p05355, 1984. 5083
Cavalieri, D. J. and Parkinson, C. L.: Arctic sea ice variability and trends, 1979–2010, The Cryosphere, 6, 881–889, doi:10.5194/tc-6-881-2012, 2012. 5053
10
Comiso, J.: Characteristics of Arctic winter sea ice from satellite multispectral microwave ob-servations, J. Geophys. Res., 91, 975–994, doi:10.1029/JC091iC01p00975, 1986. 5083 Comiso, J. C., Cavalieri, D. J., Parkinson, C. L., and Gloersen, P.: Passive microwave algorithms
for sea ice concentration: a comparison of two techniques, Remote Sens. Environ., 60, 357– 384, doi:10.1016/S0034-4257(96)00220-9, 1997. 5057
15
Farrell, S., Laxon, S., McAdoo, D., Yi, D., and Zwally, H.: Five years of Arctic sea ice free-board measurements from the Ice, Cloud and land Elevation Satellite, J. Geophys. Res., 114, C04008, doi:10.1029/2008JC005074, 2009. 5071
Forström, S., Gerland, S., and Pedersen, C.: Thickness and density of snow-covered sea ice and hydrostatic equilibrium assumption from in situ measurements in Fram Strait, the Barents 20
Sea and the Svalbard coast, Ann. Glaciol., 52, 261–271, doi:10.3189/172756411795931598, 2011. 5060, 5061, 5069
Giles, K. and Hvidegaard, S.: Comparison of space borne radar altimetry and airborne laser altimetry over sea ice in the Fram Strait, Int. J. Remote Sens., 27, 3105–3113, doi:10.1080/01431160600563273, 2006. 5073
25
Giles, K., Laxon, S., Wingham, D., Wallis, D., Krabill, W., Leuschen, C., McAdoo, D., Manizade, S., and Raney, R.: Combined airborne laser and radar altimeter measure-ments over the Fram Strait in May 2002, Remote Sens. Environ., 111, 182–194, doi:10.1016/j.rse.2007.02.037, 2007. 5069, 5073
Giles, K., Laxon, S., and Ridout, A.: Circumpolar thinning of Arctic sea ice following the 2007 30
TCD
7, 5051–5095, 2013Uncertainties in Arctic sea ice thickness and
volume
M. Zygmuntowska et al.
Title Page
Abstract Introduction
Conclusions References
Tables Figures
◭ ◮
◭ ◮
Back Close
Full Screen / Esc
Printer-friendly Version Interactive Discussion
Discussion
P
a
per
|
D
iscussion
P
a
per
|
Discussion
P
a
per
|
Discuss
ion
P
a
per
|
Haas, C., Hendricks, S., Eicken, H., and Herber, A.: Synoptic airborne thickness surveys reveal state of Arctic sea ice cover, Geophys. Res. Lett., 37, L09501, doi:10.1029/2010GL042652, 2010. 5073
Hezel, P., Zhang, X., Bitz, C., Kelly, B., and Massonnet, F.: Projected decline in spring snow depth on Arctic sea ice caused by progressively later autumn open ocean freeze-up this 5
century, Geophys. Res. Lett., 39, L17505, doi:10.1029/2012GL052794, 2012. 5068
Ivanova, N., Johannessen, O. M., Pedersen, L. T., and Tonboe, R. T.: Retrieval of Arctic sea ice parameters by satellite passive microwave sensors: a comparison between eleven sea ice algorithms, submitted, 2013. 5053, 5057
Kaleschke, L., Heygster, G., Lüpkes, C., Bochert, A., Hartmann, J., Haarpaintner, J., and 10
Vihma, T.: SSM/I sea ice remote sensing for mesoscale ocean-atmosphere interaction anal-ysis: ice and icebergs, Can. J. Remote Sens., 27, 526–537, 2001. 5083
Kloster, K.: Ice type concentration by microwave radiometry, Earth Observation Compendium for course AGF-207, Tech. rep., Norwegian Space Center, 1996. 5083
Kovacs, A.: Sea Ice, Part 1, Bulk Salinity Versus Ice Floe Thickness, Tech. rep., DTIC Docu-15
ment, 1996. 5060
Kurtz, N. and Farrell, S.: Large-scale surveys of snow depth on Arctic sea ice from operation IceBridge, Geophys. Res. Lett., 38, L20505, doi:10.1029/2011GL049216, 2011. 5060, 5073 Kurtz, N., Markus, T., Farrell, S., Worthen, D., and Boisvert, L.: Observations of recent Arctic sea ice volume loss and its impact on ocean-atmosphere energy exchange and ice production, 20
J. Geophys. Res., 116, C04015, doi:10.1029/2010JC006235, 2011. 5052, 5068, 5069, 5071 Kwok, R.: Annual cycles of multiyear sea ice coverage of the Arctic Ocean: 1999–2003, J.
Geophys. Res., 109, C11004, doi:10.1029/2003JC002238, 2004. 5056
Kwok, R. and Cunningham, G.: ICESat over Arctic sea ice: estimation of snow depth and ice thickness, J. Geophys. Res., 113, C08010, doi:10.1029/2008JC004753, 2008. 5055, 5069, 25
5071, 5072
Kwok, R. and Rothrock, D.: Decline in Arctic sea ice thickness from submarine and ICESat records: 1958–2008, Geophys. Res. Lett., 36, L15501, doi:10.1029/2009GL039035, 2009. 5054
Kwok, R., Zwally, H., and Yi, D.: ICESat observations of Arctic sea ice: a first look, Geophys. 30
TCD
7, 5051–5095, 2013Uncertainties in Arctic sea ice thickness and
volume
M. Zygmuntowska et al.
Title Page
Abstract Introduction
Conclusions References
Tables Figures
◭ ◮
◭ ◮
Back Close
Full Screen / Esc
Printer-friendly Version Interactive Discussion
Discussion
P
a
per
|
D
iscussion
P
a
per
|
Discussion
P
a
per
|
Discuss
ion
P
a
per
Kwok, R., Cunningham, G., Zwally, H., and Yi, D.: Ice, Cloud, and land Elevation Satel-lite (ICESat) over Arctic sea ice: retrieval of freeboard, J. Geophys. Res, 112, C12013, doi:10.1029/2006JC003978, 2007. 5062
Kwok, R., Cunningham, G., Wensnahan, M., Rigor, I., Zwally, H., and Yi, D.: Thinning and volume loss of the Arctic Ocean sea ice cover: 2003–2008, J. Geophys. Res, 114, C07005, 5
doi:10.1029/2009JC005312, 2009. 5052, 5053, 5054, 5056, 5058, 5069, 5071, 5072, 5084, 5094
Laxon, S., Peacock, N., and Smith, D.: High interannual variability of sea ice thickness in the Arctic region, Nature, 425, 947–950, doi:10.1038/nature02050, 2003. 5053, 5084, 5085 Laxon, S. W., Giles, K. A., Ridout, A. L., Wingham, D. J., Willatt, R., Cullen, R., Kwok, 10
R.,Schweiger, A., Zhang, J., Haas, C., Hendricks, S., Krishfield, R., Kurtz, N., Farrell, S., and Davidson, M.: CryoSat-2 estimates of Arctic sea ice thickness and volume, Geophys. Res. Lett., 40, 732–737, doi:10.1002/grl.50193, 2013. 5052, 5054, 5070, 5072, 5084, 5085, 5094
Lytle, V. and Ackley, S. F.: Snow-ice growth: a fresh water flux inhibiting deep convection in 15
the Weddell Sea, Antarctica, Ann. Glaciol., 33, 45–50, doi:10.3189/172756401781818752, 2001. 5058
Maaß, N., Kaleschke, L., Tian-Kunze, X., and Drusch, M.: Snow thickness retrieval over thick Arctic sea ice using SMOS satellite data, The Cryosphere Discuss., 7, 3627–3674, doi:10.5194/tcd-7-3627-2013, 2013. 5069
20
Markus, T. and Cavalieri, D. J.: Snow depth distribution over sea ice in the Southern Ocean from satellite passive microwave data, Antarct. Res. Ser., 74, 19–39, doi:10.1029/AR074p0019, 1998. 5057
Markus, T. and Cavalieri, D. J.: An enhancement of the NASA Team sea ice algorithm, IEEE T. Geosci. Remote, 38, 1387–1398, 2000. 5083
25
Markus, T. and Cavalieri, D. J.: AMSR-E Algorithm Theoretical Basis Document: Sea Ice Prod-ucts, NASA, Greenbelt, MD, USA, 2008. 5057
Markus, T., Cavalieri, D. J., Gasiewski, A. J., Klein, M., Maslanik, J. A., Powell, D. C., Stankov, B. B., Stroeve, J. C., and Sturm, M.: Microwave signatures of snow on sea ice: observations, IEEE T. Geosci. Remote, 44, 3081–3090, doi:10.1109/TGRS.2006.883134, 30