Temporomandibular disorder (TMD) is a common condition. This study is part of a research group and it investigated the prevalence of TMD and myofascial pain and its association with gender, age and socioeconomic class. The sample comprised 100 subjects, aged 15 to 70, users of the Family Health Units’ services, in the city of Recife, PE, Brazil. The TMD degree was evaluated using the Research Diagnostic Criteria for TMD and socioeconomic class by the Economic Classification Criteria Brazil. Categorical variables were analyzed by chi-square test for proportions and Fisher’s exact test for 2x2 tables, and binary logistic analysis to track the relationship between the independent and dependent variables. According to the results, 42% of the subjects had TMD and 14% myofascial pain. No statistically significant association could be found between TMD and gender or socioeconomic class, but it was found to have statistically significant association with age, and myofascial pain was associated with socioeconomic class. Considering that the results of the present study should be confirmed by further studies and the fact that this was a pilot study, the prevalence must be analyzed with caution.
Te m p o r o m a n d i b u l a r D i s o r d e r s
i n a S a m p l e P o p u l a t i o n o f
t h e B r a z i l i a n N o r t h e a s t
Victor Villaça Cardoso de Mello, André Cavalcante da Silva Barbosa, Mariana Pacheco Lima de Assis Morais, Simone Guimarães Farias Gomes, Márcia Maria Vendiciano Barbosa Vasconcelos, Arnaldo de França Caldas Júnior
Federal University of Pernambuco – UFPE, Recife, PE, Brazil
Correspondence: Prof. Dr. Arnaldo de França Caldas Júnior, Avenida Prof. Moraes Rego, 1235, 50670-901 Recife, PE, Brasil. Tel: +55-81-9971-3652. e-mail: [email protected]
Key Words: temporomandibular disorders, myofascial
pain, prevalence.
Introduction
Temporomandibular disorder (TMD) is a wide-ranging term used to describe a number of related disorders involving the temporomandibular joint (TMJ), masticatory muscles and occlusion, with common symptoms such as pain, restricted movement, muscle tenderness and intermittent joint sounds (1,2).
The etiology of the TMD has been the focus of considerable disagreement; therefore many authors propose a multifactorial etiology for TMD (3-8) related to stress, age, gender, personality and systemic problems such as rheumatoid arthritis, ankylosing spondylitis and lupus (3). Moreover, psychological, psychosocial and physical factors have been involved with TMD (5-8).
Approximately 30-70% of the general population will have at least one of the signs of TMD (4,7,9-11). TMD is most frequently seen in people between 20 and 40 years of age (4-6,12), and is more common in women than in men (4-7,12).
Many studies evaluated prevalence of TMD in different populations and therefore differ in ethnic, cultural and socioeconomic characteristics, which may have an effect on TMD prevalence (13). Also, the questionnaire used to evaluate TMD and the different methodological approaches make the comparison difficult.
The Research Diagnostic Criteria for Temporomandibular Disorders (RDC/TMD) (1) aimed to standardize the diagnosis
and classification of the different clinical forms of TMD (14). The rationale for this research was the need to pay deeper attention to TMD, due its high prevalence, high social cost and mainly high personal cost. The aims of this cross-sectional analytical study were to investigate the prevalence of TMD and myofascial pain and their association with gender, age and socioeconomic class.
Material and Methods
This cross-sectional pilot study was conducted in the Family Health Units (FHU) of the public health system (SUS) in the city of Recife, PE, Brazil.
Ethical approval for all stages was granted by the local research ethics committee (process number 0535.0172.172-11). All volunteers that agreed to take part in the study signed an informed consent form.
To obtain the sample size was used a multi-stage sample technique, where first was used a cluster sampling to define the neighborhood in the Health Districts, then a systematic sampling to choose the FHU, and at last to choose 100 volunteers, with age over 15 years and randomly selected among users of FHU. The number of participants was obtained using the population proportion formula adopting a 10% confidence level.
443
TMD in Brazilian Northeast
history of neurological disorders, head and neck tumor, patients unable to answer the questions during the interview, cognitive or hearing impairment, rheumatic diseases and patients under 18 unaccompanied by someone responsible.
Data collection occurred from August to September of 2012, applying a questionnaire formed by the following instruments: RDC/TMD and Brazilian Criterion of
Economic Classification (CCEB).
Presence and the severity of TMD were determined in accordance with the RDC/TMD, the dual-axis diagnostic procedure developed by Dworkin and LeResche (1) in 1992. Axis I involves a clinical physical examination, and Axis II a biobehavioral questionnaire, containing 10 and 31 questions, respectively. The diagnoses for Axis I were obtained according to RDC/TMD instructions for scoring, as follows: myofascial pain with or without aperture limitation (RDC Group I), disc displacement with or without reduction, with or without aperture limitation (RDC Group II), arthralgia or osteoarthritis or osteoarthrosis (RDC Group III). The rules for assigning diagnoses were as follows: a subject may be assigned at most one muscle diagnosis (Group I), and each joint may be assigned at most one diagnosis from Group II and one diagnosis from Group III. This means that a subject can be assigned from 0 diagnoses (no diagnosable muscle or joint conditions) to 5 diagnoses (one muscle diagnosis plus one diagnosis from Group II and one from Group III for each joint) (1). In the present study, those who presented at least one diagnosis, either muscular or articulation in at least one TMJ, regardless the presence of pain, were considered subjects with TMD. Otherwise, those who did not fit in any of the RDC diagnoses were considered without TMD. No diagnosis data of RDC Axis II was used in the present research, however, the third question (Q3) of the instrument (did you have pain in the face, jaw, temple, in front of the ear or in the ear in the past month?) is used in the scoring protocol system to perform Axis I muscle diagnosis (Group I) and was used in the present research to evaluate the presence of pain, regardless the TMD diagnosis. To assure validity and reliability of the collected data, the examination was performed by four calibrated examiners with Kappa = 0.8.
The socioeconomic and demographic profile was assessed using the CCEB questionnaire, which contains 11 questions. The answer to
each question corresponds to a score, which are summed up in order to obtain the household classification of the participant in A1, A2, B1, B2, C1, C2, D and E socioeconomic class.
Categorical variables were analyzed by Chi-squared test for proportions and Fisher’s exact test for 2x2 tables and continuous variables were analyzed by the nonparametric
Table 1. Distribution of patients according to TMD in relation to gender, age, and socioeconomic class (CCEB)
Variables
TMD Total
p-value
Yes % No % n %
Gender
Male 8 47.1 9 52.9 17 100
0.420
Female 34 41.0 49 59.0 83 100
Age Up to 30 years 24 55.8 19 44.2 43 100 0.013* Over 30 years 18 31.6 39 68.4 57 100
CCEB Classes B and C 27 37.5 45 62.5 72 100 0.108 Classes D and E 15 53.6 13 46.4 28 100
*statistically significant
Table 2. Distribution of patients according to myofascial pain in relation to gender, age, and socioeconomic class (CCEB)
Variables Myofascial Pain Total p-value
Yes % No % n %
Gender Male 1 5.9 16 94.1 17 100 0.263
Female 13 15.7 70 84.3 83 100
Age Up to 30 years 7 16.3 36 83.7 43 100 0.387 Over 30 years 7 12.3 50 87.7 57 100
CCEB
Classes B and C 6 8.3 66 91.7 72 100 0.014* Classes D and E 8 28.6 20 71.4 28 100
*Statistically significant
Table 3. Distribution of patients according to the presence of pain (RDC Axis II-Q3) in relation to gender, age and socioeconomic class (CCEB)
Variables
Presence of pain Total
p-value
Yes % No % n %
Gender
Male 2 11.8 15 88.2 17 100
0.250
Female 19 22.9 64 77.1 83 100
Age
Up to 30 years 9 20.9 34 79.1 43 100 0.594 Over 30 years 12 21.1 45 78.9 57 100
CCEB
Classes B and C 11 15.3 61 84.7 72 100 0.027* Classes D and E 10 35.7 18 64.3 28 100
444
V
.V
.C. de Mello et al.
Mann Whitney U test. The Shapiro-Wilk test was used to verify if the variable followed a normal distribution, and the binary logistic analysis to demonstrate the relationship between the independent and dependent variables. A 5% level of significance was set with a 95% confidence interval. To evaluate the logistic analysis, was used the statistical test of Hosmer and Lemeshow.
The software used for data entry and retrieval of statistical calculations was SPSS 15.0 (Statistical Package for the Social Sciences – version 15.0).
Results
One-hundred subjects aged 15 to 70 years with a mean of 34.76 ± 13.47 and median of 32 years were included in this analysis. Among the 100 volunteers, 83% were women. Regarding the CCEB, 72% belonged to class B and C, and 28% to D and E classes.
According to RDC/TMD, the prevalence of TMD in the total sample was 42% and the frequency of myofascial
pain was 14%.
Statistically significant differences were observed in patients aged up to 30 years old (55.8%). However, no statistically significant differences were observed between the presence of TMD with the variables gender and CCEB (Table 1).
Chi-squared test showed significant differences for socioeconomic class prevalence for both myofascial pain and presence of pain (RDC Axis II-Q3: did you have pain in the face, jaw, temple, in front of the ear or in the ear in the past month?), while no significant differences were assigned to gender and age (Tables 2 and 3).
To illustrate the distribution of data of the age variable with or without TMD was used a Boxplot graph (Fig. 1), where it may be observed that the mean age of patients with TMD is smaller than those without it, and higher patient age appearing mostly in the group without TMD.
To measure the odds ratio of patients with or without TMD, was performed a multivariate analysis using binary logistic regression model, in which age, CCEB and gender were accounted for in the final model.
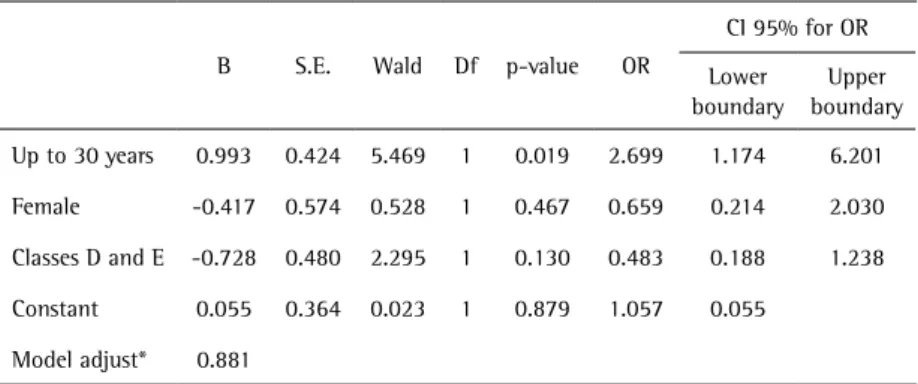
The Hosmer-Lemeshow statistic was used to check the quality of the model. If the p-value is greater than 0.05 the model is well adjusted. The model can be seen in Table 4 and shows that the variable associated with TMD was age: patients up to 30 years old had 2.7 times more chance to present TMD than those over 30 years old.
Discussion
The goals of this study were to evaluate the prevalence of TMD and myofascial pain and their association with gender and age in users of the public health system and association with socioeconomic variables.
According to RDC/TMD Axis I diagnoses, the prevalence of group I disorders (muscle disorders) in the present investigation (14%) was greater than the one reported among Mexican patients (10.9%) (13), and in a systematic
review, which showed 9.7% prevalence for group I diagnoses in studies on general populations (14). The application of RDC Axis II (Q3), showed that 21 subjects reported pain in the face, jaw, temple, in front of the ear or in the ear in the past month. This includes subjects with myofascial pain and also subjects with different painful RDC diagnoses, such as arthralgia and osteoarthritis unaccompanied by muscle disorders. This is important to be considered since the presence of pain itself is a reason for suffering and has great consequences in daily life. Table 4. Final model of logistic regression on TMD considering age, CCEB and gender as
explanatory variables
B S.E. Wald Df p-value OR
CI 95% for OR
Lower boundary
Upper boundary
Up to 30 years 0.993 0.424 5.469 1 0.019 2.699 1.174 6.201
Female -0.417 0.574 0.528 1 0.467 0.659 0.214 2.030
Classes D and E -0.728 0.480 2.295 1 0.130 0.483 0.188 1.238
Constant 0.055 0.364 0.023 1 0.879 1.057 0.055
Model adjust* 0.881
445
TMD in Brazilian Northeast
The most striking finding of the present investigation for myofascial pain was the statistically significant association with socioeconomic class, while gender and age did not have a significant difference, contrasting with other studies (13,15). The same results may be observed for the presence of pain, but this suggests that it may be a reflection of the above mentioned data, as 66.7% of these subjects presented myofascial pain diagnosis.
In this study, the percentage of women (41%) with TMD was lower than men (47.1%); but this difference was not statistically significant, may be due to the higher number of female individuals. Nevertheless, most studies have shown higher prevalence of TMD signs and symptoms in females, like those carried out by Casanova-Rosado et al. (13) with women having a 62% greater tendency with double odds for pain diagnosis. Other authors found out that the disorder was 2 to 4 times more common among women (5-8,9-11,13). Bonjardim et al. (4) also observed a greater percentage of women but did not find a statistically significant difference. Although attempts have been made to provide an explanation for this difference, like hormonal variation, muscular structure, there is still lack of studies that can truly establish the differences between the genders that result in a higher percentage of women presenting this disease (7,13).
Socioeconomic class was not significantly associated with TMD, and a possible explanation is due to the homogeneous population, belonging almost entirely to the lower socioeconomic class strata, agreeing with Martins et al. (16). Also, different problems, like those concerning family support for the poor; violence and business for the richest, may lead to stress, which is a possible variable for TMD, hampering the association of socioeconomic class and TMD.
In the present study was found a TMD prevalence of 42%, which is similar to the findings of other authors who also used RDC/TMD. Casanova-Rosado et al. (13) reported a prevalence of 46.1% in students aged 14 to 25 years; Pesqueira et al. (17) observed a 42.9% among university students; and Monteiro et al. (7) found a 32.7% prevalence in college students aged 17 to 30 years. Marklund and Wänman (6), in a case-control study within a 2-year prospective cohort, related an incidence of 12% and 28%, for the first and second year, with a 35% cumulative 2-year incidence and the prevalence increased significantly from the baseline (30%) to the 2-year observation period (45%).
Different authors (9-11) found a frequency higher than 60%, while Bonjardim et al. (4) observed 50% of students with some degree of TMD, using the Fonseca questionnaire. Macfarlane et al. (5), in a prospective cohort study using the Helkimo Index Criterion, showed an increased prevalence from the baseline (3.2%) at ages 11-12, to 17.6% at ages
19-20 and decreased at age 30-31 to 9.9% for both genders; the incidence of TMD was 11.5% in the second follow up (age 19-20) and 6% in the last follow up period (age 30-31), and incidence of persistent TMD was 34.9% and 28% in the second and last follow up, respectively. These prevalence discrepancies between some studies may be due to different sample populations regarding age, ethnics, culture and socioeconomic characteristics, which have all been already mentioned as possibly affecting factors on occurrence of TMD (13), together with the use of different research instruments for TMD diagnosis.
Several studies have demonstrated that the frequency of TMD symptoms varies with age, as it increased greatly between 20-40 years and in adolescents (4-6,12,13), then declined after 50 years of age (15). Corroborating the present findings, Pimentel et al. (18) observed an increasing characteristic until the age group 30 to 44 years old. Moreover, 32.7±14.5 years was the mean age of patients showing disc displacement in the absence of degenerative disorders (disc displacement alone or combined with muscle disorders and/or arthralgia), which also agrees with the present findings (19).
Recently, a strong emphasis has been given to the prevention and identification of TMD at earlier ages. Therefore, Tecco et al. (8) studied two groups in the ranges of 5-11 and 12-15 years, and revealed a percentage of 5.1% in younger subjects and 14.1% in older individuals.
The severity of TMD symptoms varies with age, and suggests an association of dentition exchange for children, pubertal development for adolescents and the reproduction period for adults. Nowadays, stress has a major contribution for TMD, affecting all age groups.
Although the results of the present study should be confirmed in other studies, and because of the pilot nature, the prevalence must be analyzed with caution. A change in philosophy is urgent in which emphasis is directed to the prevention of the upcome and progression of the TMD, since the signs and symptoms may have a substantial functional, emotional and psychological impact, with a negative effect on the quality of life of the individuals.
Resumo
446
V
.V
.C. de Mello et al.
mas houve associação estatisticamente significativa com a idade e a dor miofascial foi associada com a classe socioeconômica. Considerando-se que os resultados do presente estudo devam ser confirmados em outros estudos e por causa de sua natureza piloto, a prevalência deve ser analisada com cautela.
References
1. Dworkin SF & LeResche L. Research diagnostic criteria for temporomandibular disorders: review, criteria, examinations and specifications, critique. J Craniomandib Disord 1992;6:301–355. 2. Okeson JP. Etiology of functional disturbances in the masticatory
system. In: Okeson JP, editor. Management of temporomandibular disorders and occlusion, 7th ed. Rio de Janeiro: Elsevier; 2013. p. 102-128.
3. Oral K, Bal Küçük B, Ebeoğlu B, Dinçer S. Etiology of temporomandibular
disorder pain. Agri 2009;21:89-94.
4. Bonjardim LR, Lopes-Filho RJ, Amado G, Albuquerque Junior RLC, Gonçalves SRJ. Association between symptoms of temporomandibular disorders and gender, morphological occlusion, and psychological factors in a group of university students. Indian J Dent Res 2009;20:190-4.
5. Macfarlane TV, Kenealy P, Kingdon HA, Mohlin BO, Pilley JR, Richmond S, et al.. Twenty-year cohort study of health gain from orthodontic treatment: temporomandibular disorders. Am J Orthod Dentofacial Orthop 2009;135:692.e1-e8.
6. Marklund S, Wänman A. Risk factors associated with incidence and persistence of signs and symptoms of temporomandibular disorders. Acta Odontol Scand 2010;68:289-299.
7. Monteiro DR, Zuim PRJ, Pesqueira AA, Ribeiro PP, Garcia AR. Relationship between anxiety and chronic orofacial pain of temporomandibular disorder in a group of university students. Journal of Prosthodontics Research 2011;55:154-158.
8. Tecco S, Crincoli V, Di Bisceglie B, Saccucci M, Macrí M, Polimeni A, et al.. Signs and symptoms of temporomandibular joint disorders in Caucasian children and adolescents. The Journal of Craniomandibular Practice 2011;29:71-79.
9. Conti A, Freitas M, Conti P, Henriques J, Janson G. Relationship between signs and symptoms of temporomandibular disorders and orthodontic treatment: A cross-sectional study. Angle Orthod 2003;73:411-417.
10. Pedroni CR, De Oliveira AS, Guaratini MI. Prevalence study of signs and symptoms of temporomandibular disorders in university students. J Oral Rehabil 2003;30:283–289.
11. De Oliveira AS, Dias EM, Contato RG, Berzin F. Prevalence study of signs and symptoms of temporomandibular disorder in Brazilian college students. Braz Oral Res 2006;20:3–7.
12. Ingawalé S & Goswami T. Temporomandibular joint: disorders, treatments, and biomechanics. Annals of Biomedical Engineering 2009;37:976-996.
13. Rosado JF, Medina-Solís CE, Vallejos-Sánchez AA, Casanova-Rosado AJ, Hernández-Prado B, Avila-Burgos L. Prevalence and associated factors for temporomandibular disorders in a group of Mexican adolescents and youth adults. Clin Oral Invest 2006;10:42–49. 14. Manfredini D, Guarda-Nardini L, Winocur E, Piccotti F, Ahlberg J,
Lobbezoo F. Research diagnostic criteria for temporomandibular disorders: a systematic review of axis I epidemiologic findings. Oral Surg Oral Med Oral Pathol Oral Radiol Endod 2011;112:4534-62. 15. Yekkalam N and Wänman A. Prevalence of signs and symptoms
indicative of temporomandibular disorders and headaches in 35-, 50-, 65- and 75-year-olds living in Västerbotten, Sweden. Acta Odontol Scand 2014 Jan 13. [Epub ahead of print]
16. Martins RJ, Garcia AR, Garbin CAS, Sundefeld MLMM. The relation between socio-economic class and demographic factors in the occurrence of temporomandibular joint dysfunction. Ciência e Saúde Coletiva 2008;13:2089-2096.
17. Pesqueira AA, Zuim PR, Monteiro DR, Ribeiro P do P, Garcia AR. Relationship between psychological factors and symptoms of TMD in university undergraduate students. Acta Odontol Latinoam 2010;23:182-187.
18. Pimentel PHWG, Coelho Jr LGTM, Caldas Jr AF, Kosminsky M, Aroucha JMCNL. Demographic profile of patients attented at the orofacial pain control center of the dental school of the University of Pernambuco. Rev. Cir. Traumatol. Buco-Maxilo-Fac. 2008;8(2):69-76.
19. Manfredini D, Piccotti F, Ferronato G, Guarda-Nardini L. Age peaks of different RDC/TMD diagnoses in a patient population. J Dent 2010;38:392-399.