Analysis of teacher working environment: factors that
influence the voice
Análise do ambiente de trabalho de professores: fatores que
influenciam a voz
Melissa Rincón Cediel1, Javier Alfonso Reyes Neira1
ABSTRACT
Purpose: Determine the work environment factors related to hazards in voice production for elementary school teachers, as well as the impact of vocal rest and teaching methodology. Methods: This research features a quantitative, cross-sectional, non-experimental, correlational study, which applies an instrument consisting of a fill-out form and a ques-tionnaire performed by the evaluator to 90 elementary school teachers. The following variables were taken into account: classroom size, acous-tics, noise, amount of students in the classroom, chemical substances, temperature, subject taught, teaching method and classroom vocal use time. The statistical analysis was performed using the PASW statistical software, version 20. Results: Regarding the external acoustic insula-tion, the windows are made of glass or structures with metal bars, and no elements covering the surface of the window, zinc sheets or cement in ceilings and aluminum doors. The average noise measurement in the classroom is 77 dB, and the temperature and humidity measurements show a warm humid weather tendency. The most frequent teaching method is the lecture-type class. Elementary teachers must teach all of the subjects, and have an average voice rest period of 30 minutes. The in-ferential analysis using the chi-square test found no correlation between work environment factors of the teacher and the presence of dysphonia.
Conclusion: The elements of the teaching environment and the intrinsic factors of the teaching practice are not directly related to the presence of dysphonia, but they are associated elements that do not generate vocal disorders by themselves.
Keywords: Voice; Faculty; Occupational health; Risk factors; Dys-phonia
RESUMO
Objetivo: Identificar os fatores do ambiente de trabalho que influenciam na produção de voz de professores do ensino fundamental, e o impacto de repouso vocal e da metodologia utilizada para ensinar. Métodos:
Foi realizada uma pesquisa quantitativa de tipo correlacional com um desenho não experimental transversa. Foram aplicados um questionário estruturado de autopreenchimento e outro preenchido por um avaliador, envolvendo 90 professores do ensino fundamental. Foram consideradas as seguintes variáveis: tamanho da sala de aula, ruído, número de alu-nos, produtos químicos, temperatura, disciplina, metodologia e tempo que fala em sala de aula. A análise dos dados foi realizada utilizando o software estatístico SPSS versão 20. Resultados: O isolamento de som externo é dado por janelas que são de vidro ou grade sem revestimento, telhados de zinco ou cimento e portas em alumínio; o ruído médio na sala de aula foi de 77 dB, o ambiente foi considerado quente e úmido. O método predominante de ensino foi o expositivo, sendo que os pro-fessores ministram todas as disciplinas e o intervalo tem a duração de 30 minutos. Na análise inferencial, por meio do teste qui-quadrado, comprovou-se que não houve correlação entre os fatores do ambiente de trabalho e a presença de disfonia. Conclusão: Os elementos do ambiente de aprendizagem e os fatores intrínsecos da prática docente não estão relacionados com a presença de disfonia. Estes elementos sozinhos não geram distúrbios vocais.
Descritores: Voz; Docentes; Saúde do trabalhador; Fatores de risco; Disfonia
Work developed in the Rehabilitation, Work and Health Research Group (Grupo de Investigación Rehabilitación, Trabajo y Salud), Universidad Manuela Beltrán – UMB – Bucaramanga, Colômbia.
(1) Rehabilitation, Work and Health Research Group, Universidad Manuela Beltrán – UMB – Bucaramanga, Colômbia.
Conflict of interests: No
Authors’ contribution: MRCmain researcher, research design, research planning, documentation, data gathering and analysis, article writing; JARNadvisory, significant contributions to the writing and correction of the article.
Correspondence address: Melissa Rincón Cediel. Calle de los Estudiantes 10-20, Ciudadela Real de Minas, Bucaramanga, Santander, Colombia. E-mail: [email protected]
INTRODUCTION
Dysphonia is the medical term for the voice disorder where one or more acoustic characteristics of the voice becomes alte-red, e.g. pitch, intensity or tone, so that oral expression becomes more difficult, which in turn damages social communication and, in the case of the teacher, professional communication as well. In this kind of workers, besides originating an impact in health and life quality, dysphonia often is the cause for medical leaves and working absenteeism.
Occupational health intends to improve the working and health conditions of the workers, protecting them against the risks which derive from labor factors and that can affect the individual and collective health, such as physical, chemical, biological, ergonomic and psychosocial factors, among others. As for teachers, vocal health must be a significant goal among occupational health programs, hence the identification of the factors that trigger voice disorders, and the intervention on them, must be irrefutable purposes.
The etiology of dysphonia is attributed to a variety of causes: inadequate phonation technique(1,2) (vocal abuse), individual factors(3) (illness, muscular hypertension, posture, stress, emotional issues, habits), and work-environment related agents(4-6).
It is well known that teachers speak during long periods in classrooms full of students where acoustics is usually not the best, and also exposed to different temperatures and chemical conditions. Furthermore, the faculty involved in the formation process must establish a dialog with the students, capture their attention, motivate or admonish them. All these tasks are performed by a constant use of the voice and some particular nuances put into it.
Thus, the professional use of the voice demands adapting the phonatory functions to the demands of the working cir-cumstances and the social interaction. Each labor demands form the voice different properties, and teaching needs a high endurance level and, contrary to some people’s claims(7), some aesthetic elements.
Voice is, therefore, the functional working tool for the teacher, and its loss means the loss of working ability. The International Labour Organization (ILO)(8) highlights that the faculty is the profession with the highest risk of illness related to the voice, and many countries have assumed this guideline by giving dysphonia the professional illness status. In the case of Colombia, although there is not an explicit acknowledgement of dysphonia as a professional illness, this status can be inferred from the Decree 1295 of 1994, article 11, where professional illnesses are defined as “any permanent or temporary patholo-gical state that derives directly and necessarily from the labor of workers, or their working environment they are given, and that has been recognized by the National Government as such”(9).
In scientific evidence, numerous studies have described some vocal risk factors for teachers. However, they don’t
establish whether there is a direct relation between them and voice itself. Thus, the purpose of this study is to determine the work environment factors related to hazards in voice production for elementary school teachers, as well as the impact of vocal rest and teaching methodology. The results for this study will be useful in the assignation of priority in intervention among the systems of voice epidemiologic surveillance that could be set up in educational institutions, with the goal of reducing the occurrence of vocal disorders.
METHODS
The study that was carried out has a quantitative approach and is of the correlational type. First, the factors present in the work environment of elementary school teachers were outlined, as well as some of the intrinsic ones from the teaching practice itself. Then, a correlation was carried out to relate the most significant factors to the presence or absence of dysphonia variable. The design is non-experimental, cross-sectional, since no variables were manipulated, and only a registry of data in a specific moment was done.
The population for the study was selected under the follo-wing inclusion criteria: male or female teachers, with different ages and with or without vocal pathology, who work in public elementary schools in Bucaramanga, Colombia. The study had the following exclusion criteria: preschool, middle school and high school teachers, and private school teachers. Given this, an enquiry was made to the Municipal Education Ministry about the registered schools, resulting an amount of 63 public schools, regardless of their teaching level. Therefore, it was necessary to contact every school in order to filter the ones in the elementary level of education, and then figure out the total number of teachers in it. This process resulted in an amount of 1103 teachers.
To find out an adequate sample, a confidence level of 95% was used, and a maximum acceptable error of 10%. These calculations resulted in a sample of 90 teachers. The sampling error can be justified when considering that many selected teachers didn’t participate in the study because of lack of time, lack of interest or difficulty in commuting. Hence, the selection of the study group was carried out through a non-probabilistic sampling based on convenience.
The inclusion procedure for the subjects consisted of contacting the school coordinators or principals, explaining them the purposes of the study and they decided whether or not to participate. Afterwards, the project was socialized with the teachers, and those interested signed the written consent as an ethical criterion(10). This study has been approved by the Institutional Bioethics Committee certificate number 05-02-2205-2014.
and environments) of the National Education Ministry and some regulations stated in the Decree 1850 of 2002(12). The following variables were taken into account: classroom size, acoustics, noise, amount of students, chemicals, temperature, subject, teaching methodology, and exposure time. The instrument was divided into two sections: in the first one, the investigator consigned the measurements and observations, and in the second one, the subject teacher filled out a questionnaire. The data register was carried out as follows:
Classroom size: NTC 4595 states that the standard size is between 1.65 m2 and 1.80 m2 per student. The maximum number of students per classroom in elementary school(11) is of 40. Therefore, the classroom size comes from using a measu-ring tape, calculating the area and dividing it in the amount of registered students, thus obtaining the area per student.
Hearing Comfort: The external acoustic insulation is taken into account, as well as the sound pressure levels (SPL) inside the classroom. Regarding the external acoustic insulation, various observations were made: doors, windows and ceiling materials, and closure of doors and windows.
Sound Pressure Levels: Three measurements were taken in the classroom during the workday, and an average was cal-culated. For this purpose, a digital sound level meter was used (Digital SPL meter by RadioShack), previously calibrated. This tool registers the sound through a capacitive microphone, with a sensibility range of 50-126 dB, and allows the choice between A-type and C-type measurements. The selected measuring type was dB A (500-10000 Hz).
Number of students: This amount is asked from the school and registered.
Chemicals: The frequency of the use of the following tools was asked from the teacher: chalk, whiteboard marker, alcohol, Stoddard solvent (varsol), and such. The whiteboard eraser condition was observed as well (regarding its use).
Temperature: Three measurements were taken in the clas-sroom during the workday, and an average was calculated. For this purpose, an environmental thermometer was used (Amprobe THWD – Digital sling thermometer). This device can measure temperature (-20oC – 60oC) and relative humidity (1% – 99%), with a sample frequency of 0.5 s. According to these measurements, the environments are classified in(11): moderate, cold and mild weather (temperature oscillating between 5oC – 22oC, and relative humidity between 40% – 60%), warm dry weather (temperature between 5oC – 35oC and relative humidity between 10% – 60%), and warm humid weather (temperature between 22oC – 32oC and relative humidity between 65% – 95%). In this item, the presence or absence of air conditioning or fans is also considered.
Dysphonia: the altering of one or more voice qualities (voice quality, intensity and pitch) was perceptually assessed from the subjects at the moment of data recollection (yes/no) by a trained speech therapist. This study uses the GRBAS scale for perceptual evaluation of dysphonia(13), which, establishes
five parameters for voice assessment: G, grade of dysphonia; R, roughness; B: breath; A, asthenia; S, strain. Each feature is graded in a range 0-3 (0, normal; 1, light; 2, moderate; 3, severe). The assessed teacher is asked to utter a sustained [a] for 5 seconds. Their utterances are recorded and analyzed later. Grade 1 results are classified as presence of dysphonia.
Temperature perception in the classroom: The subject tea-cher answers the following questions in the fill-out form: “How do you feel the temperature in your classroom?”, “How do you feel towards the temperature of your classroom?” and “Do you think that the classroom temperature affects your voice?”
Teaching Methodology: The subject teacher answers the following question in the fill-out form: “Which of the following teaching strategies do you use most frequently in your class? (Lecture, teaching games, open-air class, students’ exposition, dictation and reading out loud from the teacher, class guides).
Exposure time(12): The subject teacher answers the follo-wing questions in the fill-out form: “How many class hours do you give daily?” and “Can you rest your voice during your workday? How long?”
Furthermore, in the fill-out form for the teachers, they were inquired about noise perception in the classroom, by answe-ring the following questions: “How would you describe your classroom?”, “How often does noise bother you in class?”, “Do you think the noise in the classroom affects your voice?”.
After the data was gathered, the information was organized in tables and analyzed using the statistical software SPSS, ver-sion 20. First, the measures of central tendency (mean, median and mode) and variability (range and standard deviation) were calculated. Then, a correlation of the variables was performed using chi-square statistic, using 0.05 as the alpha parameter. It is necessary to point out that a pilot test was performed with 18 teacher subjects, in order to verify if the instrument was able to register the needed data, as well as having some training in applying it.
RESULTS
The instrument was applied to 90 elementary school tea-chers, taking 45 minutes with each individual. These are the descriptive results:
Regarding the sociodemographic information relevant to the study, 87.8% of the teachers are female, and the remaining 12.2% are male. Moreover, the modal age is 52 years old, in nine subjects. The average for teachers’ age is 50 years old, and 50% of the teachers are above 52 years old. The data deviate 9.59 years from the average. Thus, all the assessed teachers are between 45 – 65 years old.
Classroom size: The most common value is 1.26 m2. 50% of the sample is situated under 1.37 m2, and the average of area per student is 1.37 m2, with a standard deviation of 0.37 m2 from the mean.
insulation, it was found that the 46.7% of the windows were made of glass, and in the 34.4% of the cases there are struc-tures with metal bars and no elements covering the surface of the window. As for the ceilings, it was found that 53% of the classrooms use zinc sheets and 42% use cement. Also, 57% of the doors are made of aluminum and in 36% of the cases there are metallic bar structures with no elements that cover the surface. And as for the closure of doors and windows, 90% of the observed classrooms remain with the windows open, and 91%, with the doors open.
Sound Pressure Levels: the most common value is 75 dB, with a mean of 77.65 dB and median 76.75 dB. The sound intensity inside the classroom has a standard deviation of 5.489 dB from the average.
Number of students: The data presents a mode of 33 students, a mean of 33.65 and a median of 33 students. The number of students per classroom deviates an average of 4.8 from the mean.
Chemicals: 92.2% of the teachers never use chalk, 70% never use Stoddard solvent (varsol), 77.8% always use whi-teboard marker and 57.8% never use alcohol. An inspection of the whiteboard eraser condition was carried out, where the felt could be classified according to its damage, as follows: 1 (good), 2 (acceptable) and 3 (damaged). It was observed that 41% of the erasers were found in an acceptable (2) condition, showing plenty of marker traces and felt weariness.
Temperature: Measurements were taken in May, August, September and November 2012, and February 2013, using a digital thermometer. Thus, the mode value is 30°C, the mean is 28.76°C and the median, 29°C. The temperature deviates an average of 1.397°C from the mean. The average relative humidity was of 82%. Regarding the presence of electric fans or air conditioning systems, it was observed that in 92% of the classrooms there are in average 2 to 3 fans. None has air conditioning systems.
Dysphonia: In the classification for presence or absence of dysphonia, this study used the degree of dysphonia criterion, rated from zero to three (0-3). Absence of dysphonia gives a score of zero, and presence of it, from one to three (1-3). 48% of the teachers evidenced dysphonia and 52% didn’t. Out of the former ones, 75,5% evidenced a mild degree (1), and 24,5% a moderate one (2). None of the teachers was found to suffer severe dysphonia (3).
As for the results of the fill-out forms for teachers, these are the results:
Noise perception in the classroom: For “How would you describe your classroom?”, thesample is bimodal, since the most common values are “very noisy” (1) and “noisy” (2), with a 40%. For “How often does noise bother you in class?”, 40% of the teachers answer “often” (4), and the average of answers oscillates between “seldom” (3) and “often” (4). For “Do you think the noise in the classroom affects your voice?”, most teachers consider that noise sometimes (2), or often (4), affects their voice quality, each with a 32%.
Temperature perception in the classroom: For “How do you feel the temperature in your classroom?”, most teachers say it is “warm” (3). 50% of the teachers’ answers are above 2 (“cold”), and the average of opinions is 3 (“warm”). The temperature perception has a standard deviation of 0.95 from the mean. For “How do you feel towards the temperature of your classroom?”, 53.3% of the teachers are comfortable with it, and 46.7% aren’t. For “Do you think that the classroom temperature affects your voice?”, 58.9% of the teachers consider that temperature does not affect their voice quality.
Subjects: Elementary school teachers must teach all the subjects, except for Music and Physical Education, which are optional for them. This situation results in a 41.1% of the teachers teaching Music, and a 44.4% teaching Physical Education.
Teaching Methodology: It was found that 27.8% of the teachers give lecture-type classes, 23.3% use class guides for the students to work on, 18% do dictations, 15.6% read out loud for the students, 4.5% let the students present expositions, 4.4% use didactic games and 2.2% teach classes in open air.
Exposure time: The teachers use their voice to teach five hours a day(12). Regarding the vocal rest, 50% can rest their voice during their workday, and the other 50% can’t. The most frequent amount of rest time is 30 minutes, with a mean and median of 30 minutes. The teachers’ rest time deviates 12.63 minutes from the average.
Inferential analysis
After the descriptive analysis, the most significant variables were chosen and correlated with the dysphonia variable (yes/ no) using the chi-square test. Here are the results.
The relationship between vocal rest and dysphonia was established using the chi-square test (Table 1). The resulting value for the test was 0.591, therefore the null hypothesis is accepted and the investigation hypothesis is rejected, which
Table 1. Relationship between the vocal rest and the presence of dysphonia
Presence of dysphonia
p-value
Yes No Total
Do you have vocal rest during your workday?
Yes 23 20 43
0.591
No 21 43 44
Total 44 43 87
means there is no relation between vocal rest and dysphonia. Afterwards, the variables of teaching Music and Physical Education and presence of dysphonia were correlated. The resulting values from the test were, respectively, of 0.184 and 0.787. Hence, there is no relation between these variables and the presence of dysphonia.
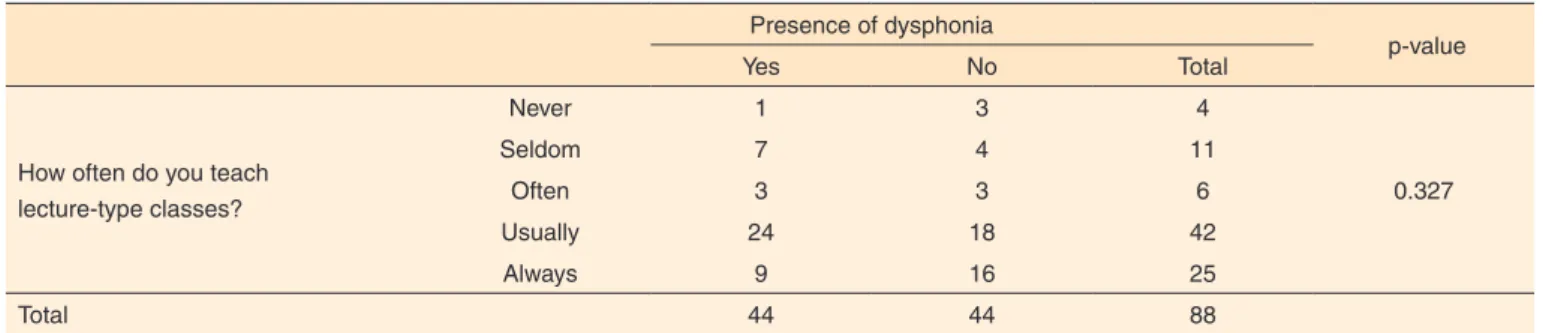
Lastly, the most frequent teaching methodology is the lecture-type class, which implies a continuous vocal use. Nevertheless, the statistical correlation between the teaching methodology and the presence of dysphonia resulted in a value of 0.327 (Table 2), which argues for the inexistence of relation between these variables.
DISCUSSION
Various studies(14-16) report the existence of environmental factors that can be related indirectly to the working ability and thus contribute to the problem of dysphonia addressed in this study, e.g. the exposure to contaminating agents, inadequate weather conditions, background noise and limitations in voice rest time. Furthermore, some reports suggest managing a labor risk protocol that includes biological, chemical, ergonomic and physical hazards in the vocal clinical medical records of workers(17). However, most of these investigations are descrip-tive and do not state with certitude a relationship between the aforementioned factors and voice disorders. In contrast, they suggest a relationship between certain factors that have been registered through the subjective perception of the assessed teachers, and vocal disruptions diagnosed by a health profes-sional. Still, no environmental measurements that confirm the exposure levels can be evidenced. Moreover, in another study, it is stated that no correlation can be found between presence of dysphonia and environmental variables, such as classroom temperature, humidity or suspended dust concentration(17). This claim can be also evidenced in this study.
In the results, small classrooms were found, with a num-ber of students according to the standards in NTC 4595. The composing materials of ceilings, doors and windows, and the closure of the two latter, do not contribute to the sound attenuation. Muffling can be achieved using porous, perfo-rated or slotted surfaces, with deep and narrow junctures,
and never with smooth ones. Among the recommended floor materials are rubber, vinyl, rug and jute. For walls, grout mortars, concrete and nude brick. For ceilings, plaster tiles, friezes and cornices. It is recommended that the doors and window frames are not smooth, and the paint is matte and corrugated(11). Moreover, in order to obtain more objective data regarding the acoustics of the classrooms, reverb time measurements are recommended for further investigations(18). Another study suggests classifying the classrooms according to their condition in Types 0-III and IV-VI using PN EN ISO 3382-1:2009 Acoustics - Measurement Of Room Acoustic Parameters - Part 1: Performance Spaces(14).
The tendency in noise measurements in classrooms shows that it is above the standards for this type of environment(11). These high noise levels induce a Lombard effect(19): the teacher must rival the background noise and increase the voice intensity in order to be heard. So, noise affects the voice(20,21) intensity in teachers, and especially the one coming from the students. Also, acoustics in the classroom has an impact on the teachers’ voice(14,22). There is also a connection between the presence of noise in the harmonics and voice disruption, and high noise levels(23). Hence, a considerable number of teachers claim to have voice disruptions connected to high noise levels in the classroom(24,25). Furthermore, the temperature and humidity measurements show a warm humid weather tendency, and there was no correlation of this factor with the presence of dysphonia. At this point, it is important for further studies to assess the voice in other weather and temperature conditions.
Regarding the teaching methods and strategies, most teachers use lecture-type classes and support of class guides for the student to develop. No studies have been found that report a connection between the teaching methods with voice disorders. Nonetheless, it is evident that they are related to the voice use time. In fact, there is a connection between vocal disability and professional vocal effort (years labored x hours of workday)(26,27). Thus, elementary school teachers are parti-cularly at risk, since they have few voice resting opportunities in their workdays(14). Furthermore, a related study claims that vocal pathologies are connected to having labored as teacher for more than seven years(28).
It was not possible to establish a direct connection between
Table 2. Relationship between the frequency of lecture-type classes and the presence of dysphonia
Presence of dysphonia
p-value
Yes No Total
How often do you teach lecture-type classes?
Never 1 3 4
0.327
Seldom 7 4 11
Often 3 3 6
Usually 24 18 42
Always 9 16 25
Total 44 44 88
the fact of teaching Music or Physical Education and the pre-sence of dysphonia, although the teachers of these areas are four times more likely to acquire voice disruptions than others(29,30). It is important to clarify that the assessed teachers in this study do not teach these areas full time, but they are an addition to their statutory workload.
CONCLUSION
Following the general objective of this study, which in-tended to outline the factors of the work environment and the intrinsic factors of the teaching practice that have an impact on teachers’ voice, the following are the conclusions that can be inferred.
Neither the aspects of the teaching environment nor the intrinsic factors of the teaching practice are directly connected to the presence of dysphonia. They comprise a set of associated elements that do not trigger by themselves voice disorders. Hence, this study helps ruling out supposedly contributing factors in the etiopathogenesis of vocal disorders, like envi-ronmental and intrinsic factors. Moreover, it helps setting the targets for intervention in elementary school teachers’ vocal health, focusing on the relief of triggering factors. However, the reduction of associated ones must be considered in healthcare programs as well.
Evidently, school teaching is a labor with a high risk of developing voice disruptions. This is why it is of the utmost importance that entities like professional risk administrating institutions (ARL, by their acronym in Spanish for “ administra-doras de riesgos laborales”), as well as healthcare entities, have knowledge of occupational dysphonia, so that they motivate awareness and prevention campaigns in the most vulnerable population. Further investigations in this area are recommen-ded, which outline the index of occupational dysphonia present in teachers.
ACKNOWLEDGEMENTS
We wish to thank the Manuela Beltran University for their support in the development of this study, as well as the teachers who took part in it for their willingness to be assessed, thus contributing to the progress in this research.
REFERENCES
1. Stojanović J, Ilić N, Stanković P, Arsenijević S, Erdevicki L, Belić B et al. Risk factors for the appearance of minimal pathologic lesions on vocal folds in vocal professionals. Vojnosanit Pregl. 2012;69(11):973-7. http://dx.doi.org/10.2298/vsp1211973s
2. Pasa G, Oates J, Dacakis G. The relative effectiveness of vocal hygiene training and vocal function exercises in preventing voice disorders in primary school teachers. Logoped Phoniatr Vocol. 2007;32(3):128-40. http://dx.doi.org/10.1080/14015430701207774
3. Charn TC, Mok PK. Voice problems amongst primary school teachers in Singapore. J Voice. 2013;26(4):141-7. http:/dx.doi.org/10.1016/j. jvoice.2011.05.004
4. Villanueva A. Voice disorders in the Metropolitan Area of San Juan, Puerto Rico: profiles of occupational groups. J Voice. 2011;25(1):83-7. http:/dx.doi.org/10.1016/j.jvoice.2009.03.002
5. Preciado J, Pérez C, Calzada M, Preciado P. Frecuencia y factores de riesgo de los trastornos de la voz en el personal docente de La Rioja: estudio transversal de 527 docentes: cuestionario, examen de la función vocal, análisis acústico y vídeolaringoestroscopia. Acta Otorrinolaringol Esp. 2005;56(4):161-170. http:/dx.doi.org/10.1016/ S0001-6519(05)78593-9
6. Lindstrom F, Waye KP, Södersten M, McAllister A, Ternström S. Observations of the relationship between noise exposure and preschool teacher voice usage in day-care center environments. J Voice. 2011;25(2):166-72. http:/dx.doi.org/10.1016/j.jvoice.2009.09.009 7. Federación de Traabajadores de la Enseñanza - FETE-UGT. Enfermedades asociadas a la docencia: alteraciones de la voz: Catálogo de enfermedades profesionales de los docentes de centros
educativos públicos de primer ciclo de educación infantil, primaria y secundaria obligatoria [Internet]. [cited 2013 Jan 17]. Available from: http://riesgoslaborales.feteugt-sma.es/p_preventivo/documentos/ Alteracionesvoz.pdf
8. Organización Internacional del Trabajo. Guía de buenas prácticas sobre recursos humanos en la profesión docente [Internet]. Ginebra: Organización Internacional del Trabalho; 2012. [cited 2013 July 20]. Available from: http://www.ilo.org/wcmsp5/groups/public/---ed_ dialogue/---sector/documents/publication/wcms_187796.pdf
9. Colombia. Ministerio de trabajo y seguridad social. Decreto 1295, de 1994 (junio 22). Por el cual se determina la organización y administración del Sistema General de Riesgos Profesionales. Diario Oficial; 24 jun 1994 [cited 2012 Feb 15];41.405. Available from: http://www.alcaldiabogota. gov.co/sisjur/normas/Norma1.jsp?i=2629
10. Ministerio de Salud (CO). Resolución nº 008430 de 1993. Por la cual se establecen las normas científicas, técnicas y administrativas para la investigación en salud[internet] Octubre, 1993 [cited 2012 Feb 15]. Available from: http://www.unisabana.edu.co/fileadmin/Documentos/ Investigacion/comite_de_etica/Res__8430_1993_-_Salud.pdf
11. Ministerio de Educación Nacional (CO). Norma Técnica Colombiana NTC 4595. Ingeniería civil y arquitectura. Planeamiento y diseño de instalaciones y ambientes escolares. Bogotá, DC: Instituto Colombiano de Normas Técnicas y Certificación; 1999 [cited 2012 Feb 15]. Available from: http://www.mineducacion.gov.co/1621/articles-96894_Archivo_ pdf.pdf
12. Ministerio de Educación Nacional (CO). Decreto nº 1850 de 2002 (agosto 13). Por cual se reglamenta la organización de la jornada escolar y la jornada laboral de directivos docentes y docentes de lós establecimientos educativos estatales de educación formal, administrados por los departamentos, distritos y municipios certificados y se dictan otras disposiciones. Diario Oficial; 2002 Ago 15 [cited 2012 May]; 44.901. Available from: http://www.mineducacion.gov.co/1621/articles-103274_ archivo_pdf.pdf
Rev Iberoam Rehab Med. 2006 [cited 2014 May];24(63):35-70 Available from: http://www.udc.es/grupos/apumefyr/docs/RIRM_2006_Vol_ XXIV_63.pdf
14. Barrreto-Munévar DP, Cháux-Ramos OM, Estrada-Rangel MA, Sánchez-Morales J, Moreno-Angarita M, Camargo-Mendoza M. Factores ambientales y hábitos vocales en docentes y funcionarios de pre-escolar con alteraciones de voz. Rev Salud Pública (Bogota). 2011;13(3):410-20. http://dx.doi.org/10.1590/S0124-00642011000300004
15. Santana MC, Goulart BN, Chiari BM. Voice disorders in teachers: critical review on the worker’s health surveillance practice. J Soc Bras Fonoaudiol. 2012;24(3):288-95. http://dx.doi.org/10.1590/S2179-64912012000300016
16. Penteado RZ, Pereira IMTB. Quality of life and vocal health of teachers. Rev Saúde Pública. 2007;41(2):236-43. http://dx.doi. org/10.1590/S0034-89102007000200010
17. Ferreira LP, Giannini SPP, Latorre MRDO, Zenari MS. Distúrbio de voz relacionado ao trabalho: proposta de um instrumento para avaliação em professores. Distúrb Comun [Internet]. 2007 [cited 2014 Jan];19(1):127-36. Available from: http://revistas.pucsp.br/index.php/dic/ article/viewFile/11884/8601
18. Cantor-Cutiva LC, Muñoz-Sanchez AI. Condiciones acústicas de las aulas universitarias en una Universidad pública en Bogotá. Med Segur Trab [Internet]. 2009 [cited 2013 Jul];55(216):26-34.Available from: http://scielo.isciii.es/scielo.php?pid=S0465-546X2009000300004&script=sci_arttext
19. Lane H, Tranel B. The Lombard sign and the role of hearing in speech. J Speech Hear [Internet]. 1971;Dec [Cited 2014 Jan];14:677-709. Available from: http://jslhr.pubs.asha.org/article.aspx?articleid=1749461 20. Vaz MRC, Severo LO, Borges AM, Bonow CA, Rocha LP, Almeida MCV. Voice disorders in teachers: implications for occupational health nursing care. Invest Educ Enferm. 2013 [cited 2014 Jan];31(2):252-60.Available from: http://www.scielo.org.co/scielo.php?script=sci_ abstract&pid=S0120-53072013000200011&lng=en&nrm=iso&tlng=en 21. Pizolato RA, Mialhe FL, Cortellazzi KL, Bovi Ambrosano GM, Beltrati MI, Pereira AC. Evaluation of risk factors for voice disorders in
teachers and vocal acoustic analysis as an instrument of epidemiological assessment. Rev CEFAC. 2013;15(4):957-66. http://dx.doi.org/10.1590/ S1516-18462013000400025
22. Radosz J. [Influence of classrooms acoustics on the teachers’ voice sound pressure level]. Med Pr. 2012;63(4):409-17. Polish
23. Simões-Zenari M, Bitar ML, Nemr NK. The effect of noise on the voice of preschool institution educators. Rev Saúde Pública. 2012;46(4):657-64. http://dx.doi.org/10.1590/S0034-89102012005000038
24. Libardi A, Gonçalves CGO, Vieira TPG, Silvério KCA, Rossi D, Penteado RZ. O ruído em sala de aula e a percepção dos professores de uma escola de ensino fundamental de Piracicaba. Disturb Comun [Internet]. 2006 [Cited 2014 Jan];18(2):167-78.Available from: http:// revistas.pucsp.br/index.php/dic/article/view/11782/8514
25. Lindstrom F, Waye KP, Södersten M, McAllister A, Ternström S. Observations of the relationship between noise exposure and preschool teacher voice usage in day-care center environments. J Voice. 2011;25(2):166-72. http://dx.doi.org/10.1016/j.jvoice.2009.09.009 26. Sampaio MC, Reis EJ, Carvalho FM, Porto LA, Araújo TM. Vocal effort and voice handicap among teachers. J Voice. 2012;26(6):815-8. http://dx.doi.org/10.1016/j.jvoice.2012.06.003
27. Sliwinska-Kowalska M, Niebudek-Bogusz E, Fiszer M, Los-Spychalska T, Kotylo P, Sznurowska-Przygocka B et al. The prevalence and risk factors for occupational voice disorders in teachers. Folia Phoniatr Logop. 2006;58(2):85-101. http://dx.doi.org/10.1159/000089610 28. Souza CL, Carvalho FM, Araújo TM, Reis EJ, Lima VMC, Porto LA. Factors associated with vocal fold pathologies in teachers. Rev Saúde Pública. 2011;45(5):914-21. http://dx.doi.org/10.1590/S0034-89102011005000055
29. Morrow SL, Connor NP. Voice amplification as a means of reducing vocal load for elementary music teachers. J Voice. 2011;25(4):441-6. http://dx.doi.org/10.1016/j.jvoice.2010.04.003