ABSTRACT:Objectives: Vaccines represent an important advancement for improving the general health of a population. The efective recording of vaccine data is a factor for the deinition of its supply chain. This study investigated vaccine data recording relatively to data collected from vaccination rooms and data obtained from a government-developed Internet platform. Methods: The monthly recorded total number of diphtheria and tetanus toxoids and pertussis vaccine (alone or in combination with the Haemophilus inluenzae type b conjugate vaccine) doses administered in a medium-sized city of the Southeast region of Brazil was collected for the period January/2006 through December/2010 from two sources: City level (directly from vaccination rooms, the study “gold standard”), and Federal level (from an Internet platform developed by the country government). Data from these sources were compared using descriptive statistics and the Percentage error. Results: The data values made available by the Internet platform difered from those obtained from the vaccination rooms, with a Percentage error relatively to the actual values in the range [-0.48; 0.39]. Concordant values were observed only in one among the sixty analyzed months (1.66%). Conclusions: A frequent and large diference between the number of diphtheria and tetanus toxoids and pertussis vaccine doses administered in the two levels was detected.
Keywords: Vaccines. Health planning. Statistics as Topic. Immunization. Statistics & numerical data. Diphtheria-Tetanus-Pertussis Vaccine.
Assessing vaccine data recording in Brazil
Avaliação de dados vacinais no Brasil
Mario Lucio de Oliveira NovaesI, Renan Moritz Varnier Rodrigues de AlmeidaI, Ronaldo Rocha BastosII
ORIGINAL ARTICLE / ARTIGO ORIGINAL
IProgram of Biomedical Engineering, Instituto Alberto Luiz Coimbra of Postgraduation and Research in Engineering (COPPE-UFRJ),
Universidade Federal do Rio de Janeiro – Rio de Janeiro (RJ), Brazil.
IIStatistics Department, Universidade Federal de Juiz de Fora – Juiz de Fora (MG), Brazil.
Corresponding author: Mario Lucio de Oliveira Novaes. Avenida Barão do Rio Branco, 3707, Passos, CEP: 36021-630, Juiz de Fora, MG, Brazil. E-mail: [email protected]
Conlict of interests: nothing to declare – Financial support: This project was partially supported by the National Counsel of
INTRODUCTION
By now, at least 25% of the world deaths are caused by infectious diseases, most of which in children between zero and ive years of age; and more than 60% of these deaths could be avoided by efective immunization programs1. Therefore, vaccines arguably represent the
most important advancement for improving the general health and the quality of life of a population2,3. They are a relatively cheap medical procedure with an excellent potential to
control and even to eradicate infectious diseases.
Worldwide vaccine coverage has been increasing since the 1980s, showing the importance of the immunization programs currently under way, especially in developing countries1,2. However,
in these countries, immunization programs sufer from the lack of technical and human resources, resulting in vaccine data quality problems and in poor data interchange between local level (vaccination rooms) and central government level (federal), hindering policies for health care planning2-5. These problems may result in an inadequate evaluation of vaccine supply chain and
vaccine campaigns, with serious repercussions in immunization program strategies3,6.
In Brazil, the National Immunization Program (NIP) was created in 1973, with the aim of coordinating national vaccine programs7. The expansion of these programs created the
necessity to improve vaccine distribution logistics, so as to achieve a high vaccination cov-erage8. NIP data can be accessed via an Internet platform, the NIP/Datasus, which also
makes available immunization data according to vaccines, age group and monitoring vac-cination coverage in diferent target groups of immunization, according to health units, municipalities and states (the Information System of Evaluation of National Immunization Program – SIAPI)9.
RESUMO:Objetivos: Vacinas representam um importante avanço para melhorar a saúde de uma população. O registro adequado dos dados vacinais é um fator crítico para a programação da distribuição de vacinas. Este estudo investiga os registros de uma vacina aplicada à população, de acordo com dados coletados nas salas de vacinação e dados obtidos a partir de uma plataforma governamental de Internet. Métodos: O número mensal total de doses aplicadas da vacina contra difteria, tétano e coqueluche (isolada ou combinada à vacina contra Haemophilus inluenzae tipo b) de uma cidade de médio porte da Região Sudeste do Brasil foi coletado no período de Janeiro/2006 a Dezembro/2010, de duas fontes: a nível Local (diretamente de salas de vacinação, o “padrão ouro”) e a nível Federal (a partir de uma plataforma governamental de Internet). Os dados dessas fontes foram comparados utilizando estatística descritiva e a Percentagem de erro. Resultados: Os valores dos dados disponibilizados pela plataforma governamental diferem daqueles obtidos nas salas de vacinação, com uma Percentagem de erro compreendida no intervalo [-0,48; 0,39]. Valores concordantes foram observados somente em um dentre os sessenta meses analisados (1,66%). Conclusões: Detectou-se uma frequente e acentuada diferença entre o número de doses aplicadas da vacina observada relativamente às duas fontes de dados da pesquisa.
The present study aimed to assess the agreement between data sources for diphthe-ria and tetanus toxoids and pertussis vaccine (DTP) doses administered in a city of Brazil. To this end, the total number of DTP doses (alone or in combination with the Haemophilus inluenzae type b conjugate vaccine) administered in the city vaccination rooms was col-lected and then compared with that from the federal level, obtained from an information system managed by the Ministry of Health of Brazil (NIP/Datasus)10.
METHODS
RESEARCH SET UP
An observational, ecological study was performed, in which the monthly total num-ber of DTP doses administered in the period January, 2006 through Decemnum-ber, 2010 was obtained for a Brazilian city. The vaccine was introduced in the city in 1973; data were col-lected between January, 2012 and April, 2012.
As mentioned, data were collected from two sources: directly from the vaccination rooms in operation at the time of the study (City level, the study “gold standard”) and from an information system (an Internet-available platform) developed by the federal government, the National Immunization Program/Datasus (NIP/Datasus) (the Federal level)10.
This sys-tem ofers access to consolidated vaccine data from all the cities of the country since 199111,
and is openly accessible via an Internet platform. Data from the vaccination rooms were collected with the permission of the City Health Secretariat/Juiz de Fora (CHS-JF).
The research took place in a typical southeastern Brazilian city ( Juiz de Fora, MG), a medium-sized city12, located 275 km from the capital of the Minas Gerais State (Belo
Horizonte city), 180 km from the city of Rio de Janeiro and 480 km from the city of São Paulo. The city is basically urban, with about 550,710 inhabitants13 in an area of 1.435,664 km².
Its Municipal Development Human Index (MDHI) is 0.828 (state average: 0.719, country average: 0.699); it has three schools of medicine, one public and two private13. Health care
is provided by four public and seven private hospitals. The vaccination rooms ofered the fourteen vaccines recommended by the Brazilian National Immunization Program (NIP) at the time of data collection. DTP was chosen for analysis since it is considered as one of the best indicators for the performance of a health system, as well as an indicator of vaccine coverage14,15.
INFORMATION SOURCES, DATA FLOW AND ANALYSIS
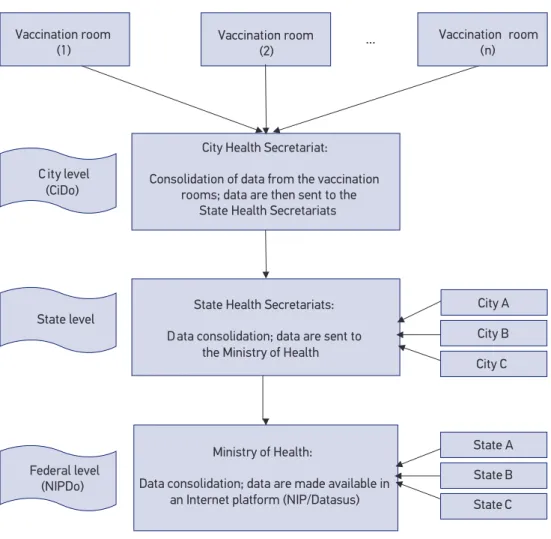
Vaccine data low is basically the same as from other Brazilian cities and, in the vaccina-tion rooms, the management of vaccine supplies and informavaccina-tion recording is usually per-formed by nurses. Data are processed at the city level, sent to the regional level and inally to the federal level, as below (see also Figure 1):
1. City level: The vaccination room personnel write down, daily, in paper spreadsheets, data concerning the number of vaccine doses administered in each vaccination room. These doses are registered in a vaccination card (which remains in possession of the vaccinated person), and in a speciic spreadsheet, in which the available vaccines of the Brazilian NIP are recorded. Still in the vaccination room, the number of doses
Figure 1. Data low from the City level (CiDo) through the Federal level (NIPDo). Vaccine data are sent by Internet and made available for researchers, health planners and health professionals in a public available Internet platform (NIP/Datasus).
... Vaccination room
(n)
State Health Secretariats:
D ata consolidation; data are sent to the Ministry of Health
Ministry of Health:
Data consolidation; data are made available in an Internet platform (NIP/Datasus)
City Health Secretariat:
Consolidation of data from the vaccination rooms; data are then sent to the
State Health Secretariats Vaccination room
(2) Vaccination room
(1)
C ity level (CiDo)
City A
City B
City C
State A State level
Federal level
(NIPDo) State B
administered is consolidated monthly (manually, with the help of an electronic calculator). The monthly DTP doses administered in each vaccination room is transferred to a paper spreadsheet, which is then sent to the CHS-JF. In the CHS-JF, vaccine data concerning all the city vaccination rooms are added up with the help of a computer information system, especially designed to this end. This process results in a database, the total city doses administered (CiDo), which is sent by e-mail to the next level, the SHS-JF;
2. State level: The SHS receives monthly vaccine reports from all State cities. The SHS is divided in diferent notiication sections, according to government-deined geographical regions. Data sent to the SHS are consolidated and then sent, also monthly, to the Ministry of Health, at the federal level;
3. Federal level: Vaccination data from all states of Brazil are sent to the Department of Health, Ministry of Health. These data are then made available in an information system (the mentioned NIP/Datasus Internet platform), and may be consulted for each Brazilian city for the variables number of doses administered, vaccine coverage and month/year of vaccine administration. Around two and three months are necessary for the city data to become available in this system.
For this study, data were collected from maps of the monthly vaccine doses administered in each vaccination room, and then grouped into monthly totals for all vaccination rooms (CiDo). These values were compared with the data related by the NIP/Datasus (NIPDo) by means of the Percentage (or Percent) error (Pe)16. Pe indicates the inaccuracy of a
mea-surement and is expressed as16:
Pe=[(Estimated value-Actual value)/Actual value]*100% (1)
In this paper the Estimated value = NIPDo and the Actual value=CiDo; and the equa-tion above becomes:
Pe=[(NIPDo-CiDo)/CiDo]*100% (2)
A positive Pe indicates that the number of doses administered is overestimated, and a negative Pe that this number is underestimated. If Pe is zero, NIPDo is the same as CiDo (a concordance between the two data sources, a desirable situation). Pe was estimated monthly, given that this was the study smallest observational unit. 95% conidence inter-vals (95%CI) for Pe were also estimated using standard statistical formula:
95%CI=[d-(1.96)s/sqrt(n);d+(1.96)s/sqrt(n)] (3)
Where d is the mean, s is the estimated standard error, 1.96 is the critical α = 5% Normal
RESULTS
The staf of the vaccination rooms receives periodic training on the correct proce-dures for administering vaccine doses, especially before large immunization campaigns or before the introduction of a new vaccine in the immunization schedule. However, it was not possible to identify training speciically directed to the management of vaccine supplies or to the importance of adequate data reporting. Checklists, procedures for data quality control or information feedback systems were not used, and data input had little or no direct supervision.
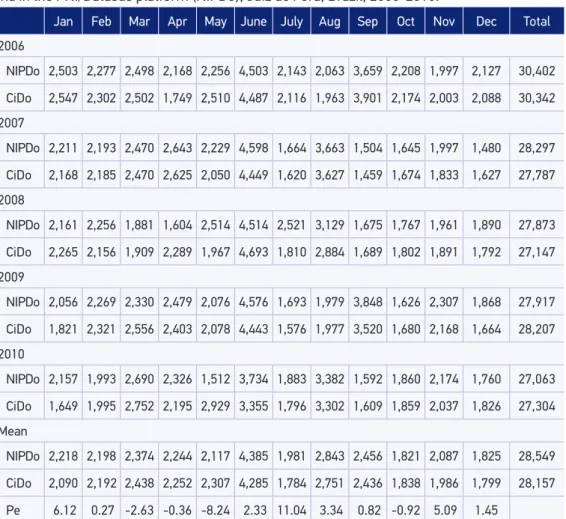
Table 1 shows the monthly and yearly CiDo, NIPDo and mean Pe values. This table shows that the mean Pe among different years varies from -8.24 to 11.04. Thus, for
Table 1. Number of montly data regarding the DTP vaccine registered in the vaccination rooms and in the PNI/Datasus platform (NIPDo), Juiz de Fora, Brazil, 2006-2010.
Jan Feb Mar Apr May June July Aug Sep Oct Nov Dec Total
2006
NIPDo 2,503 2,277 2,498 2,168 2,256 4,503 2,143 2,063 3,659 2,208 1,997 2,127 30,402
CiDo 2,547 2,302 2,502 1,749 2,510 4,487 2,116 1,963 3,901 2,174 2,003 2,088 30,342
2007
NIPDo 2,211 2,193 2,470 2,643 2,229 4,598 1,664 3,663 1,504 1,645 1,997 1,480 28,297
CiDo 2,168 2,185 2,470 2,625 2,050 4,449 1,620 3,627 1,459 1,674 1,833 1,627 27,787
2008
NIPDo 2,161 2,256 1,881 1,604 2,514 4,514 2,521 3,129 1,675 1,767 1,961 1,890 27,873
CiDo 2,265 2,156 1,909 2,289 1,967 4,693 1,810 2,884 1,689 1,802 1,891 1,792 27,147
2009
NIPDo 2,056 2,269 2,330 2,479 2,076 4,576 1,693 1,979 3,848 1,626 2,307 1,868 27,917
CiDo 1,821 2,321 2,556 2,403 2,078 4,443 1,576 1,977 3,520 1,680 2,168 1,664 28,207
2010
NIPDo 2,157 1,993 2,690 2,326 1,512 3,734 1,883 3,382 1,592 1,860 2,174 1,760 27,063
CiDo 1,649 1,995 2,752 2,195 2,929 3,355 1,796 3,302 1,609 1,859 2,037 1,826 27,304
Mean
NIPDo 2,218 2,198 2,374 2,244 2,117 4,385 1,981 2,843 2,456 1,821 2,087 1,825 28,549
CiDo 2,090 2,192 2,438 2,252 2,307 4,285 1,784 2,751 2,436 1,838 1,986 1,799 28,157
Pe 6.12 0.27 -2.63 -0.36 -8.24 2.33 11.04 3.34 0.82 -0.92 5.09 1.45
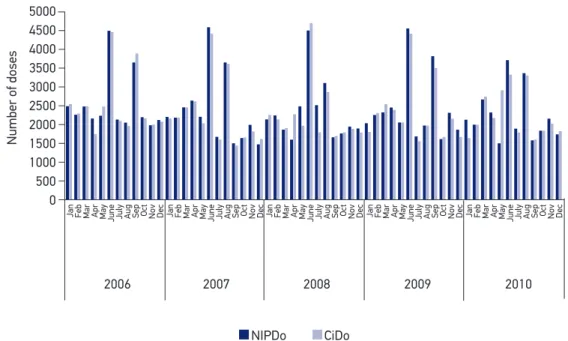
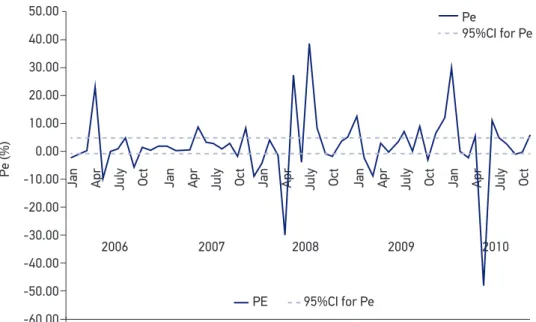
May, the mean of the DTP vaccine doses notiied in the NIP/Datasus Internet platform was 8.24% lower than the number registered in the vaccination rooms, and for July the NIP/Datasus number was 11.04% higher than the number at the vaccination rooms. Figure 2 shows the NIPDo juxtaposed to the CiDo (x axis: Months; y axis: Number of doses); the peaks observed in Figure 2 correspond to well-publicized mass vaccination campaigns, when Poliomyelitis vaccine and DTP are, if necessary, administered at the same time. Figure 3 shows that Pe had, monthly, values from -0.48 to 0.39 (x axis: Months; y axis: Pe). In one of the sixty observed months (March/2007) Pe was zero (CiDo = NIPDo), resulting in an agree-ment between the two data sources of 1.66%. Overestimation was present in 37/60 months (61.66%) and underestimation in 22/60 months (36.66%). In Figure 3, a 95%CI was plotted (Mean = 2, Standard deviation = 11.86); Pe values in April/2006, May/2006, April/2008, May/2008, July/2008, Jan/2010 and May/2010 were not included in the CI.
DISCUSSION
In 2008, WHO estimated that 1.5 million of deaths among children under 5 years of age (17% of global total mortality in this age) were due to diseases that could have been prevented by routine vaccination17. Immunization is, therefore, one of the most efective
strategies for preventing illnesses in children18.
Figure 2. “Number of doses administered at the city vaccination rooms” (CiDo) and “Number of doses reported at the NIP/Datasus system” (NIPDo), monthly, DTP vaccine, 2006 – 2010.
5000
2006 4500
4000
Number of doses
3500 3000
Jan Feb Mar Apr May June July Aug Sep Oct Nov Dec Jan Feb Mar Apr May June July Aug Sep Oct Nov Dec Jan Feb Mar Apr May June July Aug Sep Oct Nov Dec Jan Feb Mar Apr May June July Aug Sep Oct Nov Dec Jan Feb Mar Apr May June July Aug Sep Oct Nov Dec
2500 2000 1500 1000 500 0
2007
NIPDo CiDo
Figure 3. Percentage error (Pe) between the “Number of doses administered at the city vaccination rooms” (CiDo) and “Number of doses reported at the NIP/Datasus system” (NIPDo), monthly, DTP vaccine, 2006 – 2010, and 95% conidence intervals for Pe.
50.00
40.00
30.00
20.00
10.00
0.00
-10.00
-20.00
-30.00
-40.00
-50.00
-60.00
2006
PE
Jan Apr July Oct
2007
Pe
95%CI for Pe
Jan Apr July Oct
2008
Jan Apr July Oct
2009
Jan Apr July Oct
2010
Jan Apr July Oct
Pe (%)
95%CI for Pe
However, despite its importance, studies on the efective recording of vaccine data are not common, with few studies performed in Latin America19. Without adequate
record-ing, it is to be expected that the planning and evaluation of immunization campaigns is seriously hindered6. Logistic planning for vaccine distribution should be based on solid and
well-deined information, including previous supply and wastage values, so that future vac-cine needs can be estimated with less error20,21.
The Brazilian NIP began in 1973 with the purpose of coordinating vaccination poli-cies at the national level. At irst, only seven vaccines were made freely available by NIP: Poliomyelitis, Measles, Smallpox, Tuberculosis, DTP, Yellow fever and Tetanus vaccine7.
Eventually, NIP was expanded and now includes fourteen vaccines, which are freely admin-istered in about 30,000 vaccination rooms22.
The choice of DTP to evaluate data concordance was based on the fact that this vaccine requires a minimum of three intramuscular shots, demanding a high degree of commitment by both the vaccination team and the target population15. The Global Alliance for Vaccines
and Immunization (GAVI) inances children vaccination in 52 developing countries taking into account the results of DTP doses administered15.
reports on large discrepancies between data at vaccination rooms and data notified by government information systems2,14,23. This is a serious problem, especially for
devel-oping countries, and such discrepancies have been identified, for instance, in Tunisia and Myanmar2,14.
Besides mis-recording and over-reporting, sometimes registering errors may arise from the need to overestimate the number of doses administered, in order to ful-fill governmental planning targets24. However, the probability of these errors in the
Brazilian case is small, since, as mentioned, vaccine doses are registered in a spe-cific spreadsheet. Additionally, recording takes place at the moment of vaccination, and each vaccination room manages a relatively small amount of information, so that it is expected that under (or over) estimation is not to be a great concern in the present case.
The results showed important diferences in the city level data relatively to the federal level. These diferences are especially visible when data are considered monthly — a neces-sary information, for instance, for vaccine purchasing, stocking and administering25. Thus,
for instance, in May, 2010 it can be seen that NIPDo = 1,512 and CiDo = 2,959, and in April, 2006, NIPDo = 2,168 and CiDo = 1,749.
A lower number of doses administered was reported by the federal level in 36.66% of the months, while overestimation was present in 61.66% of them. Thus, in 59/60 (98.33%) of the months data disagreed between the two levels (Figures 2 and 3). This disagreement suggests the existence of serious errors in the data information flow, and implies in a severe problem for vaccine demand estimation, since the city level data are “lost” for planners. Although these errors cannot be expected to seri-ously affect coverage estimation (which is based on longer periods of time) errors in monthly vaccine data may hinder the construction of mathematical and epidemiolog-ical demand models26. These models, already widely used in some countries, depend
on data as disaggregated as possible (for example, city level, weekly). Other concerns refer to disease outbreaks, demanding a rapid response and a good knowledge of the available vaccine supply and the mentioned need for an adequate balance of vaccine purchase and supply25.
It follows from the above that studies relying on federal data probably incurred in large errors27. This is also a problem, since the federal level data is easy to access, is endorsed
On the other hand, demand overestimation will most probably cause vaccine wastage and monetary losses28.
Variations in recorded data also may be due to inconsistent data checking routines and lack of specialized training2, 24. Since 2010, the Ministry of Health of Brazil is developing an
Internet platform, the Brazil´s Nominal Information System of the National Immunization Program29, with the purpose of registering individual vaccination data for all residents
in Brazil. This platform, to be installed in all vaccination rooms of the country, will be able to transmit data directly to the managers of the National Immunization Program29.
However, although computers are already in use for the processing of vaccine administra-tive data in most of the world, for the most part procedures and routines for data transfer are still far from adequate6,19,30. Thus, the implementation of computerized tools for public
health data processing is indeed necessary, but that this endeavor also requires a high com-mitment to the improvement of human resources, towards an efective management of information systems31-34.
Another problem resulting from inadequate data recording is that international compar-isons of vaccination rates and population coverage are hindered if no standardization can be expected in data collection25. Surveys can be used for such comparisons, but these are
not equivalent to good quality administrative data, since the information provided by sur-veys pertains only to limited cohorts, which do not allow for consistent and reliable infor-mation low6,20. Regarding the improvement of data collection and transmission systems,
an ongoing efort concerns the implementation of the Information System of the National Immunization Program (SINIP), with the objective of facilitating vaccine demand planning and stock control10.
A limitation of the present study is that the data collection concerned only one Brazilian city and one vaccine type. Although a rationale was ofered for this approach, it would be interesting to obtain a more complete picture of the global situation of vaccine data record-ing in Brazil. However, as argued before, at the present time it is not possible to have an optimistic view about this situation, and higher degrees of discrepancy are to be expected in more rural areas of the country.
CONCLUSION
1. Duclos P, Okwo-Bele JM, Gacic-Dobo M, Cherian T. Global immunization: status, progress, challenges and future. BMC Int Health Hum Rights 2009; 9(Suppl 1): S2.
2. Chahed MK, Bellali H, Alaya NB, Mrabet A, Mahmoudi B. Auditing the quality of immunization data in Tunisia. Asian Pac J Trop Dis 2013; 3(1): 65-70.
3. Aranda CMSS, Moraes JC. Vaccine storage cold chain in public health units of the City of São Paulo: knowledge and practice. Rev Bras Epidemiol 2006; 9(2): 172-85.
4. Placzek H, Madoff LC.The use of immunization registry-based data in vaccine efectiveness studies. Vaccine 2011; 29(3): 399-411.
5. India. Ministry of Health & Family Welfare. National vaccine policy. New Delhi: Ministry of Health & Family Welfare; 2011.
6. Bosch-Capblanch X, Ronveaux O, Doyle V, Remedios V, Bchir A. Accuracy and quality of immunization information systems in forty-one low income countries. Trop Med Int Health 2009; 14(1): 2-10.
7. Brasil. Ministério da Saúde. Secretaria de Vigilância em Saúde. Programa Nacional de Imunizações – 30 anos. [In Portuguese]. Brasília: Fundação Nacioanl de Saúde; 2003.. Available: <http://bvsms.saude. gov.br/bvs/publicacoes/livro_30_anos_pni.pdf> (Accessed: Jan, 2012).
8. Brasil. Ministério da Saúde. Secretaria de Vigilância em Saúde. Manual de Rede de Frio do Programa Nacional de Imunizações; 2013. [In Portuguese]. Brasília: Ministério da Saúde; 2013. Available: <http:// bvsms.saude.gov.br/bvs/publicacoes/manual_rede_ frio4ed.pdf>. (Accessed: Dec, 2013).
9. Brasil. Ministério da Saúde. Sistema de Informações do Programa Nacional de Imunizações. Avaliação do Programa de Imunizações. Manual do usuário. Versão do sistema 6.0. [In Portuguese]. 2. ed. Brasília: Ministério da Saúde; 2001. Available: <http://bvsms. saude.gov.br/bvs/publicacoes/funasa/si_pni_api. pdf>. (Accessed: Jan, 2013).
10. Brasil. Ministério da Saúde. Sistema de Informação do Programa Nacional de Imunizações. Apresentação. Available: <http://tinyurl.com/khmc9rf> [Accessed: Jan/2012].
11. Brasil. Ministério da Saúde. Departamento de Informática do Sistema Único de Saúde. Available: <http://www2.datasus.gov.br/DATASUS> 2011. (Accessed: March, 2012).
12. Chaves ST. Estudo de caso - a cidade de Juiz De Fora, MG – sua centralidade e problemas sócio-econômicos. Revista de Geograia, Meio Ambiente e Ensino 2011; 2(1): 155-70.
13. IBGE – Instituto Brasileiro de Geograia e Estatística. Cidades. 2014. Available: <http://cidades.ibge.gov. br/xtras/peril.php?codmun=313670>. (Accessed: Jul, 2015).
14. Burton A, Monasch R, Lautenbach B, Gacic-Dobo M, Neill M, Karimov R, et al. WHO and UNICEF estimates of national infant immunization coverage: methods and processes. Bull World Health Organ 2009; 87: 535-41.
15. World Health Organization (WHO). WHO vaccine preventable diseases: monitoring system - 2010 global summary. Geneva: World Health Organization; 2010.
16. Green K, Tashman L. Percentage error: What denominator? Foresight 2009; 12: 36-43.
17. Black RE, Cousens S, Johnson HL, Lawn JE, Rudan I, Bassani DG, et al. Global, regional, and national causes of child mortality in 2008: a systematic analysis. Lancet 2010; 375(9730): 1969-87.
18. C a n ava t i S, P l u g g e E , S u wa n j a t u p o r n S, Sombatrung jaroena S, Nosten F. Barriers to immunization among children of migrant workers from Myanmar living in Tak province, Thailand. Bull World Health Organ 2011; 89(7): 528-31.
19. Barros ENC, Silva EM. Epidemiologic surveillance of measles and rubella in Campinas (SP), Brazil: the reliability of the data. Rev Panam Salud Publica 2006; 19(3): 172-8.
20. Tao W, Petzold M, Forsberg BC. Routine vaccination coverage in low- and middle-income countries: further arguments for accelerating support to child vaccination services. Glob Health Action 2013; 6: 20343..
21. Chiu R, Chang CM, Chang YC. A forecasting model for deciding annual vaccine demand. In: Fourth International Conference on Natural Computation; 2008 Aug; Jinan. China: IEEE Explore; 2008; 107-11. Available: <http://tinyurl.com/m9wqwhu>. (Accessed: Dec, 2012).
22. Cunha J, Krebs LS, Barros E. Vacinas e imunoglobulinas: consulta rápida. Porto Alegre: Artmed; 2009.
23. Crabb C. Developing countries overstate vaccination coverage. Bull World Health Organ 2003; 81(11): 851.
25. Fedson DS. Pandemic Inluenza and the global vaccine supply. Clin Infecti Dis 2003; 36(12): 1552–61.
26. World Health Organization (WHO). Immunization, Vaccines and Biologicals. Vaccine Management and Logistics - Logistics Support. Vaccine forecast and needs estimation. 2015. Available: <http://tinyurl. com/mzt3gyd>. (Accessed: Jan, 2015).
27. Mphatswe W, Mate KS, Bennett B, Ngidi H, Reddy J, Barker PM, et al. Improving public health information: a data quality intervention in KwaZulu-Natal, South Africa. Bull World Health Organ 2012; 90: 176-82.
28. Novaes MLO, Almeida RMV, Bastos RR, Novaes MM, Novaes LM, Afonso MW, et al. Wastage of Diphtheria, Tetanus, Pertussis and Haemophilus inluenzae type-b vaccine and its impact on the increase of dose costs. In: Pan American Health Care Exchanges [PAHCE 2011]; 2011 mar-28/apr-1; Rio de Janeiro (Br). Rio de Janeiro: PAHCE; 2011; 140-3. Available: <http:// tinyurl.com/lmum6x3>. (Accessed: Nov, 2012).
29. Brasil. Ministério da Saúde. Coordenação Geral do Programa Nacional de Imunizações. Datasus. Manual do Sistema de Informação do Programa Nacional de Imunizações - SIINIP - 2014. Available: <tinyurl.com/ n3o6m84> 2014. [Accessed: Oct/2014].
30. Ledikwe JH, Grignon J, Lebelonyane R, Ludick S, Matshediso E, Sento BA, et al. Improving the quality of health information: a qualitative assessment of data management and reporting systems in Botswana. Health Res Policy Syst 2014; 12(7): 1-10.
31. Doherty J. Cost-efectiveness analysis for
priority-setting in South Africa - What are the possibilities? S Afr Med J 2010; 100(12): 816-21.
32. Anwar F, Shamim A. Barriers in adoption of health
information technology in developing societies. International Journal of Advanced Computer Science and Applications 2011; 2(8): 40-5.
33. Turban E, Leidner D, McLean E, Wetherbe J. Information technology for management: transforming organizations in the digital economy. 7th ed. New
Jersey: John Wiley & Sons; 2010.
34. Mushi HP, Mullei K, Macha J, Wafula F, Borghi J, Goodman C, et al. The challenges of achieving high training coverage for IMCI: case studies from Kenya and Tanzania. Health Policy Plan 2011; 26: 395-404.
Received on: 11/12/2014