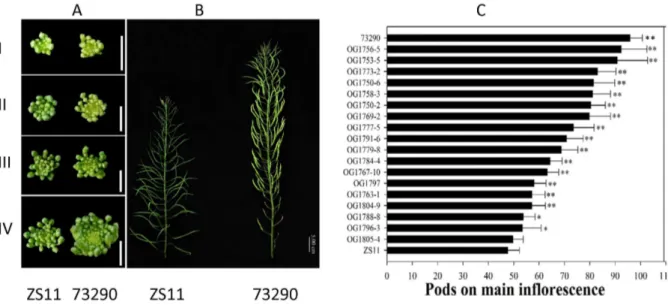
Microarray expression analysis of the main inflorescence in Brassica napus.
Texto
Imagem

Documentos relacionados
Admitindo-se a hipótese de que a religião é por excelência fonte de redes e recursos através das quais os actores sociais partilharem credos, narrações míticas e simbólicas
With the elements of K determined for mESC proliferation and transition between patterns of allelic Nanog expression and the single-cell gene expression model in place, we proceeded
To determine the expression of p53, p16 and Ki-67 and its relevance in survival and cell differentiation and compare the results of combined and isolated
Primarily, the tumor suppressor gene expression was assigned to genes involved in the control of strategic points of the chain of events related to cell growth and
In line with that, microarray stud- ies of gene expression during trypomastigote (a non-di- viding stage) to amastigote differentiation also identified several genes encoding
The dendrogram constructed through the NTSYS- pc software using the Jaccard coefficient separated the isolates in two groups according to the isoesterase and protein
Manoel João Pedreiro Rua de Santa Catarina (LT) Prédio da Companhia Industrial de Portugal e Colónias 25 de Outubro de 1922 Enviado para o Tribunal de Defesa Social
Using data from a microarray analysis of gene expression along a time course of differentiation (Figure S1A) [22], we analyzed the linear chromosomal distribution of co-regulated
