www.biogeosciences.net/bg/2/61/ SRef-ID: 1726-4189/bg/2005-2-61 European Geosciences Union
Biogeosciences
The Environment Recording Unit in coral skeletons – a synthesis of
structural and chemical evidences for a biochemically driven,
stepping-growth process in fibres
J. P. Cuif1and Y. Dauphin2
1Universit´e Paris XI-Orsay, Bat. 504 G´eologie , 91405 Orsay, UMR IDES, France
2Universit´e Paris VI-UPMC, Micropal´eontologie, case 104, 4 place Jussieu, 75252 Paris cedex 05, UMR IDES, France Received: 31 August 2004 – Published in Biogeosciences Discussions: 29 September 2004
Revised: 1 February 2005 – Accepted: 21 February 2005 – Published: 25 February 2005
Abstract. This paper gathers a series of structural and bio-chemical in situ characterizations carried out to improve our knowledge of the fine scale growth patterns of fibres in coral skeletons. The resulting data show a clear correspondence between the mineral subunits of fibres and the spatial distri-bution of organic macromolecules. New observations using atomic force microscope confirm the close relationship be-tween mineral and organic phases at the nanometre scale.
Synthesis of these data results in a significant change in our concept of the mineralization process in coral skeletons. In contrast to the usual view of an aggregate of purely min-eral units independently growing by simple chemical precip-itation, coral fibres appear to be fully controlled structures. Their growth process is based on cyclic secretion of miner-alizing compounds by the polyp basal ectoderm. These bio-chemical components of the coral fibres, in which sulfated acidic proteoglycans probably play a major role, are repeat-edly produced (proteoglycans are those glycoproteins whose carbohydrate moieties consist of long unbranched chains of sulfated amino sugars). This results in a stepping growth mode of fibres and a layered global organization of coral skeletons.
Therefore, in contrast to the widely accepted geochemical interpretation, we propose a fibre growth model that places coral skeletons among the typical “matrix mediated” struc-tures. The crystal-like fibres are built by superimposition of few micron-thick growth layers. A biomineralization cycle starts by the secretion of a mineralizing matrix and the final step is the crystallization phase, during which mineral mate-rial grows onto the organic framework. Thus, each growth layer is the actual Environment Recording Unit.
Correspondence to:J. P. Cuif ([email protected])
From a practical standpoint, these results may contribute to develop a new high resolution approach of the environ-ment recording by coral skeletons.
1 Introduction
Various chemical and/or isotopic proxies have placed coral skeletons among the most important sources of environmen-tal information but, surprisingly, no agreement exists about the formation of these widely used biological archives. The process by which the basal ectoderm of coral polyps pro-duces the underlying skeleton was first controversial in the late 19th century when, in contrast to the von Heider’s the-ory (1881), it was recognized that calcification does not oc-cur within the ectodermal cells themselves. Extracellular calcification occurring outside the ectodermal cell layer, as advocated by von Koch (1882), gained general agreement. Since then, the level of biological control over coral skele-ton remains an unsolved question. As summarized by Le Tissier (1991), models of calcification in corals range from a pure physicochemical (Barnes, 1970) to a biologically con-trolled process (Johnston, 1977, 1980).
2.47
2.45 2.49 2.51 2.53
cystine C-S-S-C
2.47
2.45 2.49 2.51 2.53
C-S-04 chondroitin
sulfate 2.4825
energy (keV) energy (keV)
2.47
2.45 2.49 2.51 2.53
2.4825
2.47
2.45 2.49 2.51 2.53
methionineC-S-C
2.473
H-S-C cysteine
Ca-S-04 mineral sulfate a
b
c
d
Fig. 1. Differences between XANES spectra from four sulfur or-ganic bounds and sulfur in a calcium sulfate. Not only is the edge energy significant, but also the “near edge” oscillation: mineral and organic sulfates are clearly different.
accessible, the complexity of coral skeletons prevents easy access to the interface compartment. Extraction of mineral-izing fluids to study their compositions and mineralmineral-izing ca-pabilities was carried out in Molluscs as early as 1974–1976 (Wada and Fujinuki, 1974, 1976). To date, no equivalent re-search exists for corals. The first pH measurement at the in-terface between the basal ectoderm and the growing surface of a coral skeleton was only attempted in 2003 (Al-Horani et al., 2003).
Therefore, instead of a direct analysis of the mineralizing sites, complete decalcification of coral skeletons providing access to organic materials entrapped during skeletal growth has been much more used. This resulted in a series of papers emphasizing the importance of, either sugars (Wainwright, 1963; Wilfert and Peters, 1969; Dauphin, 2001), or amino acids (Young, 1971, 1973; Mitterer, 1978; Constantz and Weiner, 1988; Cuif et al., 1999). Nevertheless, as pointed out by Johnston (1980), research dealing with the biochem-ical composition of organic materials extracted from coral skeletons has resulted in mineralization models made “in ignorance of this material’s spatial distribution and micro-architecture within the skeleton”.
Moreover, additional uncertainty persists with respect to the amount of these organic components. Since Wain-wright (1963), the fraction of organic material embedded in the coral skeletons has been commonly estimated at 0.1% of weight, a proportion recently re-evaluated to about 1% (Co-hen and McConnaughey, 2003). Thermogravimetric mea-surements (Cuif et al., 1997) indicate that 2.5 to 3% of weight of coral skeletal carbonate was lost prior to the thermal de-composition of aragonite. Such discrepancies cast doubts on the actual influence of these organic compounds on the crys-tallization process.
In response to Johnston’s remark, this paper brings to-gether a series of data based on a different approach. High
Fig. 2.Three different aspects of the same group of coral fibres.(a)
Morphology of fibres on a fracture surface of a corallite (Favia
stel-ligera).(b–c): Ultra-thin section observed in polarized light. Fibres are groups of subunits with overall similar behaviour with respect
to polarization directions (orientation of the yellow arrow).(d)
As-pect of the same skeletal sector after polishing and acidic etching. Overall organization of fibres is still recognizable, but growth layers have been made visible by synchronous differences in sensitivity to dissolution. The coordinated changes in thickness and spacement of growth layers become visible, allowing a precise description of fibre growth to be made.
resolution analytical instruments (scanning electron mi-croscopy, synchrotron X-ray fluorescence and atomic force imaging) now allow in situ physico-chemical characteriza-tion of coral skeleton units at the micrometric and nanometric levels. Combining these data results in a new set of informa-tion about structure and composiinforma-tion of the skeletal units, the crystal-like fibre, and allows the reexamination of the calci-fication process itself.
2 Material and methods
2.1 Materials
Corallites belonging to the following species have been used: Favia stelligera(Moorea Island, Polynesia); Montas-trea curta(Mururoa Island, Polynesia; J. P. Chevalier coll.);
Diploastrea heliopora, Leptoria phrygia, Porites cf. aus-traliensis, Acropora digitifera, Merulina scabricula (New Caledonia lagoon);Caryophyllia smithifrom Mediterranean Sea; Cladocora caespitosa (Mediterranean Sea, Marseille coastal region);Favia fragum(Guadalupe Island, Carribean). 2.2 Methods
2.2.1 Structural and chemical characterizations
Microstructural features of fibres were first checked by mi-croscopic observation of ultra-thin sections in polarized light. Ultra-thin sections, an improvement of the usual petro-graphic techniques, require fine polishing of the sample sur-face and a reduced thickness of slides. Instead of the standard 30 microns, grinding is continued to 4–5 micrometers thick-ness, allowing the primary colours of aragonite to be visible. Final polishing of the upper surface ensures an accurate mi-crostructural observation in polarized light.
2.2.2 Scanning Electron Microscopy (SEM)
Observations were carried out not just on simple fractured surfaces but more often on polished and etched surfaces. Etching by very light acidic solutions (one per mil formic acid with addition of glutaraldehyde 3 to 5%) or enzymatic solutions reveals that differences in solubility do exist within the crystal-like fibres. Additionally, the overall organization of coral septa is well shown, by emphasizing the trace of the early mineralization zones (commonly called “centres of cal-cification”).
2.2.3 X-ray Absorption Near Edge Spectrum (XANES) characterization and mapping of sulfated polysaccha-rides
At the European Synchrotron Radiation Facility in Greno-ble (France), the ID-21 instrument is a high resolution X-ray fluorescence detector. A high performance X-ray monochro-mator allows a very precise wavelength selection between 3 and 8 keV. This makes possible to select the energy bounds corresponding to different oxidation states of a given ele-ment. To characterize the sulfur state in coral skeletons, a calibration phase allows the different XANES spectra from sulfated standard molecules to be clearly separated (Fig. 1a to d). Sulfur in sulfated amino acids (methionine and cysteine), disulfur bonds in cystine and sulfated sulfur in chondroitin sulfate provides distinct spectra from both peak absorption wavelength and the XANES sectors of the absorption spec-trum. This allows to characterize the state of organic sul-fate in situ. High performance focussing lenses allow this
Fig. 3. From morphology to elemental growth layer in aPorites
skeleton. (a–b)Morphology ofPoritescf.australiensiscorallite.
(c)Longitudinal view of a vertical unit. (d)Radial disposition of
fibres in a vertical unit.(e)Ultra-thin slide in a vertical unit: radial
disposition of fibre fans is well visible. This is a typical example of what led numerous authors to emphasize the similarity of coral
fibres with abiotic crystallisations.(f)Etching of the fractured
sur-face in thePoritescorallite, reveals the fibre growth layers.
characterization to be obtained with sub-micron spatial res-olution. A two-dimensional piezo-electrically driven speci-men holder makes possible a micron-level displacespeci-ment of the sample polished surface, resulting in a biochemical map of the skeletal structure.
2.2.4 Atomic Force Microscopy (AFM)
Scanning probe microscopy encompasses a family of tech-niques that measures surface topography and properties at an atomic scale. The atomic force microscope simultaneously produces maps the surface topography (height images or de-rived amplitude images) and phase images. In phase imag-ing, a variant of tapping mode, the phase lag of the cantilever oscillation relative to the signal sent to the cantilever’s piezo driver is used as a basis for image generation. Phase images can be generated as a consequence of variations in material properties such as composition, visco elasticity, adhesion. AFM observations were conducted with Digital Instruments (Veeco) Nanoscope III Dimension 3100 at room temperature and air. The probe consisted of a cantilever with integrated Si3N4tips (Digital Instruments). Micron scale images were acquired using tapping mode.
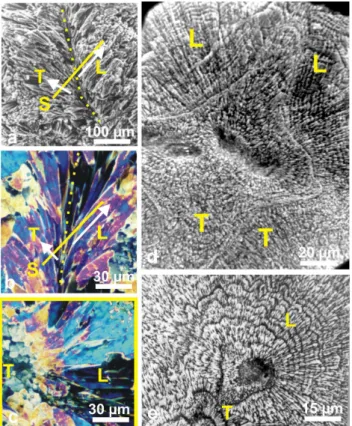
Fig. 4.Diversity of fibre directions on a corallite section, and
conse-quences on the observation of etching results.(a)Symmetrically
di-verging fibres on both sides of a septum median plan (yellow dotted
line). (b)Diverging fibres observed in thin slides, polarized light.
Here the fibre fan-system is observed on a longitudinal (axial) sec-tion. The yellow line S corresponds to the perpendicular section (c,
below). (c)This yellow framed view illustrates what is seen when
the orientation of the section corresponds to the yellow line of (b). Depending on their orientation, fibres may appear transversely (T) or longitudinally (L) cut. On the left side, fibres appear as polygonal units because they are transversely cut (T on this picture and the S line of picture b). On the right side, fibres are longitudinally cut (L).
(d–e)On the etched surfaces, fibre growth layers are well visible in
longitudinal sections only: (d)Leptoria phrygia; (e)Diploastrea
heliopora.
3 Results
3.1 The incremental growth mode of fibres
SEM observation and ultrathin sections of coral fibres ob-served in polarized light allow to check their common char-acteristic: they appear as groups of elongated units (Fig. 2a) with a monocrystalline behaviour (Fig. 2b–c). However, etching of this polished surface reveals a completely differ-ent pattern. Differences in solubility result in a series of lines that demonstrate the incremental growth of fibres (Fig. 2d). This result is exemplified here by aPorites cf. australien-siscolony (Fig. 3a–b). The fractured skeletal rod (Fig. 3c) shows the radial organization of fibres (Fig. 3d). An
ultra-Fig. 5. Synchronism of growth layers in a septum ofFavia stel-ligera. Growth of fibres is coordinated at an overall level that sug-gests a synchronism in mineralizing activity of the polyp ectoder-mal cell layer. EMZ=Early Mineralization Zone: at the distal tips of the microstructural units, calcification is initiated by specific struc-tures that exhibit microstructural and compositional patterns (see also Fig. 7d).
thin section (Fig. 3e) confirms the monocrystalline behaviour of fibres, whereas the concentric growth lines are well visible after etching (Fig. 3f).
To date, no exception is known to this micron-scaled in-cremental growth of coral fibres. Attention must be drawn to the fact that the appearance of the stepping growth pattern depends on the orientation of the fibres with respect to the observation surface. It has long been recognized that tridi-mensional arrangements of fibres are complex and very dif-ferent among corals from various families. With respect to growth direction (Fig. 4a, white arrows) the fibres are overall oblique to the septal median plan or growth axes. Conse-quently, within a given surface (Fig. 4b, line S), fibres may appear under different sections between two extreme condi-tions exemplified in Fig. 4c: from longitudinal (L) to trans-verse sections (T). Figures 4d and e show equivalent SEM pictures, in which appearance of the incremental growth pat-tern depends on the orientation of fibres.
3.2 Global coordination of growth increments
2.45 2.47 2.49 2.51 2.53
intensity
S aminoacids
2.473
a b
2.45 2.47 2.49 2.51 2.53
intensity
energy (keV) energy (keV)
Diploria
Acropora
Early Min. Zone
Fibres Porites sulfate
2.482
sulfate 2.482
organic sulfate
organic sulfate
S aminoacids
2.473
Fig. 6. Responses of polished surfaces in corallites ofDiploria labyrinthica,Acropora digitiformisandPoritescf.australiensisto a 2.4825 keV X-ray beam. In all cases a strong signal of organic sulfates is detected, whatever the location of the X-ray beam on the corallite surface, including the Early Mineralization Zones (the “centres of calcification”). In contrast, no response is obtained for S amino acids.
(Fig. 5a–c). Such a concentric growth pattern shows that thickening of septa is ensured by superimposition of growth layers that result from a global coordination of the biominer-alization process on wide areas of the basal ectoderm. Ad-ditionally, Fig. 5c also shows that the series of superimposed growth layers surrounds regions that exhibit a distinct mi-crostructural pattern. These regions correspond to the distal tips of septa, the regions where the calcification is initiated. These early mineralization zones (Fig. 5c: EMZ) are the long controverted domains called “centres of calcification” (Cuif and Dauphin, 1998).
3.3 XANES mapping: layered distribution of sulfate within fibres
All polished surfaces exposed to the 2.4825 keV X-ray en-ergy produce a strong signal corresponding to the presence of organic sulfated polysaccharides (Fig. 6). In contrast, sul-fated amino acids are practically undetectable. To take the full advantage of the ID-21 mapping device, a preliminary exploration of the surface is useful. Figures 7a to c show part of a polished section (wall and septa) in aMontastrea
corallite exposed to UV light (365 nm) on a reflection micro-scope, allowing the EMZ zones to be localized (Fig. 7c: red arrows). The 2.4825 keV beam is then applied to this sector, the distance between measurement points and lines being one micron. Time exposure for each point is 0.8 s.
This results in the map of sulfate (Fig. 7d), between EMZ and fibres. Presently no precise quantification is possible, owing to the heterogeneity of the biogenic mineral that does not allows any calculation concerning the absorbed/emitted radiations. However, the higher concentration of sulfated sul-fur in EMZ is well visible, as well as the banding patterns of sulfated sulfur in the fibrous part of the field view (arrows).
Very comparable results are obtained on corallites from other species: Diploria labyrinthica(Fig. 8a–d),Poritescf.
Fig. 7. Mapping of sulfated polysaccharides inMontastrea curta.
(a) Morphology of the corallites. (b) Specimen in the sample
holder. (c)Selection of the region to be mapped by UV
fluores-cence: the Early Mineralization zones show a strong response (red
arrows).(d)Biochemical map of the selected zone. The Early
Min-eralization Zones exhibit a high sulfated polysaccharide concentra-tion. In fibres, the well visible banding pattern in exact confor-mity with fibre growth layers (arrows) shows that mineral phase and sulfated polysaccharides are associated at a submicrometer scale within fibres.
Fig. 8. Growth layers and sulfated polysaccharide distribution in
Diploastrea labyrinthica. (a)Morphology of growing edges of
septa built by a simple series of conical units. (b)At the tip of
conical units, the Early Mineralization Zone (EMZ) surrounded by
the beginning of fibrous zone.(c)Etched section, showing the
con-centric growth layers surrounding the EMZ.(d)XANES mapping
of organic sulfur provides a very comparable pattern.
3.4 Heterogeneity of fibres at the nanometric scale
AFM examination confirms that fibres are not homoge-nous structures at the submicrometer scale. Pictures of
Merulina scabricula are particularly significant. Densely packed nanograins are well visible (Fig. 10a–b). Looking more closely (Fig. 10c–d), the grains seem coated by a thin layer (Fig. 10d). Due to the effectiveness of AFM phase imaging to detect physico-chemical properties, we can as-sess that the thin layer on the grain surfaces (Fig. 10c, ar-rows) is different from the grains themselves with respect to its chemical composition (Fig. 10d). Remarkably, simi-lar pictures have been obtained on skeletons of every studied species, and at any place in the fibrous structures of each specimen (Fig. 11a–b: Favia stelligera; Fig. 11c–d: Clado-cora caespitosa; Fig. 11e–f:Caryophyllia smithi).
These results show that: (1) a nanometric granular struc-ture is the basic organization of the fibre growth layers and (2) the fibrous tissue is basically heterogenous: the few tenth to hundred nanometre grains are included within a material that exhibits specific physico-chemical properties.
Fig. 9. Microstructural patterns and corresponding XANES
map-ping of organic sulfate on polished surfaces inPoritescf.
australien-sis(a–b)andAcropora digitifera(c–d).
4 Discussion
From McConnaughey (1989) to Sinclair and McCul-loch (2004), geochemical interpretations have usually con-sidered that coral aragonite is produced by a simple crystal-lization process occurring in a fluid of which composition is “close to sea water”. In this model, biological activity is limited to “enzymatic ion transport” of Ca2+
that creates the required conditions of supersaturation for CaCO3 precip-itation. In this concept, no mention is made of the skele-tal organic compounds. Their role in the crysskele-tallization pro-cess and their possible influence on Ca-carbonate composi-tion due to their chemical activity are not taken into account. Clearly, as emphasized by Johnston (1980), absence of sig-nificant information about the distribution of the “organic matrix” has long remained a major obstacle to progress in understanding its importance.
4.1 Organic matrix at the nanoscale: consistency of AFM data with Johnston’s results
Fig. 10. AFM images of skeletal nanograins inMerulina
scabric-ula. Amplitude images (aandc) and phase images (bandd) show
the dual composition of skeletal grains. Phase imaging reveals the importance of the very weak relief that can be seen on (a) and (c) pictures of the grain surfaces (arrows). The very high contrast pro-duced by these structures demonstrates that they are basically differ-ent, from a chemical standpoint. The XANES in situ characteriza-tion of sulfated polysaccharides at a submicron scale fully supports the interpretation of this high phase-contrast material as an organic coating of skeletal grains.
the preparation process used for transmission electron mi-croscopy.
On the AFM pictures, dimensions of the nanograin’s en-velopes (Figs. 10–11) remarkably correspond to those of the organic network cells in the Johnston’s pictures. This dimen-sional correspondence supports the hypothesis of an organic nature for the material separating nanograins within fibres, as already suggested by the interactive properties of this ma-terial in AFM phase imaging (in this technique, black means “attractive”).
Owing to the used preparation process utilized, Johnston was able to characterize the organic network only in the up-permost 3µm. at the top of the fibres. Therefore he sug-gested that the organic network might “disappear” in the deeper parts of the skeleton. Three different results con-tribute to disprove this suggestion. (1): no change is visi-ble in AFM nanograin envelopes far deeper than Johnston thought, even at more than one centimeter below the sep-tal growth surface (several hundreds of superimposed growth layers). (2): etching shows that the layered organization of skeletons remains visible all along the fibre length (e.g. Fig. 4). (3): the XANES signal indicating sulfated sulfur is obtained on the whole surface of coral sections, whatever the distance to the growing surface.
Fig. 11.Equivalent AFM amplitude and phase pictures from
coral-lite belonging to three species:(a–b)Favia stelligera;(c–d)
Clado-cora caespitosa;(e–f)Caryophyllia smithi. Note that surface topog-raphy remains rather unprecise on height images (a, c, e), but phase imaging (b, d, f) provides clear information about the basic gran-ular structure, that has been found in all coral skeletons observed to-date.
Particular attention should be paid to the XANES sul-fated sulfur signal because sulfur in coral skeletons has long been reported (see Milliman, 1974). It was variously inter-preted: as small amounts of CaSO4 (Milliman), as sulfate ions (Takano et al., 1980) or sulfite (Bar-Matthews, 1993) substituting for CO3anions. The suggestion that S might be a component of mineralizing matrices have also been made (Blake and Peacor, 1981; Mackenzie et al., 1983). Apply-ing the XANES method to a variety of inorganic and organic carbonates, Pingitore et al. (1995) noted the “specificity and exclusivity” of XANES spectra but, following the interpreta-tion of Takano et al. (1980), they supported the mineralogical interpretation of SO4ions being substituted for CO3.
Fig. 12. 2-D electrophoretic characterization of sulfated polysac-charides and protein compounds from coral skeletons. Alcian blue staining of acidic sulfated polysaccharides shows that, after isoelec-tric focussing has established their low isoelecisoelec-tric point (pI), most of them remain included in the first dimension strip gel. This shows that their molecular weights exceed 300 kD, the upper molecular weight accepted by the gel.
skeletons is now well established by Alcian Blue staining of 2-D electrophoresis gel (Dauphin, 2001). Not only the organic nature of sulfate is thus established, but the very high molecular weight of the sulfated polysaccharides is also demonstrated, as well as their highly acidic composition (Fig. 12). Additionally, in contrast to Pingitore’s interpre-tation based on punctual XANES spectra only (without any microstructural data), XANES maps show a layered distribu-tion of sulfated sulfur. These properties are very consistent with a possible role of sulfated polysaccharides in fibre min-eralization.
4.2 “The hypothesized organic matrix mediation of crystal growth (Johnston, 1977; Jackson and Gladfelter, 1985) is difficult to support”
This statement (Constantz, 1986, p. 155) illustrates Le Tissier’s comment (Le Tissier, 1991) about the diversity of biomineralization models for coral fibres. A major obsta-cle to progress in this question was the difficulty to connect microstructural data showing the layered organization within coral fibres (and numerous other biominerals: Cuif et al., 1981, 1997) to chemical of biochemical data obtained at the corresponding scale.
By microprobe analysis, microstructure-linked differences in sulfur concentrations were shown in the septa of a number of coral species (Cuif and Dauphin, 1998), drawing attention to the specific chemical properties of the “centres of calci-fication”. Located at growing tips of septa, they initiate the mineralization process (early mineralization zones: EMZ). The XANES maps fully confirm this biochemical difference between the EMZ and the ectoderm zones that produce fi-bres.
Once the biochemical difference between EMZ and fibres is well established, attention must be focussed to the XANES maps that prove the equivalence between the distribution of
F1 F2 F3
F1 F2 F3
Matrix secretion
Matrix orientation Mg
Ca-carbonate crystallisation
a b c d
Polyp basal ectoderm
N+1 growth layer
Fig. 13. Scheme of a growth layer formation in a coral skeleton, summarizing the structural, chemical and biochemical data. F1, F2, F3: upper mineralized layers in three adjacent fibres; arrows: over-all crystover-allographic orientations.
organic sulfate and the mineral growth layers (Cuif et al., 2003). This correlation implies that, within each growth layer, organic components are associated with the mineral phase itself at a submicron scale. The AFM data discussed above (4.1), provide us with an explanation of this intriguing correlation between organic matrix and mineral layers. Actu-ally, relationships between mineral and organic components have to be established and understood at the nanometre scale. Clode and Marshall (2002) have clearly shown a network of organic filaments that creates a link between the outer face of ectodermal cells and the upper surface of aragonite fibres. Their conclusion concerning the potential role of this net-work in the biomineralization process is fully supported par the AFM pictures.
From a quantitative stand point, recent results of ATG measurements coupled to infrared spectrometry (Cuif et al., 2004) have confirmed that 2.5–3% of the coral skeleton weight is lost before thermal decomposition of aragonite. Additionally, these measurements have shown the dual ori-gin of these weight losses. About 0.8 to 1% by weight (de-pending upon species) is due to loss of organic material prop-erly speaking, a result that supports the estimation presented by Cohen and McConnaughey (2003). The other part of the weight loss is due to water linked to organic molecules.
analysis suggest that water is directly associated to sulfated polysaccharides at the molecular scale. From the same quan-titative point of view, it must also noted that a 2.5–3% ra-tio in weight for the hydrated organic compounds indicates that even assuming a high density for this hydrated organic phase (i.e. 1.5), we can estimate that about 5–7% of the skele-ton volume is made of non-carbonate components (aragonite density: 2.99). As a first approach, this result also appears rather consistent with the spatial ratio between organic mate-rial and nanograins in AFM pictures.
4.3 A polycyclic model for the growth of the coral fibres The structural and chemical data reported here can be sum-marized by a simple model of the growth layer formation (Fig. 13).
At the starting point of a biomineralization cycle, the basal ectoderm of the polyp is in close contact with the upper sur-faces of fibres (Fig. 13a: F1 to F3), each of them having its c axis in overall conformity with elongation of each fibre (note that orientation of a and b axes differs from fibre to fibre – see Fig. 2).
4.3.1 Organic secretion and formation of the matrix frame-work
Although the physiology of matrix secretion is thoroughly studied (see Tambutt´e, 1996; Allemand, 2004 for review), molecular organization outside the ectodermal layer is still poorly understood. Chromatographic and electrophoretic characterizations of coral matrices have emphasized the im-portance of acidic, high molecular weight glucidic com-pounds (Dauphin, 2001; Dauphin and Cuif, 1997). The abil-ity of molecules of this biochemical family to produce poly-meric structures is known and relevant to their potential role in the first step of the biomineralization cycle. Radiometric methods have also shown the presence of low weight pep-tides (Puverel, 2004). This complex blend of high molecular weight sulfated sugars and acidic proteins with medium to low molecular weight suggests that within the mineralizing compartment (outside the ectodermal cells) a self-assembly process may occur, resulting in a chemically active organic framework. The historical observation by Goreau (1956) of a glucidic layer on the external side of the basal ectoderm of the polyp along with the network of organic filaments recently observed by Clode and Marshall (2002) using cry-ofracturing methods may correspond to this secretory/ poly-merization step.
This self-assembly step may also be a relevant way to ex-plain the overall crystallographic continuity of fibres. Cy-tological observations by transmission electron microscopy (Tambutt´e, 1997) have shown the complex arrangement of the ectodermal cells, “frequently overlying each other” (Clode and Marshall, 2003, Fig. 1). No correspondence ex-ists between a given fibre and the cells of the basal ectoderm:
thus the crystallographic continuity of fibres cannot directly result from the organization of ectodermal cells. At the be-ginning of the biomineralization cycle, the macromolecular assemblage is secreted in close contact with the upper sur-face of aragonite fibres facing the basal ectoderm. Numer-ous observations (Mitterer and Cunningham, 1985; Hazen et al., 2001) have demonstrated the interactivity between Ca-carbonate crystal surfaces and organic molecules. Thus, the crystal lattice of fibres may act as a template during the first step of the self-assembly process, resulting in the orienta-tion of the matrix organic framework in conformity with the crystallographic orientation of each of the underlying fibres (Fig. 13b).
4.3.2 Crystallization within the matrix framework
To create Ca-carbonate nanograins, calcium is actively trans-ported through the cells of the basal ectoderm to the subec-todermal space. Membrane sites involved and biochemical mechanisms have now been identified (Tambutt´e et al., 1995; Marshall, 1996; Zoccola et al, 2004). On the other hand, many analyses have shown that both glucidic and protein ma-trix components have compositional peculiarities favouring interaction with mineral ions. Glucids are sulfated and very acidic in composition (Dauphin, 2001), along with the as-partic/glutamic rich proteins (Mitterer, 1978; Constantz and Weiner, 1988). Taking into account the low isoelectric point of matrix components (the pH of the solution in which a given organic molecules is neutral), mineral ions certainly found numerous sites for fixing onto the organic framework (Clode and Marshall, 2003).
In this crystallization step, the polymeric organic frame-work may play a major role, being responsible for the po-sition of the initial crystallization sites. Thus, after having been oriented by the underlying mineral surface, the organic framework itself may ensure the crystallographic coherence of the nanograins, an essential requirement for maintaining the overall crystallinity of fibres. From this standpoint, it is worthwhile to note that a close SEM examination of fibres (Fig. 14a) shows that the monocrystalline status of fibres is not so perfect than it could be expected if they were continu-ously growing purely mineral units, as proposed in the Bryan and Hill interpretation (Bryan and Hill, 1941).
Within the mineralizing layer, growth of mineral units progressively reduces the space available for the hydrated organic material secreted in the first step of the biominer-alization cycle. At the end of this crystallization process, the organic phase simply appears as a cortex surrounding nanograins (see Fig. 10a–b).
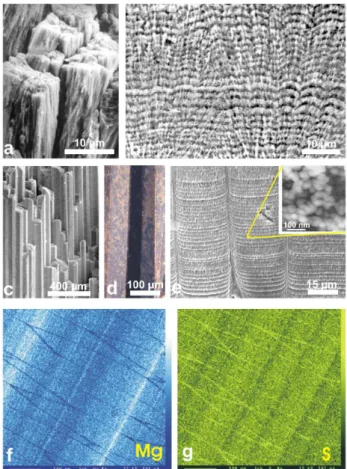
Fig. 14.Similarity between the fine structure of coral fibrous tissue and a typical “matrix mediated” mollusc microstructure: the
pris-matic layer ofPinna nobilis. (a)Close view of coral fibres: each
fibre is not a single crystal but a cluster of elongated subunits with
similar polarizing behaviour (see Fig. 2). (b)Polished and etched
surface in the fibrous zone of a coral skeleton: fibre subunits are still
visible but the dominant pattern is the stepping growth mode.(c, d,
e)Morphology, ultra-thin slide (polarized light) and etching surface
in thePinnaprismatic shell layer. Calcitic prism morphology (c) is
more precisely defined than coral fibres, due to their strong organic envelope. Monocrystalline behaviour (d) of the prisms is also better marked. However, an obvious similarity with the fine structures of
coral fibres appears after etching (e). (f–g)Microprobe maps of a
longitudinal section of thePinnaprismatic shell layer. Note the fine
layering of minor element distribution, the high contrast between successive growth layers. Also remarkable is the independence in concentration changes between the two elements (Microprobe maps by C. T. Williams, NHM London).
growth layers. A comparison can be made between the coral fibre and the most classic of these polycyclic biocrystals: the calcitic prisms of Pinna nobilis, a pteriomorphid Pele-cypod. The following points emphasize the similarity of the growth process between the molluscan prisms and coral fi-bres (Fig. 14).
– The micronic stepping growth mode (now proved also in fossil corals: Stolarski, 2003) is common to both
microstructures, with quite comparable patterns. The mean thickness of growth units and crystallographic co-ordination demonstrate a similar overall control. – In both cases growth layers are built by nanograins. – From a biochemical standpoint, hydrated
glycoconju-gate components are present at a nanometre scale in both structures and exhibit the same spatial relation-ships (for XANES pictures ofPinnaprisms see Dauphin et al., 2003).
4.4 Relevance of the polycyclic model of coral fibre to re-cent fine scale chemical and isotopic measurements During recent years, numerous studies have shown that prox-ies deriving from mineralized skeletons do not give us a very reliable information. Various discrepancies have been re-ported between environmental conditions and values mea-sured on biological carbonates (Allison et al., 2001; Finch et al., 2003). When measurements are made using high res-olution devices, chemical variability within a given spec-imen exceeds what can be explained by the influence of some physiological process, i.e. photosynthesis in reef corals (Rollion-Bard et al., 2003). Moreover, these unexpected vari-ations also occur within deep sea corals (Blamart, 2002; Ad-kins et al., 2003). Obviously they are linked to the biomin-eralization process itself. Application of simple thermody-namic laws cannot provide us with an accurate interpretation of the environmental signal (Juillet-Leclerc, personal com-munication), and a new strategy (Lough, 2003) is now re-quired.
To illustrate the rapid compositional changes that may oc-cur in successive growth layers of polycyclic biominerals, comparison with the Pteriomorphid PelecypodPinna nobilis
can be continued. In thePinnaprisms, microprobe maps of Mg and S (Fig. 14f–g) exemplify the variability in chemical composition between successive growth layers. The chem-ical layering strictly corresponds to the microstructural pat-tern and, moreover, concentration changes are different for the two mapped elements: sulfur varies independently of magnesium. Clearly, in contrast to common opinion, biolog-ical regulation of growth cannot prevent various influences to be recorded in the composition of growth layers. Although no equivalent document exists for coral skeletons, experi-ments have shown that mineralizing activity is very sensitive to physico-chemical conditions such as pH (Marubini et al., 2002).
Fig. 15. From corallite morphology to skeletal nanograins of a septal growth layer inFavia stelligera. Measurements now possible at the
micrometre range impose a good understanding of the skeletal features. (a–b)corallite (a) and septum growth edge (sight of the top);(c)
scheme of superimposed growth layers (EMZ: early mineralization zones);(d)tiny isodiametric crystals in EMZ;(e)microstructure in the
median part of a septum (F: fibre zone after etching);(f–g)scheme of growing surface with basal ectoderm (see also Fig. 13);(h)nanometre
structure of a fibre growth layer.
recording units) variations between individual growth layers are probably still higher than reported in recent papers. Only the NanoSIMS method approaches the relevant measurement level.
Interestingly, the first mapping experiment applying the NanoSIMS method to coral fibrous tissues (Meibom, 2004) has produced a result that provides additional support to the hypothesis for a biological control on the crystallization pro-cess in corals. A layered Mg signal has been observed, re-peatedly produced within each fibre growth layer, a result that allows suggesting a role for Mg in regulation of the crys-tallization process.
No doubt that until recently, the resolution of sampling methods was not adequate for the scale at which environ-mental information is recorded through biomineralization. Figure 15 summarizes the different structural level in coral skeletons. To develop the “new strategy” (Lough, 2003), this needs to be elaborated to improve the use of corals as envi-ronmental archives. A detailed understanding of the biomin-eralization process is a prerequisite. Precise relationships be-tween environmental conditions and compositions in a given biomineral layer need to be established. Reciprocally, sig-nals recorded within each skeletal growth layer acting as the Environment Recording Unit have to be measured at an ap-propriate scale.
5 Conclusions
1. Coral fibres are built by superimposition of a few micron-thick growth layers.
2. Growth layers are made of mineral nanograins densely packed within an organic component.
3. Concentric growth patterns visible within a given skele-tal unit indicate that the growth process is coordinated at an overall scale by polyp physiology.
4. Due to cyclicity in the biomineralization process, each growth layer acts as an “Environment Recording Unit”.
Acknowledgements. The authors would like to thank three anony-mous reviewers, and D. Sinclair (GEOTOP, Montreal) for helpful
comments on the BGD version. We thank also J. E. Sorauf,
A. Meibom (Museum National d’Histoire Naturelle, Paris) and the BGD Acting Editor for editing the final BG version.
Edited by: J. Bijma
References
Adkins, J. F., Boyle, E. A., Curry, W. B., and Lutringer, A.: Stable isotopes in deep-sea corals and a new mechanism for vital effects, Geochim. Cosmoch. Acta, 67, 1129–1143, 2003.
Allemand, D., Ferrier-Pages, C., Furla, P., Houlb`eque, F., Puverel, S., Reynaud, S., Tambutt´e, E., Tambutt´e, S., and Zoccola, D.: Biomineralization in reef-building corals: from molecular mech-anisms to environmental control, C. R. Palevol., 3, 453–467, 2004.
Allison, N., Finch, A. A., Sutton, S. R., and Newville, M.: Strontium heterogeneity and speciation in coral aragonite: im-plications for the strontium paleothermometer, Geochim. Cos-mochim. Acta, 65, 2669–2676, 2001.
Bar-Matthews, M., Wasserburg, G. J., and Chen, J. H.: Diagene-sis of fossil coral skeletons: Correlation between trace elements,
textures and234U/238U, Geochim. Cosmoch. Acta, 57, 257–276,
1993.
Barnes, D. J.: Coral skeletons: An explanation of their growth and structure, Science, 170, 1305–1308, 1970.
Blake, D. F. and Peacor, D. R.: Biomineralization of crino¨ıd echin-oderma, Characterization of skeletal elements using TEM and STEM microanalysis, Scanning Electr. Microsc., 3, 321–328, 1981.
Blamart, D., Cuif, J. P., and Juillet-Leclerc, A.: O-stable isotopes distribution in deep-sea corals from SIMS measurements, 27th Gen. Ass. Eur. Geophys. Soc., Geophys. Res. Abstr., 4, EGS02-A-01713, Nice 21–26, April 2002.
Bryan, W. H. and Hill, D.: Spherulitic crystallization as a mech-anism of skeletal growth in the hexacorals, Proc. Roy. Soc. Queensland, 52, 78–91, 1941.
Clode, P. L. and Marshall, A. T.: Low temperature FESEM of the calcifying interface of a scleractinian coral, Tissue & Cell, 34, 187–198, 2002.
Clode, P. L. and Marshall, A. T.: Calcium associated with fib-rillar organic matrix in the scleractinian coral Galaxea fasci-cularis, Protoplasma, 220, 153–161, doi:10.1007/s00709-002-0046-3, 2003.
Cohen, A. L. and McConnaughey, T. A.: Geochemical perspective on coral mineralization, in: Biomineralization, Reviews in Min-eralogy and Geochemistry, 54, edited by: Dove, P. M., de Yoreo, J. J., and Weiner, S., Mineralogical Society of America, Wash-ington DC, 151–187, 2003.
Constantz, B.: Coral Skeleton Construction: a Physiochemically dominated Process, Palaios, 1, 152–157, 1986.
Constantz, B. and Weiner, S.: Acidic macromolecules associated with the mineral phase of scleractinian coral skeletons, J. Exp. Zool., 248, 253–258, 1988.
Cuif, J. P., Denis, A., and Gaspard, D.: Recherche d’une m´ethode d’analyse ultrastructurale des tests carbonat´es d’Invert´ebr´es, Bull. Soc. g´eol. Fr., 9, 28, 525–534, 1981.
Cuif, J. P., Dauphin, Y., Denis, A., Gautret, P., Kiyashko, S., and Massault M.: Facteurs de la diagen`ese pr´ecoce des biomin´eraux: exemple d’un polypier de Porites de Nouvelle Cal´edonie, Geo-bios, MS 20, 171–179, 1997.
Cuif, J. P. and Dauphin, Y.: Microstructural and physico-chemical characterization of “centres of calcification” in septa of some re-cent Scleractinian corals, Pal. Zeit., 72, 257–270, 1998. Cuif, J. P., Dauphin, Y., and Gautret, P.: Compositional diversity
of soluble mineralizing matrices in some recent coral skeletons compared to fine-scale growth structures of fibres, Discussion of consequences for biomineralization and diagenesis, Int. Journ. Earth Sci., 88, 582–592, 1999.
Cuif, J. P., Dauphin, Y., Doucet, J., Salom´e, M., and Susini, J.:
XANES mapping of organic sulfate in three scleractinian coral skeletons, Geochim. Cosmochim. Acta, 67, 75–83, 2003. Cuif, J. P., Dauphin, Y., Berthet, P., and Jegoudez, J.:
Associ-ated water and organic compounds in coral skeletons: quantita-tive thermogravimetry coupled to infrared absorption spectrome-try, Geochemisspectrome-try, Geophysics, Geosystems, Res. Lett., 5–11, Q 2004, doi:10.2004GC000783, 2004.
Dauphin, Y.: Comparative studies of skeletal soluble matrices from some Scleractinian corals and Molluscs, Int. J. Biol. Macromol., 28, 293–304, 2001.
Dauphin, Y. and Cuif, J. P.: Isoelectric properties of the soluble matrices in relation to the chemical composition of some Scler-actinian skeletons, Electrophoresis, 18, 1180–1183, 1997. Dauphin, Y., Cuif, J. P., Doucet, J., Salom´e, M., Susini, J., and
Williams, C. T.: In situ mapping of growth lines in the cal-citic prismatic layers of molluscs shells using X-ray absorption near edge structure (XANES) spectroscopy at the sulphur k-edge, Mar. Biol., 142, 299–304, 2003.
Finch, A. A., Allison, N., Sutton, S. R., and Newville, M.: Stron-tium in coral aragonite: 1. Characterization of Sr coordination by extended absorption X-ray fine structure, Geochim. Cosmochim. Acta, 67, 1189–1194, 2003.
Gaffey, S.: Water in skeletal carbonates, J. Sedim. Petrol., 58, 397– 414, 1988.
Goreau, T.: Histochemistry of mucopolysaccharide-like substances and alkaline phosphatase in Madreporaria, Nature, 177, 1029– 1030, 1956.
Goreau, T. F.: The physiology of skeleton formation in corals, I. A method for measuring the rate of calcium deposition by corals under different conditions, Biol. Bull., 116, 59–75, 1959. Hazen, R. M., Filley, T. R., and Goodfriend, G. A.: Selective
ad-sorption of L- and D-amino acids on calcite: implications for biochemical homochirality, PNAS, 98, 5487–5490, 2001. Johnston, I. S.: Aspect of a skeletal organic matrix and the process
of skeletogenesis in the reef coral Pocillopora damicornis, Proc. third Int. Coral Reef Cong., Brisban, 2, 301–320, 1977. Johnston, I. S.: The ultrastructure of skeletogenesis in hermatypic
corals, Inter. Rev. Cytology, 67, 171–213, 1980.
Le Tissier, M. D’A. A.: The nature of the skeleton and skeletoge-netic tissues in the Cnidaria, Hydrobiogena, 216/217, 397–402, 1991.
Lough, J. M.: A strategy to improve the contribution of coral data to high-resolution paleoclimatology, Palaeog. Palaeocl. Palaeoecol., 204, 115–143, 2003.
Marshall, A. T.: Calcification in hermatypic and ahermatypic corals, Science, 271, 637–639, 1996.
Marubini, F., Ferrier-Pages, C., and Cuif, J. P.: Suppression of skeletal growth in scleractinian corals by decreasing ambient carbonate-ion concentration: a cross-family comparizon, Proc. R. Soc. Lond., B 270, 179–184, 2002.
McConnaughey T.:13C and18O isotopic desequilibrium in
biolog-ical carbonates; I. Patterns, Geochim. Cosmoch. Acta, 53, 163– 171, 1989.
Meibom, A., Stage, M., Wooden, J., Constantz, B., Dunbar, R. B., Owen, A., Grumet, N., Bacon, C. R., and Cham-berlain, P.: Monthly Strontium/Calcium oscillation in sym-biotic coral aragonite: Biological effects limiting the preci-sion of the paleotemperature proxy, Geophys. Res. Lett., 30, doi:10.1029/2002GL016864, 2003.
Meibom, A., Cuif, J. P., Hillion, F., Constantz, B. R., Juillet-Leclerc, A., Dauphin, Y., Watanabe, T., and Dunbar, R. B.: Dis-tribution of magnesium in coral skeleton, Geophys. Res. Lett., 31, L23306, doi:10:10.1029/2004GL02313, 2004.
Milliman, J. D.: Marine Carbonates part, Springer-Verl. Berlin, 1375, 1974.
Mitterer, R. M.: Aminoacid composition and metal binding capabil-ity of the skeletal protein of corals, Bull. Mar. Sci., 28, 173–180, 1978.
Mitterer, R. M. and Cunningham Jr., R.: The interaction of natural organic matter with grain surfaces: implications for calcium car-bonate precipitation, in: Carcar-bonate cements, SEPM Spec. Publ., edited by: Schneidermann, N. and Harris, P. M., 36, 17–31, 1985. Pingitore, N. E., Meitzner, G., and Love, K. M.: Identification of sulfate in natural carbonates by X-ray absorption spectroscopy, Geochim. Cosmoch. Acta, 59, 2477–2248, 1995.
Puverel, S.: La biomin´eralisation chez les coraux scl´eractiniaires, Etude de la matrice organique et des transports ioniques, Th`ese Univ. Nice, 167, 2004.
Rollion-Bard, C., Blamard, D., Cuif, J. P., and Juillet-Leclerc, A.: Microanalysis of C and O isotopes of azooxanthellate and zoox-anthellate corals by ion microprobe, Coral Reefs, 22, 405–415, 2003.
Sinclair, D. J. and McCulloch, M. T.: Corals record low mobile bar-ium concentrations in the Burdekin River during the 1974 flood: evidence for limited Ba supply to rivers?, Palaeog. Palaeocl. Palaeoecol., 214, 155–174, 2004.
Stolarski, J.: Three-dimensional micro- and nanostructural charac-teristics of the scleractinian coral skeleton: A biocalcification proxy, Acta. Paleont. Pol., 48, 497–530, 2003.
Takano, B., Asano, Y., and Watanuki, K.: Characterization of sul-fate in travertine, Contrib. Mineral. Petrol., 72, 197–203, 1980. Tambutt´e, E., Allemand, D., Bourge, I., and Jaubert, J.: An
im-proved Ca45 protocol for investigating physiological mecha-nisms in coral calcification, Mar. Biol., 122, 453–459, 1995. Tambutt´e, E.: Processus de calcification d’un Scl´eractiniaire
her-matypique, Stylophora pistillata (Esper, 1797), Th`ese Univ. Nice, 247, 1996.
von Heider, A.: Die Gattung Cladocora Ehrenb, Sitzungber. d. K. Akad d. Wiss. Wien, 44, 707–735, 1881.
von Koch, G.: Ueber die Entwicklung des Kalkskeletes von As-troides calycularis u. dessen Morphologische Bedeutung, Mitth. Zool. St. Neapel, 3, 284–292, 1882.
Wada, K. and Fujinuki, T.: Physiological regulation of shell forma-tion in Molluscs, I. Chemical composiforma-tion of extrapallial fluids, Bull. Natl. Pearl Res. Lab., 18, 2085–2110, 1974.
Wada, K. and Fujinuki, T.: Biomineralization in bivalve molluscs with emphasis on the chemical composition of the extrapallial fluid, in: The Mechanisms of Mineralization in the Invertebrates and Plants, edited by: Watabe, N. and Wilbur, K. M., The Belle W. Baruch library in Marine Science, 5, 175–190, 1976. Wainwright, S. A.: Skeletal organization in the coral Pocillopora
damicornis, Quart. J. micr. Sci., 104, 169–183, 1963.
Wilfert, M. and Peters W.: Vorkommen von Chitin bei Coelenter-aten, Z. Morph. Tiere, 64, 77–84, 1969.
Young, S. D.: Organic materials from scleractinian coral skele-tons, I Variation in composition between several species, Comp. Biochem. Physiol., 40B, 113–120, 1971.
Young, S. D.: Calcification and synthesis of skeletal organic ma-terial in the coral Pocillopora damicornis (L.) (Astrocoeniidae, Scleractinia), Comp. Biochem. Physiol., 44A, 669–672, 1973. Zoccola, D., Tambutt´e, E., Kulhanek, E., Puverel, S., Scimeca, J.