I.J.M.G.E., University of Tehran, Vol. 46, No. 1, June 2012, PP. 15-19 15
A Method to Determine the Ball Filling, in Miduk Copper
Concentrator SAG Mill
Ali Kamali Moaveni1, Mohammad Noaparast2*and Bahram Rezai3
1M.Sc. of Mineral Processing, Science and Research University of Tehran, Iran
2Professor, School of Mining Eng., University College of Eng., University of Tehran, Tehran, Iran,
3Professor, Mining and Metallurgy Eng. Faculty, Amir Kabir University, Tehran, Iran
(Received 5 March 2011, Received in Revised form 27 June 2011, Accepted 28 November2011)
Abstract
The aim of this research work was to investigate on the ball filling estimation of Miduk semi-autogenous (SAG) Mill via an utilized method. Miduk copper concentrator is located in Kerman Province, Iran, and its size reduction stage includes one gyratory crusher which feeds one SAG mill (9.75 dia.(m)*3.88 length(m)) following two parallel ball mills (5dia.(m)*7lenght(m)). After SAG mill, a trommel screen produces two over and under size materials which the oversize part is circulated into SAG mill and undersize reports to hydrocyclone for further process. Ball filling identify was implemented in this work using mill`s load sampling and ball abrasion test.
These methods could estimate ball filling variation with easy, undeniable, and useful tests. Also, these tests have shown the digression of operating ball filling amount and its manual designed. To make more homogenous load, mill load samplings were carried out from 6 points after whirling the mill via inching motor. Acquired load sampling results were compared with ball abrasion tests. Ball abrasion tests were calculated for 3 different conditions include maximum, average, and minimum ball abrasion. However, the calculated maximum and minimum conditions never occurred. However, these are just for obtaining to ball filling variation in the mill. The results obtained from this workshow, the ball filling percentage variation is between 1.2– 3.7% which is lower than mill ball filling percentage, according to the designed conditions (15%). In addition, acquired load samplings result for mill ball filling was 1.3%.
Keywords:Miduk Copper Concentrator, SAG Mill, Ball Filling Percentage
Introduction
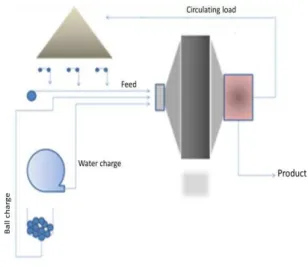
Semi-autogenous (SAG) mills are presently one of the most widely used alternatives in the field of mineral size reduction, as a result of their comparative advantages, such as higher processing capacity, lower physical space requirements, and lower investment and maintenance costs, as compared to conventional circuits. However, these large pieces of equipment show greater complexity in terms of their operation and control. These SAG milling plants (Figure 1) are designed with few pieces of equipment having a large processing capacity, replacing advantageously a large battery of traditional crushers and rod and ball mills. These characteristics make SAG mills an excellent example of critical equipments whose continuous and stable operation is essential to guarantee mineral processing plant profitability [1].
16 I.J.M.G.E., University of Tehran, Vol. 46, No. 1, June 2012
As a result, ball filling strongly affects on grinding rate, internal load retention time, product fractions, specific power draw, and mill performance. Therein, load density and ball filling percentage in semi-autogenous mill and its effect on the mills power draw is of great value.
There exist several ways to calculating ball filling such as drawing out whole internal mill load, taking photographs from load surface and distributing load surface results to whole mill load and mill load sampling. However, sometimes due to plant condition limitations, some of these ways are impossible.
A simple equation (Equation 1) exists for load percentage calculation that belongs to mill diameter (��) and distance between top point in the mill and load surface (H) [5-7]. This equation is profitable for determining of whole mill load volume which is included stony and metallic balls.
Mill load (%) = 113.7 - 127.3 H
Dm
(1) where H is the height of top of the balls to under the mills liners (m), and Dm is the
mills diameter (m).
Unfortunately, it is not possible to empty the mill from its stony load by stopping belt feed conveyor to utilize the mentioned equation. As a result, if this process is done over a long period of time, the liners will be severely damaged. Another way for estimating the ball filling percentage is to draw out mill`s internal load, and calculate the weight of ball part and stony part, separately. However, maybe this method will be unusable due to its operational hardship such as grate opening. Miduk copper concentrator is located in Kerman Province, Iran, and its size reduction stage includes one gyratory crusher which feeds one SAG mill (9.75 dia.(m)*3.88 length(m)) following two parallel ball mills (5dia.(m)*7lenght(m)). The aim of this research work was to investigate on the ball filling estimation of Miduk semi-autogenous (SAG) Mill via an utilized
method. Miduk SAG Mill circuit is shown in Figure 1.
Figure 1: Diagram of Miduk Copper Complex SAG Mill
Methods
The following methods were utilized in this research work for ball filling calculation. To fulfill this aim, three approaches were investigated.
- Surface load photograph, - Internal load sampling, - Ball abrasion test,
To identify the amount of load sampling errors, the ball abrasion test was done via marked balls. Ball abrasion test was selected due to its relationship with mill ball filling percentage.
Surface Load Photograph
Mill load had not been heterogeneous after turning it off, because of the mill rotational movement and density differences between metallic balls and stony load. As a result, the mill was spun slowly via the inching motor in order to get a more homogenous internal load. Then, the surface load was meshed. Due to some photographing height difficulties and lack of suitable spaces, for taking appropriate photographs, mesh size were selected as 120 centimeters.
A Method to Determine... 17
they are covered by mud, and secondly using this method can enter large errors to ball filling calculation due to ragged load surface. In the other words, it was not possible to distribute surface load data to the whole load.
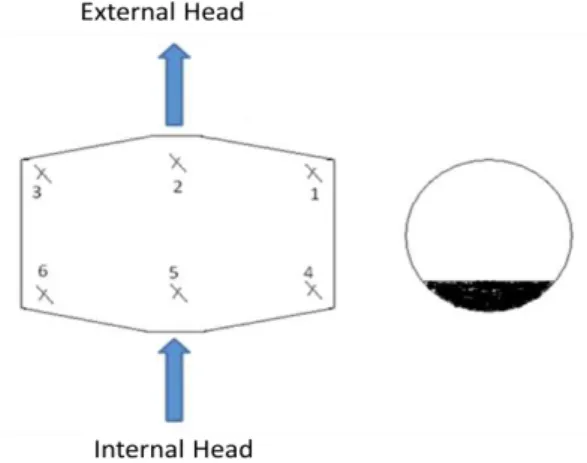
Figure 2: Mill load sampling location
Internal Load Sampling
First of all, the mill was rotated via inching motor as previously mentioned and, samples were collected from 6 points in the mill (e.g. Figure 6). The samples were rectangular cube shape having a 0.4 m3 (1*1*0.4 m3) in size. Following this, each sample was divided to two parts. One part was the stony load and another was the ball load of each sample. Each part was weighed and the ball filling percentage of each sample was accordingly calculated. The sampling points are shown in Figure 2.
Ball Abrasion Test
100 balls were marked with two lines on each of them, weighed and fed into the mill. After 8 days, 12 marked balls were voided from the mill and weighed.
Results
Acquired Results from Mill load Sampling
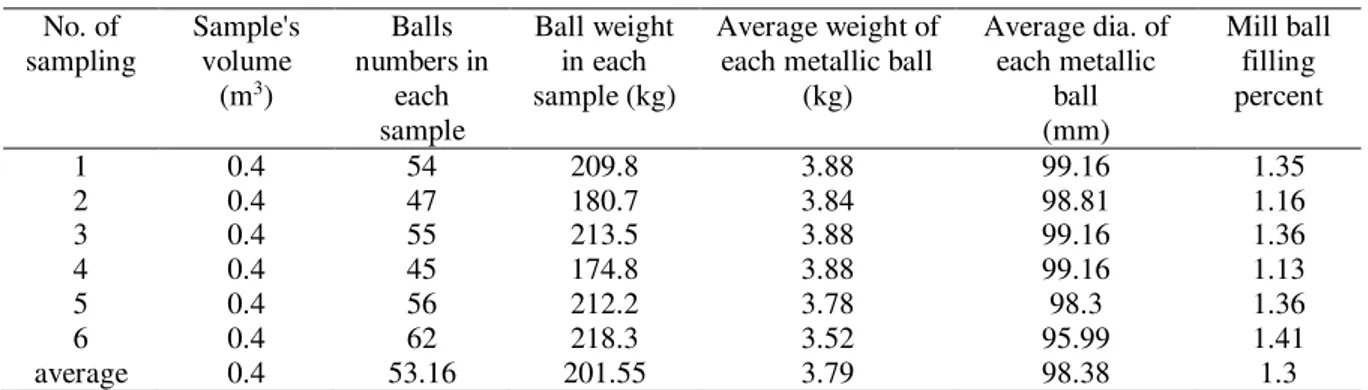
Acquired mill load samples were weighed metallic and stony parts, separately. Therefore, ball filling percentage was determined in each sample and distributed whole mill`s load. Sampling results are illustrated in Table 1; in these computations mill volume and
total mill internal load, Equation 2, during the test have been calculated as 297.96 m3 and 19.55%, respectively.
Mill internal load volume (m3) =
(19.55*297.96)/100 = 58.52 m3
(2) Ball volume in total mill load could compute by Equation 3.
Mill Ball (%) = 100{[(ball volume in the 0.4 m3 sample)* 58.52] / 0.4}/297.96
(3) According to the results (Table 1), the ball filling percentage was obtained 1.3%. However, these results may have some field errors.
Acquired Results from Abrasion Test
Ball abrasion was calculated in 4 conditions which are as follows:
- Ball charge program, - Average ball abrasion, - Maximum ball abrasion, - Minimum ball abrasion.
The aim of carrying out such conditions was to locate the variation of ball filling in the mill.
Ball Charge Program Abrasion
In this section, ball abrasion was calculated via manufacture`s ball charge program. At the time of this research, mill ball charged, feed rate, and average moisture were 7 tons (ball size was 100 mm) per week, 720 t/h and 5%, respectively. Then, ball abrasion rate was calculated by Equations 4, 5 and 6.
Total mill feed per week = 720*24*7*0.95= 114912 tons
(4) Total ball charge per week = 7*106 g
(5)
Ball abrasion rate = (7*106/114912) = 60.9 g/ton
18 I.J.M.G.E., University of Tehran, Vol. 46, No. 1, June 2012
Table 1: Acquired load sampling results
No. of sampling
Sample's volume
(m3)
Balls numbers in
each sample
Ball weight in each sample (kg)
Average weight of each metallic ball
(kg)
Average dia. of each metallic
ball (mm)
Mill ball filling percent
1 0.4 54 209.8 3.88 99.16 1.35
2 0.4 47 180.7 3.84 98.81 1.16
3 0.4 55 213.5 3.88 99.16 1.36
4 0.4 45 174.8 3.88 99.16 1.13
5 0.4 56 212.2 3.78 98.3 1.36
6 0.4 62 218.3 3.52 95.99 1.41
average 0.4 53.16 201.55 3.79 98.38 1.3
Average Ball Abrasion
For calculating of the average ball abrasion, average weight of balls after abrasion test was deduced by average balls weight before abrasion. At first, ball filling in the mill was spot 1% and the number of balls in mill was estimated as shown below (Equations 7, 8 and 9).
��= 4335.44-3636.78=698.66 g
(7) � =vm.fb.
vb =
. ∗ .
. =
(9)
�t= N. Ab = × . =
. g
(8)
Dry mill feed tonnage during 8 days which ball abrasion test was performed with 5% moisture was calculated 131328 tons. Therefore, ball abrasion rate in the mill determined by Equation 10.
A� =AFt= . = . g/ton
(10)
In above equations:
�m: total mill volume (m3), �: number of
balls which exist in mill, ��: each ball abrasion (g), �t: total ball abrasion in the mill (g), �b: each ball volume (m3), �b: supposed ball filling percentage, Ar: ball
abrasion rate in the mill.
If above calculation were done again for �b= 2%, total ball abrasion will get 60.96,
finally. The second one is not acceptable, because the balls went out from the mill which have diameter less than 12000 ��
(12000 �� is trommel screen opening). Therefore, the calculated ball abrasion cannot be equal to ball charge program. As a result ball filling percentage can be between 1% and 2%.
Maximum Ball Abrasion
In this section, the smallest ball weight after abrasion test was deduced from average balls weight before the test. At first the calculations were done for 1% mill ball filling.
�� = .
� =
�t = . × = . g
A� = . = . g/ton
With doing the above calculations for 2% ball filling, the ball abrasion will get 97.08 which is greater than the abrasion with ball program charge. So it is not acceptable.
Minimum Ball Abrasion
The largest ball weight after abrasion test was deduced from average balls weight before the test. At first the
calculations were done for 1% mill ball filling.
�� = .
� =
�t = . × = g
A� = = . g/ton
A Method to Determine... 19
charge abrasion and not acceptable. So the ball filling is less than 4% in this section.
Results and Discussion
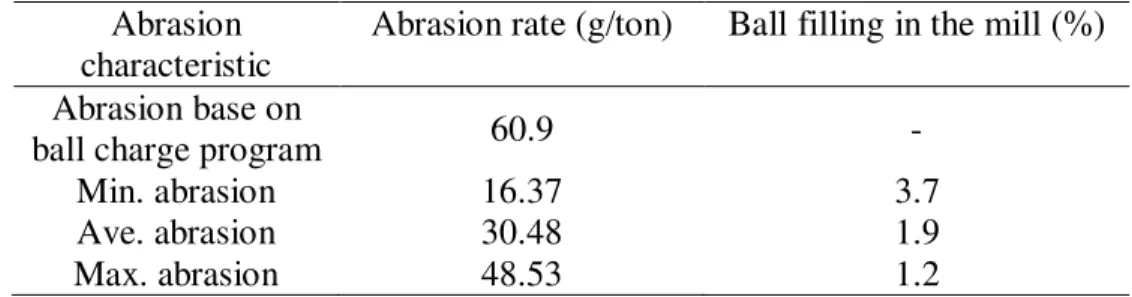
Finally, mentioned equations were solved via Excel Software Solver and results of ball filling percentage were summarized and illustrated in Table 2. As it shown in Table 2 the variation of ball filling by abrasion test was acquired between 1.2 and 3.7 and ball filling percentage via mill load sampling was calculated 1.3%. As it was mentioned previously, maximum and minimum are illustrated just the bounds of ball filling percentage variation.
Conclusions
- Mill ball filling percentage is considerably lower than that of mentioned in the manual (15%).
- Ball filling variation was identified via ball abrasion test and it shows the digression from manual designed.
- This research refers an appropriate method to calculate maximum and minimum ball filling where mill discharging takes long time and faced much hardship.
Acknowledgment
The authors would thank Sarcheshmeh Research and Development Mineral Processing Management Center of NICICO for all supports in this work.
Table 2: Ball filling results
Abrasion characteristic
Abrasion rate (g/ton) Ball filling in the mill (%)
Abrasion base on
ball charge program 60.9 -
Min. abrasion 16.37 3.7
Ave. abrasion 30.48 1.9
Max. abrasion 48.53 1.2
References
1 - Concha, F., Magne, L. and Austin, L.G. (1992). “Optimization of the make-up ball charge in a grinding mill.” International Journal of Mineral Processing, Vol. 34, No.3, PP. 231– 241.
2 - Su, Z.G. and Wang, P.H. (2009). “Improved adaptive evidential k-NN rule and its application for monitoring level of coal powder filling in ball mill.” Journal of Process
Control, Vol. 19, PP. 1751-1762.
3 - Toraman, O. Y. and Katircioglu, D. (2009). “A study on the effect of process parameters in stirred ball mill.”Advanced Powder Technology.
4 - Pontt, J. (2004). “MONSAG: A new monitoring system for measuring the load filling of a SAG mill.”Minerals Engineering, Vol. 17, PP. 1143-1148.
5 - Bond, F.C. (1961). “Crushing and Grinding Calculations, Parts I and II.”British Chemical
Engineering, Vol. 6, No.6, PP. 378-385 and 543-548.
6 - Kelly, E.J. and Spottiswood, D.J. (1989). “Introduction to Mineral Processing.” Mineral Engineering Services, Denver.