The 5-CNL Front-of-Pack Nutrition Label
Appears an Effective Tool to Achieve Food
Substitutions towards Healthier Diets across
Dietary Profiles
Chantal Julia1,2
*, Caroline Méjean1, Sandrine Péneau1, Camille Buscail1, Benjamin Alles1,
Léopold Fézeu1, Mathilde Touvier1, Serge Hercberg1,2, Emmanuelle Kesse-Guyot1
1Université Paris 13, Equipe de Recherche en Epidémiologie Nutritionnelle (EREN), Centre d'Epidemiologie et Biostatistiques Sorbonne Paris Cité (CRESS), Inserm U1153, Inra U1125, Cnam, COMUE Sorbonne-Paris-Cité, F-93017, Bobigny, France,2Département de Santé Publique, Hôpital Avicenne (AP-HP), F-93017, Bobigny, France
*c.julia@eren.smbh.univ-paris13.fr
Abstract
Background
Front-of-pack (FOP) nutrition labels are considered helpful tools to help consumers making healthier food choices, thus improving their diet. In France, the implementation of a FOP nutrition label–the 5-Colour Nutrition Label (5-CNL)–is currently under consideration. Our objective was to investigate dietary profiles in a French adult population using the 5-CNL, and to assess its potential impact in improving the diet through substitution of foods.
Methods and Findings
Subjects included in the NutriNet-Santé cohort, who had completed three 24-h dietary rec-ords were included in this cross-sectional analysis. Mutually exclusive clusters of individu-als were identified using the percentage of energy derived from foods of each of the 5-CNL colours as input variables. Three scenarios of substitution of foods for healthier alternative using the 5-CNL were tested. Food group and dietary intakes, socio-demographic and life-style data were compared across clusters using ANOVAs or Chi-square tests, as appropri-ate. We identified three mutually exclusive dietary profiles:‘Healthy’(N = 28 095, 29.3% of the sample), with high consumption of fruit, vegetables, whole cereals and fish;‘Western’ (N = 33 386, 34.8%); with high consumption of sweetened beverages, breakfast cereal, cheese, fatty and sugary foods;‘Traditional’(N = 34 461, 35.1%), with high consumption of potatoes, bread, meat and dairy desserts. Overall, substitutions strategies led to an increase in the number of subjects reaching the recommended intakes in energy, macro and micronutrients. Increases were particularly high in the‘Western’pattern for lipids and saturates intakes: from 16.2% reaching the recommended amount for lipids (13.5% for satu-rates) to 60.6% and 85.7% respectively.
a11111
OPEN ACCESS
Citation:Julia C, Méjean C, Péneau S, Buscail C, Alles B, Fézeu L, et al. (2016) The 5-CNL Front-of-Pack Nutrition Label Appears an Effective Tool to Achieve Food Substitutions towards Healthier Diets across Dietary Profiles. PLoS ONE 11(6): e0157545. doi:10.1371/journal.pone.0157545
Editor:Jacobus van Wouwe, TNO, NETHERLANDS
Received:January 15, 2016
Accepted:June 1, 2016
Published:June 20, 2016
Copyright:© 2016 Julia et al. This is an open access article distributed under the terms of the
Creative Commons Attribution License, which permits unrestricted use, distribution, and reproduction in any medium, provided the original author and source are credited.
Data Availability Statement:All relevant data are within the paper and its Supporting Information files.
Conclusion
The use of the 5-CNL as an indicator of food choice meaningfully characterizes clusters of dietary habits and appears as an effective tool to help improving the nutritional quality of the diet.
What This Paper Adds
What Is Already Known on the Subject
• In France, the introduction of the 5-Colour Front-of-pack Nutrition Label (5-CNL) is under
consideration. The 5-CNL is based on a nutrient profiling system and classifies foods into 5 categories of nutritional quality, from‘Green’to‘Red’.
• The 5-CNL has been shown to adequately classify foods according to their nutritional
qual-ity, and to help consumers understanding nutritional quality of foods and making healthier food choices.
• The contribution of each of the 5-CNL‘colour’foods in individual diets, as well as the
poten-tial impact of food substitutions using the 5-CNL on nutritional quality of the diet has not been investigated.
What This Study Adds
• Contribution of each‘colour’of the 5-CNL allowed for the identification of three dietary
pro-files:‘Healthy’,‘Western’and‘Traditional’
• The use of the 5-CNL for food substitutions strategies led to an increase in the number of
subjects reaching the recommended amounts in macro and micro-nutrients, with a more important impact for subjects with lower nutritional quality profiles, highlighting the poten-tial contribution of the 5-CNL to public health nutrition programs.
Introduction
Front-of-pack (FOP) nutrition labels have received growing attention from policy makers worldwide, as they are considered promising tools in public health nutrition [1,2]. The intro-duction of a FOP nutrition label is thought to help consumers making healthier choices in pur-chasing situations [2,3]. Moreover, it is believed that they would serve as incentives for manufacturers to reformulate their products towards healthier compositions [2,3]. Some west-ern countries have introduced FOP nutrition labels, the earliest adopters being Sweden in 1989 (Green Keyhole) [4], and more recently the Netherlands in 2006 (Choices) [5], or Australia and New Zealand in 2014 (Health Star Rating System) [6]. In France, the government has recently proposed to introduce a simplified FOP nutrition label [7] following a report to the Minister of Health in 2014 [8]. This label would complement the set of measures coordinated by the French Nutrition and Health Program (Programme National Nutrition Santé, PNNS), a nationwide program initiated in 2001 and aiming at improving health in the population by acting on one of its main modifiable determinants, nutrition [9]. The PNNS actions include population education and information through multimedia communication campaigns and dissemination of booklets, local initiatives of health promotion and modification of the
part in study design, collection, analysis, and interpretation of data and the writing of the article and the decision to submit it for publication. Researchers are independant from funders and sponsors. All researchers had access to all the data.
Competing Interests:The authors have declared that no competing interests exist.
environment (e.g. modification of the walkability of the built environment) and state-level reg-ulations [9]. The proposed label is based on the British Food Standards Agency nutrient profil-ing system (FSA score) currently used to regulate advertisprofil-ing of foods and beverages to children in the United Kingdom (UK) [10,11]. This nutrient profiling system provides a global assessment of the nutritional quality of foods and beverages, combining into one indicator sev-eral nutrients entering the composition of the food or beverage. Among the various nutrient profiling systems currently available, the FSA score has been estimated as one of the most vali-dated [12,13], and is currently serving as a basis for several public health initiatives, including the AustralianHealth Star Rating System[6]. The French proposal derives five categories of nutritional quality from the continuous FSA score, each associated with a different colour, from‘Green’for the highest nutritional quality category to‘Red’for the lowest nutritional
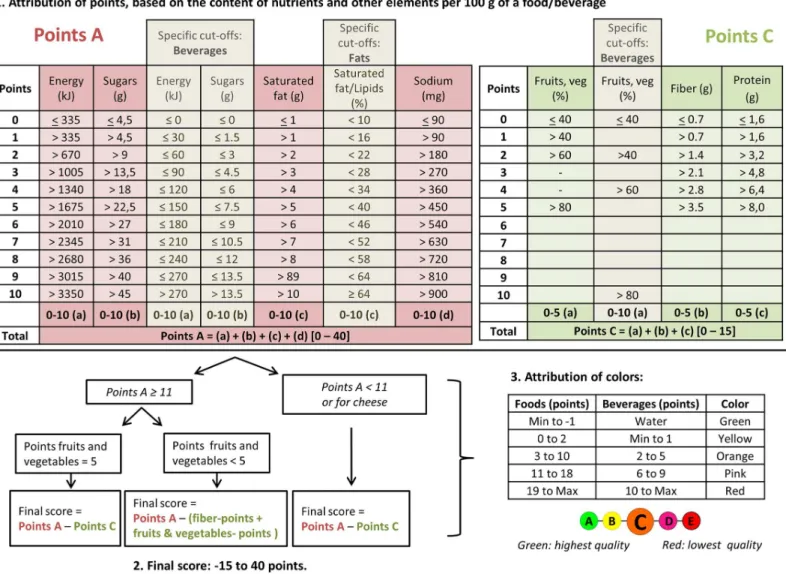
qual-ity category, representing the 5-Colour Nutrition Label, (5-CNL) (seeFig 1) [8].
Fig 1. FSA score computation and 5-CNL allocation.Footnotes: Exceptions were made for cheese, fat, and drinks to take into account their specific composition, consistently with nutritional recommendations. The percentage of fruits and vegetables was calculated taking into account fruits, legumes and vegetables as defined in the PNNS (the French nutritional and health policy). Tubers, oleaginous fruits, dried fruits and olives are therefore not considered in this computation. FSA score allocates different thresholds for fibers, depending on the measurement method used. We used NSP cut-offs to compute fibers score.
This approach, using a global indicator of nutritional quality, with an‘across-the-board’
application (i.e. the score computation is identical whatever the food group considered) has been found helpful to guide consumers’food choices toward food groups with higher
nutri-tional quality instead of low nutrinutri-tional quality groups (‘displacement’). It also allows
con-sumer to choose products with higher nutritional quality among the products from the same food group (‘substitution’).[14].
The application of the FSA score to foods in the French context indicated that the score could be used as a basis for a five-category system, provided marginal adjustments in a few food groups (beverages, cheese and fats) were made to maintain a high consistency with the French official nutritional recommendations [15]. Moreover, the use of the 5-CNL was shown to accurately discriminate the nutritional quality between food groups, within a food group and for similar products from different brands [16,17]. For example, vegetables and whole grains are mainly classified as‘Green’while chocolate products are mainly classified as‘Red’.
Moreover, in a given food group, for example breakfast cereals, oat meals are classified as
‘Green’while chocolate stuffed cereals are classified as‘Red’[17]. These elements confirms the
potential of the 5-CNL for the implementation of both‘displacement’and‘substitution’
strate-gies in individual diets.
However, the potential impact of the use of the 5-CNL label on individual diets has not been investigated. The heterogeneity in dietary behaviour observed in the population suggests that the use of the label, and therefore its impact, would also be heterogeneous. Identifying dietary profiles using the 5-CNL classification would allow investigating the potential impact of the 5-CNL across various dietary profiles.
Our objectives were therefore: 1) to identify dietary profiles according to the 5-CNL classifi-cation of the foods consumed; 2) to investigate the potential impact of the substitution of foods using the 5-CNL across dietary profiles through simulations. The highest possible gain in nutri-tional quality of the diet through the substitution of all foods was simulated, as well as a sce-nario involving the substitution of a fraction of the foods consumed. The overall aim was to assess the potential gain in the nutritional quality of the diet at the population level through this novel tool, in a public health perspective.
Material and Methods
Population
Participants were selected from the NutriNet-Santé cohort. Briefly, the NutriNet-santé study is a prospective cohort study set in France in which inclusion and follow-up of volunteer partici-pants are performed on the Internet [18]. The main objectives of the NutriNet-santé study are: 1) to investigate the relationship between nutrition and health outcomes; and 2) to investigate the determinants of dietary patterns and nutritional status. Inclusion in the study began in May, 2009, and is still ongoing. Volunteer participants aged>18 years-old subscribe to the study, and are included when they have completed a set of questionnaires assessing: diet (through repeated 24h dietary records), physical activity, anthropometry, lifestyle and socio-economic conditions and health status. Detailed information on the NutriNet-Santé study can be found elsewhere [18].
For the present study, all participants having completed three dietary records at baseline, with no under-reporting of energy intake [19] were included.
Ethics
Health and Medical Research (0000388FWA00005831) and theCommission Nationale de l’ In-formatique et des Libertés(908450 and 909216). Electronic informed consent was obtained from all participants. The Nutrinet-santé study is registered under EudraCT registration num-ber 2013-000929-31.
Socio-Demographic and Lifestyle Data
Socio-demographic and lifestyle data were collected at enrollment through self-administered questionnaires, including age, gender, education (no diploma and primary education, second-ary education, university, other), marital status (in couple, single/divorced/widowed), income per household unit [20] (<900, 900–1199, 1200–1799, 1800–2299, 2300–2699, 2700–3699, >3700€/month) and smoking status (current smoker, former smoker and never smoker).
Physical activity was computed using self-declared data from the International Physical Activ-ity Questionnaire, completed at baseline (low, moderate and high physical activActiv-ity levels) [21]. Self-reported weight and height were collected at baseline and were used to compute body mass index (WHO categories:<18.5, [18.5–25[, [25–30[,30kg/m2) [22].
Dietary Data
Dietary data were derived from three repeated 24-hour records at enrollment, randomly dis-tributed in a two-week period, with two week days and one week-end day. Food consumption was weighted according to the representativeness of the day of the week of each record in the whole diet (five days for a week day and two days for week-end days). Portion size for each reported food and beverage item was estimated by participants using validated photographs [23]. Nutrient intake was computed using a published food composition database structured for epidemiologic purposes and including 70 dietary compounds reflecting foods usually con-sumed in the French diet [24]. No information on brand or price of foods was included in the records. Under- reporters for energy intake were identified using Goldberg/Black’s method
and were excluded [19].
Score Computation, 5-CNL Allocation and Application to the Diet
Score computation. The FSA score for foods and beverages was computed taking into
account the nutrient content for 100g [11]. It allocates positive points (0–10) for content in
energy (KJ), total sugar (g), saturated fatty acids (g) and sodium (mg). Negative points (0–5)
are allocated to content in fruits, vegetables, legumes and nuts (%), fibers (g) and proteins (g). Scores for foods and beverages were therefore based on a discrete continuous scale from -15 (most healthy) to +40 (less healthy)(Fig 1).Modifications to the original score were used in order to ensure a higher consistency with French nutritional recommendations for dried fruits and nuts, beverages, cheese and added fats [25].
5-CNL allocation. Products were then classified into five categories, corresponding to the
5-CNL classification. The cut-offs to define the five categories of the 5-CNL were based on the independent reports conducted by the French Agency for Food, Environmental and Occupa-tional Health Safety (ANSES) and the High Council for Public Health (HCSP) [25,26], as fol-lows from higher nutritional quality to lower nutritional quality: for foods‘Green’(-15 to -1), ‘Yellow’(0 to 2),‘Orange’(3 to 10),‘Pink’(11 to 18) and‘Red’(19 and above); for beverages
‘Green’only for non-flavoured water and non-sugared hot beverages,‘Yellow’(Min to 1),
‘Orange’(2 to 5),‘Pink’(6 to 9) and‘Red’(10 and above) (Fig 1).
Dietary clusters. For each individual, the mean daily energy intake (excluding energy
Green-labelled foods’to‘energy from Red-labelled foods’. The five variables obtained were
used as input variables in a clustering procedure (SAS CLUSTER and FASCLUS procedures). The plot of the semi-partial R2, the semi-partial T2and the Cubic Clustering Criterion by the number of clusters were used to identify that a model with three mutually exclusive clusters of individuals was adequate.
Scenarios of Substitution
In order to investigate the potential impact of substitutions of foods using the 5-CNL, we mod-elled substitutions within food groups of similar use, using a gradual approach. Three scenarios of substitution were modelled, in order to highlight the potential gain in diet quality through substitution (S1 Fig). Food groups tested for the substitution are presented inS1 Table.
Simulation scenario n°1 substitution of all food for all healthier foods. In this first
sce-nario, foods classified in the highest nutritional quality class of the 5-CNL within a food group were considered not substituted. Foods and beverages classified in lower nutritional quality classes of the 5-CNL were substituted, and were attributed the mean nutritional values of all the healthier foods and beverages (e.g. Red-labelled foods were attributed the mean nutritional values of foods from the‘Pink’to the‘Green’classes). The initial quantity of the food was
retained. This scenario models the substitution from lower nutritional quality foods, as classi-fied in the 5-CNL to higher nutritional quality foods, with an even probability of choice for all foods in healthier classes of the 5-CNL. This scenario was used to investigate the highest nutri-tional gain possible through substitutions.
Simulation scenario n°2 substitution of all food for healthier foods in the adjacent class of
the 5-CNL. This second scenario is similar to the previous, but substituted foods were attributed
the mean nutritional values of foods in the immediately adjacent colour within a food group (e.g. Red-labelled foods were attributed the mean nutritional values of foods in the‘Pink’category).
Simulation scenario n°3 Scenario n°2 applied to 30% of foods. In this third scenario,
30% of foods were randomly selected in each 24h-record for each subject, and were applied the second scenario of substitution. This scenario, retaining a fraction of eligible foods for substitu-tion was considered as the most realistic in real-life settings.
Statistical Analysis
Sociodemographic, lifestyle, anthropometrics, food group consumption and nutrient intake were compared across clusters using ANOVAs or Chi-square tests, as appropriate. Energy-adjusted nutrient intakes [27] were compared across clusters. Percentages of subjects with ade-quate intakes (energy, lipids, carbohydrates, proteins, added sugars, saturates, fibers) according to French national recommendations were compared across clusters and scenarios of substitu-tion. Cut-offs for adequate intakes were determined using French national nutrition and health program objectives (Programme National Nutrition Santé, PNNS)[28] or recommendations from the French Agency for Food, Environmental and Occupational Health Safety (ANSES) [29] (SeeS2 Table). Basal metabolic rate and individual expenditure were computed using Schofield equations. Energy intakes<105% of expenditures were considered as adequate [30].
All tests were two-sided and a P value<0.001 was considered significant, given the high num-ber of statistical tests performed. Statistical analyses were performed using SAS Software (version 9.3, SAS Institute Inc, Cary, NC, USA). Figures were obtained using R software (version 3.0.3)
Results
the analysis. The sample included 78.1% of women, and the mean age of the sample was 43.1 ± 14.6 years old.
The clustering procedure identified three mutually exclusive groups of subjects (Table 1). In all clusters, the proportion of energy from foods from each colour category was>8% of total energy intake. Clusters were characterized and labelled according to the food group consump-tion patterns observed, as:‘Healthy’(N = 28 095, 29.3% of the sample),‘Western’(N = 33 386,
34.8%) and‘Traditional’(N = 34 461, 35.1%).
Socio-Demographic Characteristics
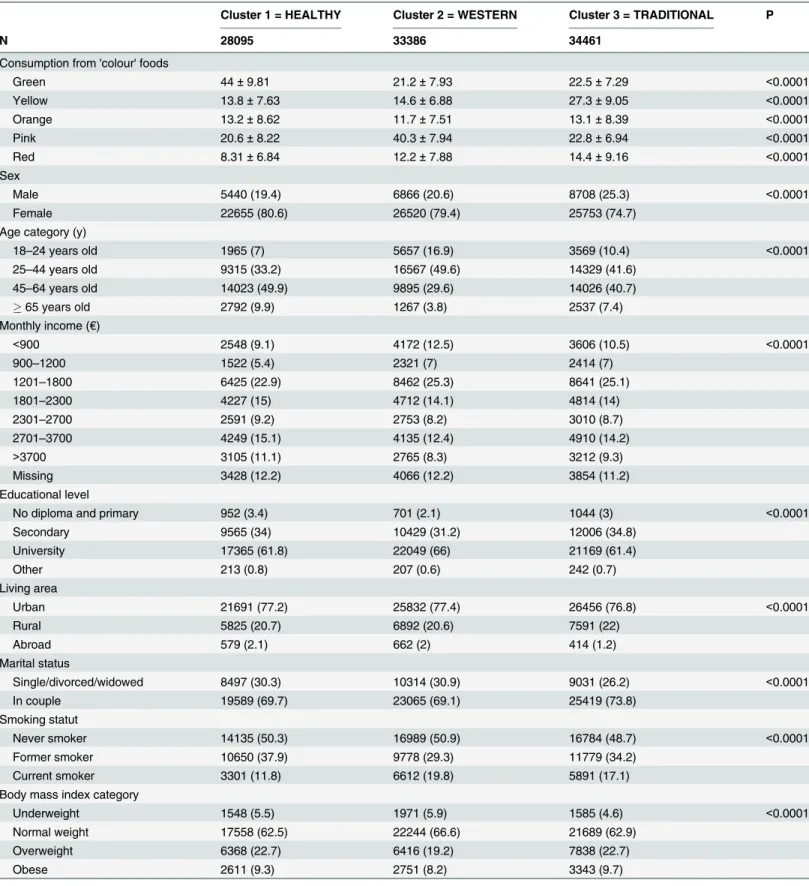
Subjects in the‘Traditional’pattern were more often men, middle-aged, with low incomes,
liv-ing in a rural settliv-ing, and were more likely overweight or obese (Table 1). Subjects in the‘
West-ern’pattern were younger, with low income and higher education (university students) and
were more often smokers (Table 1). Subjects in the‘Healthy’pattern were more likely women,
middle-aged, with high income, living in urban areas and former smokers (Table 1).
Food Consumption and Nutritional Intake
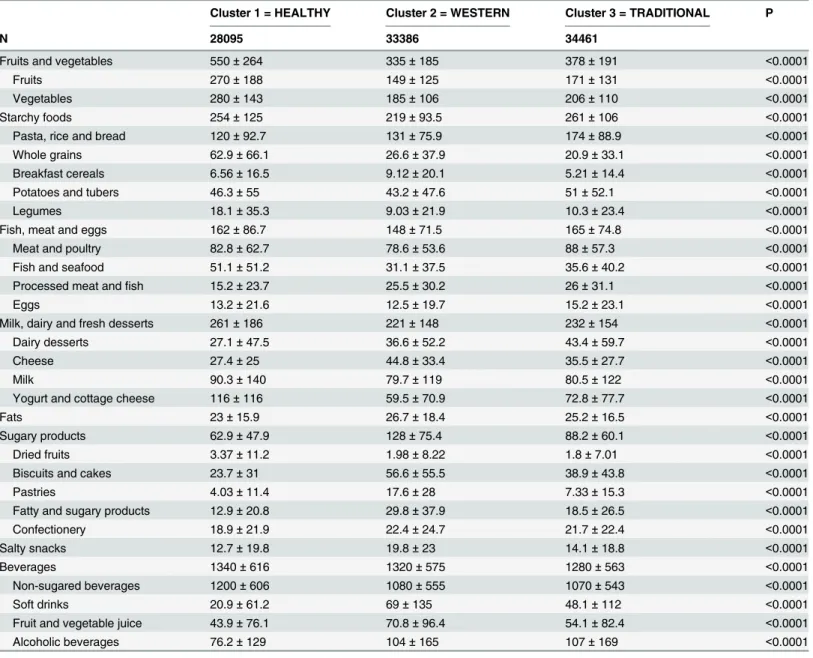
The‘Healthy’pattern was characterized by high consumption of fruit, vegetables, legumes,
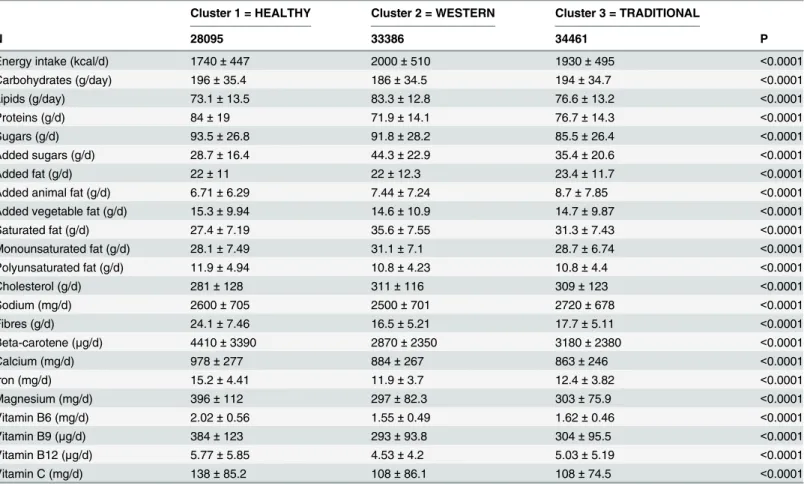
whole cereals and fish and seafood (Table 2). This led to high intakes in fibers, vitamins and minerals (Table 3). The‘Western’pattern was characterized by high consumption of
sweet-ened beverages, breakfast cereal, cheese and fatty and sugary foods (Table 2). This led to high intakes in energy, saturated fat, cholesterol, and added sugar (Table 3). The‘Traditional’
pat-tern was characterized by high consumption of potatoes, bread, meat and dairy desserts (Table 2). This led to high sodium and added fat intakes (Table 3).
Substitution Scenarios
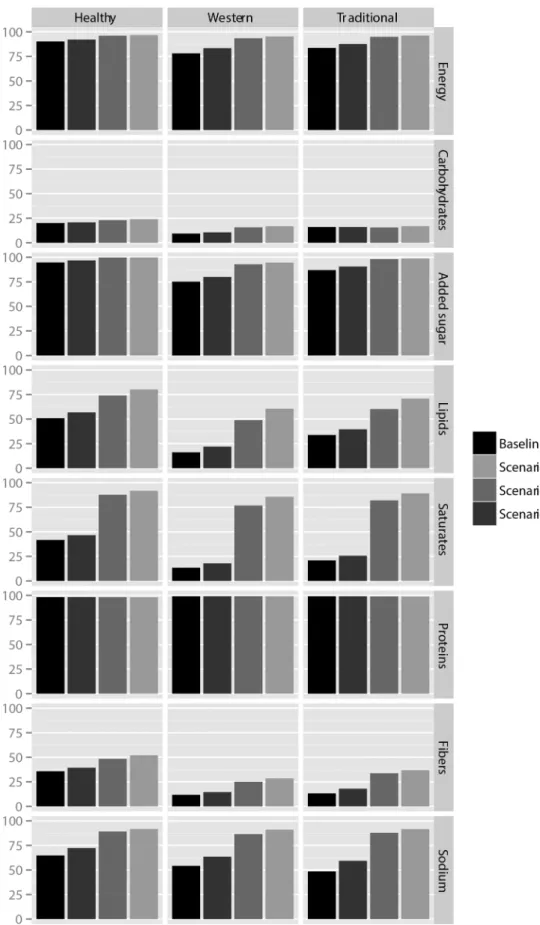
Overall, substitutions strategies led to a decrease in lipid, sugars and added sugars intakes and an increase in fibers intakes, leading to an increase in the number of subjects reaching the rec-ommended intakes in energy, macro and micronutrients (Fig 2). The most important increases were observed for lipids and saturates intakes, more particularly in the‘Western’patterns (Fig 2). Before substitution, 16.2% of subjects in the‘Western’pattern reached the recommended
amount of lipid intakes (13.5% for saturates,); in scenario n°3, 22.0% reached the recom-mended amount for lipids (17.8% for saturates); finally, in scenario n°1, 60.6% reached the rec-ommended amount for lipids (85.7% for saturates) (Fig 2). On the other hand, as expected, the number of subjects reaching the recommended intakes in the‘Healthy’pattern was more
important at baseline, but the magnitude of effect of the substitution scenarios in this group of consumers was lower (e.g. 50.9% of subjects reached the recommended lipid amount before substitution, and they were 56.8% in scenario n°1) (Fig 2).
For added sugars, fibers and sodium, substitutions using the 5-CNL significantly increased the number of subjects reaching the recommended amounts, but the magnitude of these effects was comparatively lower. For carbohydrates and proteins intakes, substitutions using the 5-CNL did not modify significantly the number of subjects reaching the recommendations.
Discussion
micro-Table 1. Consumption of foods from each colour (% energy intake) and sociodemographic, lifestyle and anthropometric characteristics across identified clusters (N = 95942).
Cluster 1 = HEALTHY Cluster 2 = WESTERN Cluster 3 = TRADITIONAL P
N 28095 33386 34461
Consumption from 'colour' foods
Green 44±9.81 21.2±7.93 22.5±7.29 <0.0001
Yellow 13.8±7.63 14.6±6.88 27.3±9.05 <0.0001
Orange 13.2±8.62 11.7±7.51 13.1±8.39 <0.0001
Pink 20.6±8.22 40.3±7.94 22.8±6.94 <0.0001
Red 8.31±6.84 12.2±7.88 14.4±9.16 <0.0001
Sex
Male 5440 (19.4) 6866 (20.6) 8708 (25.3) <0.0001
Female 22655 (80.6) 26520 (79.4) 25753 (74.7)
Age category (y)
18–24 years old 1965 (7) 5657 (16.9) 3569 (10.4) <0.0001
25–44 years old 9315 (33.2) 16567 (49.6) 14329 (41.6)
45–64 years old 14023 (49.9) 9895 (29.6) 14026 (40.7)
65 years old 2792 (9.9) 1267 (3.8) 2537 (7.4)
Monthly income (€)
<900 2548 (9.1) 4172 (12.5) 3606 (10.5) <0.0001
900–1200 1522 (5.4) 2321 (7) 2414 (7)
1201–1800 6425 (22.9) 8462 (25.3) 8641 (25.1)
1801–2300 4227 (15) 4712 (14.1) 4814 (14)
2301–2700 2591 (9.2) 2753 (8.2) 3010 (8.7)
2701–3700 4249 (15.1) 4135 (12.4) 4910 (14.2)
>3700 3105 (11.1) 2765 (8.3) 3212 (9.3)
Missing 3428 (12.2) 4066 (12.2) 3854 (11.2)
Educational level
No diploma and primary 952 (3.4) 701 (2.1) 1044 (3) <0.0001
Secondary 9565 (34) 10429 (31.2) 12006 (34.8)
University 17365 (61.8) 22049 (66) 21169 (61.4)
Other 213 (0.8) 207 (0.6) 242 (0.7)
Living area
Urban 21691 (77.2) 25832 (77.4) 26456 (76.8) <0.0001
Rural 5825 (20.7) 6892 (20.6) 7591 (22)
Abroad 579 (2.1) 662 (2) 414 (1.2)
Marital status
Single/divorced/widowed 8497 (30.3) 10314 (30.9) 9031 (26.2) <0.0001
In couple 19589 (69.7) 23065 (69.1) 25419 (73.8)
Smoking statut
Never smoker 14135 (50.3) 16989 (50.9) 16784 (48.7) <0.0001
Former smoker 10650 (37.9) 9778 (29.3) 11779 (34.2)
Current smoker 3301 (11.8) 6612 (19.8) 5891 (17.1)
Body mass index category
Underweight 1548 (5.5) 1971 (5.9) 1585 (4.6) <0.0001
Normal weight 17558 (62.5) 22244 (66.6) 21689 (62.9)
Overweight 6368 (22.7) 6416 (19.2) 7838 (22.7)
Obese 2611 (9.3) 2751 (8.2) 3343 (9.7)
Data are N(%) and Mean±SD. P value for Chisquare tests across clusters
nutrient intakes in individuals, with a higher impact in patterns characterized with a lower diet quality. Though scenario n°1 appears unrealistic, it shows the margin of progression attainable in the population, highlighting the potential of the 5-CNL to contribute in reaching the French National Nutrition and Health Program (PNNS) objectives.
The dietary profiles that were identified in our study are consistent with the existing litera-ture [31–33]. Subjects with healthier dietary profiles have been frequently reported to be more
often women, with higher education and income, while‘Western’dietary patterns are more
fre-quently followed by younger subject with lower incomes [31].‘Traditional’patterns are more
often reported in older subjects with lower education [33,34].
To the best of our knowledge, this is the first study to use FOP nutrition labels to character-ize dietary behaviour using this type of methodology. Some studies have used FOP nutrition
Table 2. Food group consumption (g/day) according to the identified clusters (N = 95942).
Cluster 1 = HEALTHY Cluster 2 = WESTERN Cluster 3 = TRADITIONAL P
N 28095 33386 34461
Fruits and vegetables 550±264 335±185 378±191 <0.0001
Fruits 270±188 149±125 171±131 <0.0001
Vegetables 280±143 185±106 206±110 <0.0001
Starchy foods 254±125 219±93.5 261±106 <0.0001
Pasta, rice and bread 120±92.7 131±75.9 174±88.9 <0.0001
Whole grains 62.9±66.1 26.6±37.9 20.9±33.1 <0.0001
Breakfast cereals 6.56±16.5 9.12±20.1 5.21±14.4 <0.0001
Potatoes and tubers 46.3±55 43.2±47.6 51±52.1 <0.0001
Legumes 18.1±35.3 9.03±21.9 10.3±23.4 <0.0001
Fish, meat and eggs 162±86.7 148±71.5 165±74.8 <0.0001
Meat and poultry 82.8±62.7 78.6±53.6 88±57.3 <0.0001
Fish and seafood 51.1±51.2 31.1±37.5 35.6±40.2 <0.0001
Processed meat andfish 15.2±23.7 25.5±30.2 26±31.1 <0.0001
Eggs 13.2±21.6 12.5±19.7 15.2±23.1 <0.0001
Milk, dairy and fresh desserts 261±186 221±148 232±154 <0.0001
Dairy desserts 27.1±47.5 36.6±52.2 43.4±59.7 <0.0001
Cheese 27.4±25 44.8±33.4 35.5±27.7 <0.0001
Milk 90.3±140 79.7±119 80.5±122 <0.0001
Yogurt and cottage cheese 116±116 59.5±70.9 72.8±77.7 <0.0001
Fats 23±15.9 26.7±18.4 25.2±16.5 <0.0001
Sugary products 62.9±47.9 128±75.4 88.2±60.1 <0.0001
Dried fruits 3.37±11.2 1.98±8.22 1.8±7.01 <0.0001
Biscuits and cakes 23.7±31 56.6±55.5 38.9±43.8 <0.0001
Pastries 4.03±11.4 17.6±28 7.33±15.3 <0.0001
Fatty and sugary products 12.9±20.8 29.8±37.9 18.5±26.5 <0.0001
Confectionery 18.9±21.9 22.4±24.7 21.7±22.4 <0.0001
Salty snacks 12.7±19.8 19.8±23 14.1±18.8 <0.0001
Beverages 1340±616 1320±575 1280±563 <0.0001
Non-sugared beverages 1200±606 1080±555 1070±543 <0.0001
Soft drinks 20.9±61.2 69±135 48.1±112 <0.0001
Fruit and vegetable juice 43.9±76.1 70.8±96.4 54.1±82.4 <0.0001
Alcoholic beverages 76.2±129 104±165 107±169 <0.0001
Data are Means±SD in g/day. P value for ANOVA across clusters
labels to investigate diet, but all considered a binary indicator of the nutritional quality of foods, which prevents direct comparisons across studies [35–38]. Lichtenstein et al.
investi-gated the association between dietary behavior and consumption of American Heart Associa-tion (AHA) Heart Check Certifiable (HCC) foods [38]. Nutritional requirements for AHA HCC foods vary for 6 categories of foods, and include content in saturated fat and sodium (as in the 5-CNL) but also content intrans-fat, cholesterol, and some vitamins and minerals, lead-ing to a binary assessment of the nutritional quality of the food (Heart Check vs. no Heart Check) [39]. Comparison with the 5-CNL suggests that AHA HCC foods would correspond to
‘Green’labeled foods. In the NHANES population, consumption of AHA HCC foods was
posi-tively associated with consumption of fruit, vegetables and total grain, and inversely associated with the percentage of energy from saturated fat, alcohol, cholesterol and sodium [38]. These results are consistent with ours, as subjects with high consumption of AHA HCC foods would more likely be in the‘Healthy diet’cluster. Another study showed that the NuVal system,
which ranks foods from 0 to 100 according to their content in 30 different nutrients, applied to individual diets was correlated to the Healthy Eating Index and to the DASH diet [37]. Such results are in line with ours, as subjects with high ONQI would more likely correspond to the
‘Healthy’pattern. However, the NuVal system differs from the 5-CNL, as it delivers a
quantita-tive continuous information to the consumer (0–100), compared to five classes of nutritional
quality. Moreover, no direct comparison was possible with the FSA score, given that the NuVal uses a proprietary algorithm [40].
Table 3. Energy, macro- and microutrient intake in the identified clusters (N = 95942).
Cluster 1 = HEALTHY Cluster 2 = WESTERN Cluster 3 = TRADITIONAL
N 28095 33386 34461 P
Energy intake (kcal/d) 1740±447 2000±510 1930±495 <0.0001
Carbohydrates (g/day) 196±35.4 186±34.5 194±34.7 <0.0001
Lipids (g/day) 73.1±13.5 83.3±12.8 76.6±13.2 <0.0001
Proteins (g/d) 84±19 71.9±14.1 76.7±14.3 <0.0001
Sugars (g/d) 93.5±26.8 91.8±28.2 85.5±26.4 <0.0001
Added sugars (g/d) 28.7±16.4 44.3±22.9 35.4±20.6 <0.0001
Added fat (g/d) 22±11 22±12.3 23.4±11.7 <0.0001
Added animal fat (g/d) 6.71±6.29 7.44±7.24 8.7±7.85 <0.0001
Added vegetable fat (g/d) 15.3±9.94 14.6±10.9 14.7±9.87 <0.0001
Saturated fat (g/d) 27.4±7.19 35.6±7.55 31.3±7.43 <0.0001
Monounsaturated fat (g/d) 28.1±7.49 31.1±7.1 28.7±6.74 <0.0001
Polyunsaturated fat (g/d) 11.9±4.94 10.8±4.23 10.8±4.4 <0.0001
Cholesterol (g/d) 281±128 311±116 309±123 <0.0001
Sodium (mg/d) 2600±705 2500±701 2720±678 <0.0001
Fibres (g/d) 24.1±7.46 16.5±5.21 17.7±5.11 <0.0001
Beta-carotene (μg/d) 4410±3390 2870±2350 3180±2380 <0.0001
Calcium (mg/d) 978±277 884±267 863±246 <0.0001
Iron (mg/d) 15.2±4.41 11.9±3.7 12.4±3.82 <0.0001
Magnesium (mg/d) 396±112 297±82.3 303±75.9 <0.0001
Vitamin B6 (mg/d) 2.02±0.56 1.55±0.49 1.62±0.46 <0.0001
Vitamin B9 (μg/d) 384±123 293±93.8 304±95.5 <0.0001
Vitamin B12 (μg/d) 5.77±5.85 4.53±4.2 5.03±5.19 <0.0001
Vitamin C (mg/d) 138±85.2 108±86.1 108±74.5 <0.0001
Data are Mean±SD. Macro and Micronutrient intake adjusted on energy intake.
Our results are in line with modelling studies investigating the potential impact of substitu-tions within the diet [41–44]. Vyth et al. simulated the effect of substituting foods not
comply-ing with the DutchChoicesprogram with complying foods in the Dutch population [44]. In a maximal scenario where diets were simulated to include 100% of foods complying with the
Choicesprogram, 60.2% of the population complied with the recommended sodium intake, 54.0% to the recommended saturated fatty acids intake and 32.2% to the recommended sugar intake. In comparison, in scenario n°1 from our study, 91.0% to 91.7% of subjects (in the
‘Western’and‘Healthy’patterns respectively) reached the recommended intake for sodium,
85.7% to 91.7% of subjects (same patterns) reached the recommended intakes for saturated fatty acids and 94.5% to 99.8% of subjects reached the recommended intakes for added sugars. Though the recommended amounts set at targets in the paper by Vyth et al. were more strin-gent than those we used, the observed differences suggest that the 5-CNL may have a higher impact compared to the Dutch Choices program. These differences can be partly explained by the fact that, contrarily to the Choices program, the 5-CNL would apply to all foods, allowing for a larger number of possible substitutions across the spectrum of available foods, including those with lower nutritional quality.
Modeling studies using observational dietary data have shown that both an increase in the panel of foods consumed and substitutions of foods would be required to achieve a balanced diet [45,46]. However, modifying the structure of one’s diet with the introduction of unfamiliar
foods is constraining, while substitutions appear as more easily achievable. Therefore, at the individual level, the 5-CNL could be a helpful tool in implementing substitution strategies, allowing for an improvement in the nutritional quality of the diet. Subjects with already healthy diets would however have a lower gain from this strategy, while the potential lever for improve-ment in subjects with lower quality diets is more important. Indeed, the relative increase in the number of subjects reaching the recommended amount of saturates in the diet using scenario n °3 (the less constraining) is 11.7% in the‘Healthy’pattern compared to 32.4% in the‘Western’
pattern. At the population level, even if subjects with lower quality diets would use the 5-CNL less, the gain in terms of nutritional quality would be more important. This aspect of the 5-CNL is to be taken into account while the major focus of public health nutrition in France is tackling social inequalities in health, including nutrition [47,48]. However, the introduction of a FOP nutrition label is only one of the multiple contributors that might help in improving the diet at the population level, along with other actions in the framework of a national program. The expectations in terms of impact for the 5-CNL should therefore take into account its con-nection and consistency with education, information and regulation policies.
Strengths of our study include its large sample size, and the use of validated dietary collec-tion data, using repeated dietary records [49]. Moreover, the implementation of several substi-tution scenarios allowed for a more detailed evaluation of the potential impact of the 5-CNL on the nutritional quality of the diet across dietary profiles.
Our study is subject to some limitations. First, the actual use of the FOP system once imple-mented can’t be anticipated, as food choices at the point of purchase are influenced by individual
characteristics (socio-demographical, lifestyle and dietary data), but also by the characteristics of the food offer (price, brands and marketing). A nutritional label would therefore be only one in many cues the consumer faces when grocery shopping. Stimulating awareness towards the label in itself can be considered as a challenge. Therefore, the actual use of the FOP label is likely to be low [50]. The results of the simulation scenarios presented in this paper should therefore be inter-preted as best case scenarios and potential nutritional gains that could be achieved when using the label for food substitutions. Second, the substitution strategies we modelled do not take into account potential dietary modification induced by substitutions themselves (e.g. substitution from a sweetened yogurt to a non-sweetened option could lead to a concurrent increased con-sumption in sugar). Third, the use of the 5-CNL to implement substitutions in a real-life setting is likely dependent on the dietary pattern, which was not taken into account in the substitution models. Indeed, subjects who are more concerned about their diet, and therefore more likely to have‘Healthy’dietary patterns, are also more likely to use a nutrition label when grocery
shop-ping [50]. Finally, our sample consists of volunteer subjects included in a cohort study on nutri-tion, who are therefore more likely to have healthier behaviours. Moreover, the methodology used is highly data-driven, which might also impair generalizability of our results. However, the dietary profiles that were identified included groups with less healthy dietary behaviours (‘
West-ern’and‘Traditional’), which represented the majority of our sample (69.9% of the total sample).
Moreover, the profiles identified in our study are similar to other studies, allowing for meaningful international comparisons [32].
More research is needed to help anticipating the potential of FOP systems to modify choices at the point of purchase, among all the factors influencing food choices.
Use of the 5-CNL to identify food choices allowed for the identification of three meaningful dietary patterns. Moreover, the 5-CNL could be a useful tool to help consumers substitute foods for a healthier alternative, and reach significant nutritional improvements in the diet, especially in individuals with poorer diets.
Supporting Information
S1 Fig. Scenarios of substitution used in the simulations.
(PPTX)
S1 Table. Food groups used for substitution strategies.
(DOCX)
S2 Table. Cut-offs used to define adequate intakes in energy, macro- and micronutrients.
(DOCX)
Acknowledgments
Author Contributions
Conceived and designed the experiments: CJ EKG. Performed the experiments: CJ. Analyzed the data: CJ CM SP LF CB SH EKG MT BA. Contributed reagents/materials/analysis tools: CJ SH. Wrote the paper: CJ CM SP LF CB SH EKG MT BA.
References
1. Organization for Economic Co-operation and Development. Promoting sustainable consumption–good practices in OECD countries. 2008.
2. World Health Organization. Global strategy on diet, physical activity and health. 2004.
3. Vyth EL, Steenhuis IHM, Roodenburg AJC, Brug J, Seidell JC. Front-of-pack nutrition label stimulates healthier product development: a quantitative analysis. International Journal of Behavioral Nutrition and Physical Activity. 2010 7.
4. Asp NG, Bryngelsson S. Health claims in the labelling and marketing of food products: the Swedish food sector's Code of Practice in a European perspective. Food & Nutrition Research; Vol 51, No 3 (2007). 2007.
5. Vyth EL, Steenhuis IHM, Mallant SF, Mol ZL, Brug J, Temminghoff M et al. A Front-of-Pack Nutrition Logo: A Quantitative and Qualitative Process Evaluation in the Netherlands. Journal of Health Commu-nication. 2009; 14: 631–645. doi:10.1080/10810730903204247PMID:19851915
6. Commonwealth of Australia. Health Star Rating System. A joint Australian, state and territory govern-ments initiatives in partnership with industry, public health and consumer groups. 2015.
7. Touraine M. Projet de loi n°2302 relatifàla Santé, présenté au nom de M. Manuel Valls, Premier minis-tre, par Mme Marisol Touraine, ministre des affaires sociales, de la santé et des droits des femmes. Exposé des motifs. 2015.
8. Hercberg S. Propositions pour un nouvel élan de la politique nutritionnelle française de santé publique dans le cadre de la stratégie nationale de santé. 1ère partie: mesures concernant la prévention nutri-tionnelle. 2013.
9. Hercberg S, Chat-Yung S, Chauliac M. The French National Nutrition and Health Program: 2001-2006-2010. Int J Public Health. 2008; 53: 68–77. PMID:18681335
10. Rayner M, Scarborough P, Stockley L, Boxer A. Nutrient profiles: development of Final model. Final Report [online]. 2005.
11. Rayner M, Scarborough P, Lobstein T. The UK Ofcom Nutrient Profiling Model—Defining 'healthy' and 'unhealthy' food and drinks for TV advertising to children. 2009.
12. Azais-Braesco V, Goffi C, Labouze E. Nutrient profiling: comparison and critical analysis of existing sys-tems. Public Health Nutr. 2006; 9: 613–622. PMID:16923293
13. Townsend MS. Where is the science? What will it take to show that nutrient profiling systems work? Am J Clin Nutr. 2010; 91: 1109S–1115S. doi:10.3945/ajcn.2010.28450FPMID:20164310
14. Scarborough P, Arambepola C, Kaur A, Bhatnagar P, Rayner M. Should nutrient profile models be 'cat-egory specific' or 'across-the-board'? A comparison of the two systems using diets of British adults. Eur J Clin Nutr. 2010; 64: 553–560. doi:10.1038/ejcn.2010.31PMID:20216562
15. Julia C, Kesse-Guyot E, Touvier M, Mejean C, Fezeu L, Hercberg S. Application of the British Food Standards Agency nutrient profiling system in a French food composition database. The British journal of nutrition. 2014; 112: 1699–1705. doi:10.1017/S0007114514002761PMID:25277084
16. Julia C, Ducrot P, Peneau S, Deschamps V, Mejean C, Fezeu L et al. Discriminating nutritional quality of foods using the 5-Color nutrition label in the French food market: consistency with nutritional recom-mendations. Nutr J. 2015; 14: 100. doi:10.1186/s12937-015-0090-4[pii]. PMID:26416389
17. Julia C, Kesse-Guyot E, Ducrot P, Peneau S, Touvier M, Mejean C et al. Performance of a five category front-of-pack labelling system—the 5-colour nutrition label—to differentiate nutritional quality of break-fast cereals in France. BMC Public Health. 2015; 15: 179. doi:10.1186/s12889-015-1522-y; [pii]. PMID:25885583
18. Hercberg S, Castetbon K, Czernichow S, Malon A, Mejean C, Kesse E et al. The Nutrinet-Sante Study: a web-based prospective study on the relationship between nutrition and health and determinants of dietary patterns and nutritional status. Bmc Public Health. 2010; 10.
19. Black AE. Critical evaluation of energy intake using the Goldberg cut-off for energy intake:basal meta-bolic rate. A practical guide to its calculation, use and limitations. Int J Obes Relat Metab Disord. 2000; 24: 1119–1130. PMID:11033980
21. Craig CL, Marshall AL, Sjostrom M, Bauman AE, Booth ML, Ainsworth BE et al. International physical activity questionnaire: 12-country reliability and validity. Med Sci Sports Exerc. 2003; 35: 1381–1395. PMID:12900694
22. World Health Organization. Obesity: Preventing and managing the global epidemic. Report of a WHO consultation. WHO Technical Report Series 894. Geneva: WHO. 2000.
23. Hercberg S., Deheeger M., and Preziosi P. (2002) SU.VI.MAX Portions alimentaires. Manuel photos pour l'estimation des quantités. Paris: Editions polytechnica. 132 p.
24. Etude Nutrinet-Santé (2013) Table de composition des aliments de l'étude Nutrinet-Santé. Paris: Economica.
25. Haut Conseil de la Santé Publique. Avis relatifàl'information sur la qualité nutritionnelle des produits alimentaires. Paris: HCSP. 2015. Available:http://www.hcsp.fr/Explore.cgi/avisrapportsdomaine? clefr=519.
26. ANSES. Evaluation de la faisabilité du calcul d'un score nutritionnel tel qu'élaboré par Rayner et al. Rapport d'appui scientifique et technique. Paris: ANSES. 2015.
27. Willett W, Stampfer MJ. Total energy intake: implications for epidemiologic analyses. Am J Epidemiol. 1986; 124: 17–27. PMID:3521261
28. Ministère du travail,dledls. Programme National Nutrition Santé 2011–2015. Paris: Ministère du travail, de l'emploi et de la santé. 2011. Available:http://www.sante.gouv.fr/IMG/pdf/PNNS_2011-2015.pdf.
29. AFSSA. Apports en protéines: consommation, qualité, besoins et recommandations. Paris: Agence Française de Sécurité Sanitaire des Aliments. 2007. Available:https://www.anses.fr/fr/system/files/ NUT-Ra-Proteines.pdf.
30. Estaquio C, Kesse-Guyot E, Deschamps V, Bertrais S, Dauchet L, Galan P et al. Adherence to the French Programme National Nutrition Sante Guideline Score Is Associated with Better Nutrient Intake and Nutritional Status. J Am Diet Assoc. 2009; 109: 1031–1041. doi:10.1016/j.jada.2009.03.012 PMID:19465185
31. Kesse-Guyot E, Bertrais S, Peneau S, Estaquio C, Dauchet L, Vergnaud AC et al. Dietary patterns and their sociodemographic and behavioural correlates in French middle-aged adults from the SU.VI.MAX cohort. Eur J Clin Nutr. 2009; 63: 521–528. doi:10.1038/sj.ejcn.1602978PMID:18212801
32. Newby PK, Tucker KL. Empirically derived eating patterns using factor or cluster analysis: A review. Nutr Rev. 2004; 62: 177–203. PMID:15212319
33. Pryer JA, Nichols R, Elliott P, Thakrar B, Brunner E, Marmot M. Dietary patterns among a national ran-dom sample of British adults. J Epidemiol Community Health. 2001; 55: 29–37. PMID:11112948 34. Villegas R, Salim A, Collins MM, Flynn A, Perry IJ. Dietary patterns in middle-aged Irish men and
women defined by cluster analysis. Public Health Nutrition. 2004; 7: 1017–1024. PMID:15548339 35. Chiuve SE, Sampson L, Willett WC. The Association Between a Nutritional Quality Index and Risk of
Chronic Disease. Am J Prev Med. 2011; 40: 505–513. doi:10.1016/j.amepre.2010.11.022PMID: 21496749
36. Julia C, Touvier M, Mejean C, Ducrot P, Peneau S, Hercberg S et al. Development and Validation of an Individual Dietary Index Based on the British Food Standard Agency Nutrient Profiling System in a French Context. J Nutr. 2014; 144: 2009–2017. doi:10.3945/jn.114.199679PMID:25411035 37. Katz DL, Njike VY, Rhee LQ, Reingold A, Ayoob KT. Performance characteristics of NuVal and the
Overall Nutritional Quality Index (ONQI). Am J Clin Nutr. 2010; 91: 1102S–1108S. doi:10.3945/ajcn.
2010.28450EPMID:20181809
38. Lichtenstein AH, Carson JS, Johnson RK, Kris-Etherton PM, Pappas A, Rupp L et al. Food-intake pat-terns assessed by using front-of-pack labeling program criteria associated with better diet quality and lower cardiometabolic risk(1–3). Am J Clin Nutr. 2014; 99: 454–462. doi:10.3945/ajcn.113.071407
PMID:24368435
39. American Heart Association. American Heart Association Heart-Check Certification Program Nutrition Requirements. 2015.
40. Reedy J, Kirkpatrick SI. The Use of Proprietary Nutrient Profiling Tools in Nutrition Science and Policy: A Commentary. Am J Prev Med. 2011; 40: 581–582. doi:10.1016/j.amepre.2011.02.010PMID: 21496762
41. Schickenberg B, van Assema P, Brug J, Verkaik-Kloosterman J, Ocke MC, de Vries NK. Replacing foods high in saturated fat by low-saturated fat alternatives: a computer simulation of the potential effects on reduction of saturated fat consumption. Br J Nutr. 2009; 102: 478–483. doi:10.1017/
S0007114508190298PMID:19138448
Total Energy Intake in Lower Mississippi Delta Adults. J Nutr. 2011; 141: 2191–2197. doi:10.3945/jn.
111.144659PMID:22031664
43. Verger EO, Holmes BA, Huneau JF, Mariotti F. Simple Changes within Dietary Subgroups Can Rapidly Improve the Nutrient Adequacy of the Diet of French Adults. J Nutr. 2014; 144: 929–936. doi:10.3945/
jn.113.188284PMID:24699804
44. Vyth EL, Hendriksen MAH, Roodenburg AJC, Steenhuis IHM, van Raaij JMA, Verhagen H et al. Con-suming a diet complying with front-of-pack label criteria may reduce cholesterol levels: a modeling study. Eur J Clin Nutr. 2012; 66: 510–516. doi:10.1038/ejcn.2011.193PMID:22085871
45. Maillot M, Vieux F, Ferguson EF, Volatier JL, Amiot MJ, Darmon N. To Meet Nutrient Recommenda-tions, Most French Adults Need to Expand Their Habitual Food Repertoire. J Nutr. 2009; 139: 1721– 1727. doi:10.3945/jn.109.107318PMID:19625703
46. Maillot M, Issa C, Vieux F, Lairon D, Darmon N. The shortest way to reach nutritional goals is to adopt Mediterranean food choices: evidence from computer-generated personalized diets. Am J Clin Nutr. 2011; 94: 1127–1137. doi:10.3945/ajcn.111.016501PMID:21900460
47. INPES. Réduire les inégalités sociales de santé. Institut National de Prévention et d'Education pour la Santé. 2010.
48. Inserm. Inégalités sociales de santé - Expertise collective INSERM. Centre d'expertise collective ITMO Santé Publique—Aviesan. 2013.
49. Touvier M, Kesse-Guyot E, Mejean C, Pollet C, Malon A, Castetbon K et al. Comparison between an interactive web-based self-administered 24 h dietary record and an interview by a dietitian for large-scale epidemiological studies. Br J Nutr. 2011; 105: 1055–1064. doi:10.1017/S0007114510004617
PMID:21080983
50. Van Kleef E, Dagevos H. The Growing Role of Front-of-Pack Nutrition Profile Labeling: A Consumer Perspective on Key Issues and Controversies. Crit Rev Food Sci Nutr. 2015; 55: 291–303. doi:10.