Shamyr Sulyvan CastroI Americo Focesi PelicioniII Chester Luiz Galvão CesarIII Luana CarandinaIV
Marilisa Berti de Azevedo BarrosV
Maria Cecilia Goi Porto AlvesVI Moisés GoldbaumVII
I Programa de Pós-Graduação em Saúde Pública. Faculdade de Saúde Pública (FSP). Universidade de São Paulo (USP). São Paulo, SP, Brasil
II Departamento de Epidemiologia. Escola de Enfermagem. Faculdades Metropolitanas Unidas. São Paulo, SP, Brasil
III Departamento de Epidemiologia. FSP – USP. São Paulo, SP, Brasil
IV Departamento de Saúde Pública. Faculdade de Medicina de Botucatu. Universidade Estadual Paulista Julio de Mesquita Filho. Botucatu, SP, Brasil
V Departamento de Medicina Preventiva e Social. Faculdade de Ciências Médicas. Universidade Estadual de Campinas. Campinas, SP, Brasil
VI Instituto de Saúde. Secretaria de Saúde do Estado de São Paulo. São Paulo, SP, Brasil VII Departamento de Medicina Preventiva.
Faculdade de Medicina. USP. São Paulo, SP, Brasil
Correspondence: Chester Luiz Galvão Cesar Departamento de Epidemiologia Av. Doutor Arnaldo, 715 – Cerqueira César 01246-904 São Paulo, SP, Brasil
E-mail: [email protected] Received: 8/25/2009 Approved: 4/26/2010
Article available from: www.scielo.br/rsp
Use of medicines by persons
with disabilities in São Paulo
state areas, Southeastern Brazil
ABSTRACT
OBJECTIVE: To analyze the use of medicines and the main therapeutic groups consumed by persons with physical, hearing and visual disabilities.
METHODS: A cross-sectional study was performed, where data from the 2002 Inquérito Multicêntrico de Saúde no Estado de São Paulo (ISA–SP – São Paulo State Multicenter Health Survey), as well as the 2003 Inquérito de Saúde no Município de São Paulo (ISA–Capital – City of São Paulo Health Survey), Southeastern Brazil, were analyzed. Respondents who reported having disabilities were studied, according to variables that comprise the database: geographic area, gender, income, age group, ethnic group, use of medicines and types of drugs consumed.
RESULTS: The percentage of use of drugs by persons with disabilities was 62.8% among the visually impaired; 60.2% among the hearing impaired; and 70.1% among the persons with physical disabilities. Individuals with physical disabilities consumed 20% more medications than non-disabled ones. Among persons with visual disabilities, the most frequently consumed drugs were diuretics, agents of the renin-angiotensin system and analgesics. Persons with hearing disabilities used more analgesics and agents of the renin-angiotensin system. Among those with physical disabilities, analgesics, antithrombotics and agents of the renin-angiotensin system were the most frequently consumed medicines.
CONCLUSIONS: There was a greater use of medicines among persons with disabilities than non-disabled ones. Persons with physical disabilities were those who most consumed medicines, followed by the visually impaired and the hearing impaired.
DESCRIPTORS: Disabled Persons. Drug Utilization. Drugs of Continuous Use. Morbidity Surveys.
INTRODUCTION
A medicine, according to the Brazilian Ministry of Health, is a pharmaceutical product with a prophylactic, healing, palliative or diagnostic purpose.a In the health-disease process, a medicine plays an important role, both in terms of health system management policies and health professionals involved.23
Although the use of medicines to improve the population’s health status has been recognized, access to medicines and their benefi ts are unequally distributed
among the several layers of society and ethnic groups.b In Brazil, it is estimated that 23% of the population uses 60% of the production and that 64.5 million individuals do not have fi nancial conditions to acquire the required medicines.20 Certain governmental actions aimed at the pharmaceutical assistance sector have been performed to reduce social discrepancies in access to medicines. The Política Nacional de Medicamentos (PNM – Brazilian Policy of Medicines), established in 2001 by the Ministry of Health, aims to guarantee access to essential medicines by the populationc and it was structured into three main categories: sanitary regulation, economic regulation and pharmaceutical regulation.
This policy appears in an environment of demographic changes in Brazil. Considering the fact that transfor-mations in population patterns lead to qualitative and quantitative changes in use of medicines, the PNM foresees a greater use of certain pharmacological groups, such as medicines used for the treatment of chronic-degenerative diseases and those of continuous use, due to an increase in life expectation.
Another consequence of the demographic transition is the increase in the number of individuals with a certain form of disability, once age is a risk factor for this type of event.4 The prevalences of disabilities in the popu-lation vary according to the country or even research methodology; however, prevalences of a certain type of disability were recorded at 110.8‰ in areas of the state of São Paulo,4 Brazil, and at 126.0‰ in Holland.18 Individuals with a certain type of disability, whether it be visual, hearing or physical, may have special health needs, due to this disability. Associated with the causes or defi ciencies resulting from them, there are morbid processes that are more easily established or which are an essential part of the process of becoming disabled.5 These comorbidities require more health care, because they can worsen the disability or decrease quality of life and health of a person with disability, and medicines are an important control aspect.
Despite its having been extensively researched, the question of use of medicines is, most times, indirectly studied from points of sale, thus providing data on the population’s search, rather than demand. Population-based health surveys are more effi cient instruments in the analysis of data on demand, once the information collected is self-reported. Thus, more reliable infor-mation about the actual need of individuals can be
obtained, even if they do not have access to medicines.a However, population-based studies on use of medicines among persons with disabilities are rare, also due to cost and time factors.
Patterns of use of medicines provide the basis to plan actions in pharmaceutical assistance and to direct health care policies.22 Thus, establishing this pattern for persons with disabilities can contribute to better health pharmacotherapy in this group, improving not only their health, but also their quality of life, which is in accordance with the PNM.
The objective of the present study was to analyze use of medicines and the main therapeutic groups consumed by individuals with physical, hearing and visual disabilities.
METHODS
Two population household health surveys were performed in the cities of Campinas, Botucatu, São Paulo, Itapecerica da Serra, Taboão da Serra and Embu, in Southeastern Brazil. The present study was part of these two health surveys, known as ISA–SP, Inquérito de Saúde no Estado de São Paulo (2002 – State of São Paulo Health Survey), and ISA–Capital, Inquérito de Saúde no Município de São Paulo (2003 – City of São Paulo Health Survey). These surveys performed an extensive health investigation and two of the issues dealt with were the use of medicines and the occurrence of disabilities.
In both surveys, sampling was conducted in two stages. Primary units of sampling were census tracts, while the secondary ones were households. In the sample selection, census tracts were grouped into three strata, considering the percentage of heads of family with higher education: less than 5%; from 5% to 25%; and more than 25%. A total of eight sample domains were defi ned according to gender and age, each with a similar number of interviews: less than one year; one to 11 years; men aged between 12 and 19 years; women between 12 and 19 years; men between 20 and 29 years; women between 20 and 29 years; men aged 60 years and older; and women aged 60 years and older.
The above mentioned surveys had already had prelimi-nary data published in the forms of a summary, released in 2005,d and a website.e Methodological details can be seen in Castro et al,4 (2008) and Cesar et al (2005).f
b Pelicioni AF. Padrão de consumo de medicamentos em duas áreas da Região Metropolitana de São Paulo, 2001-2002 [master’s dissertation]. São Paulo: Faculdade de Saúde Pública da Universidade de São Paulo; 2006.
c Ministério da Saúde. Secretaria de Políticas de Saúde. Departamento de Atenção Básica. Política nacional de medicamentos 2001 [Internet]. Brasília, DF; 2001 [cited 2008 Oct 6]. (Série C. Projetos, programas e relatórios, 5). Available from: http://bvsms.saude.gov.br/bvs/publicacoes/ politica_medicamentos.pdf
d Cesar CLG, Carandina L, Alves MCGP, Barros MBA, Goldbaum M. Saúde e condição de vida em São Paulo: inquérito multicêntrico de saúde no Estado de São Paulo. São Paulo: Faculdade de Saúde Pública da USP; 2005.
e Cesar CLG, Segri NJ, Sportello R. Inquéritos de saúde no estado de São Paulo [Internet]. São Paulo: Faculdade de Saúde Pública da USP; 2005 dez 9 [updated 2009 Oct 13; cited 2008 Jul 12]. Available from: http://hygeia.fsp.usp.br/isa-sp
Data were collected through household interviews with the selected individuals. Those who self-reported the use of medicines in the last three days were consi-dered users of medicines, this being directly associated with the quality of information reported.12 During the interview, interviewers asked for medicine packages to confi rm the collected information.
Respondents who self-reported any type of visual (low vision, blindness in one eye or total blindness), hearing (hearing loss, unilateral deafness and total deafness), and physical disabilities (paralysis or amputated limbs) were considered persons with disabilities.
The variables analyzed were as follows: use and pres-cription of medicines, sociodemographic variables (gender, age, ethnic group; income, level of education of head of family, geographic area). Medicines were organized according to the Anatomical Therapeutic Chemical (ATC) Classifi cation System.26
Prevalence ratios were determined based on individuals without a specifi c disability. Poisson regression was used, once the odds ratio can show distortions in studies
with events of prevalences smaller than 10%.1,24 Gender, age and level of education variables were maintained in the Poisson regression model for the purpose of adjust-ment (0.20 signifi cance in the t-test). A signifi cance level of 0.05 (F-statistics) was adopted for the model.
The present study was approved by the Research Ethics Committee of the Faculdade de Saúde Pública, Universidade de São Paulo, on February 14th, 2001, under Protocol 381. Research was thoroughly explained to participants and interviews were conducted after they signed an informed consent form.
RESULTS
Table 1 shows the sample description. The total number of individuals interviewed was 8,316 (1,251 disabled ones). Of these, 4,959 were from the ISA–SP survey, distributed as follows: Greater São Paulo Area (GSP), 1,786; Botucatu, 1,588; and Campinas, 1,585. The other 3,357 interviews came from the ISA–Capital survey of the city of São Paulo.
Table 1. Socioeconomic and demographic characteristics of the total population studied, according to type of disability. State of São Paulo, Southeastern Brazil, 2002-2003.
Variable Disability (%)
a
Total (n=8,316) Visual (n=719) Hearing (n=562) Physical (n=165)
Area
Greater São Paulo 5.7 3.5 5.5 4.9
Botucatu 1.3 1.0 0.9 0.9
Campinas 6.2 8.9 5.2 8.1
São Paulo 86.8 86.6 88.4 86.1
Gender
Male 33.3 56.7 65.9 47.7
Female 66.7 43.3 34.1 52.3
Age group (years)
Less than 12 3.7 4.1 13.9 19.9
12 to 19 9.4 6.8 5.4 15.1
20 to 39 24.7 25.5 24.3 33.7
40 to 59 34.7 26.0 30.6 21.2
60 and more 27.5 37.6 25.8 10.1
Income
Less than 1 MW 837 82.5 81.0 84.5
1 to 4.99 MW 10.6 8.5 15.0 8.2
5 MW and more 5.7 9.0 4.0 7.3
Ethnic group
White 60.7 71.8 59.9 65.3
Mixed/black 37.4 24.5 39.1 33.2
Others 1.9 3.7 1.0 1.5
MW: Minimum wage
a Weighted percentages according to the weight attributed in the stratifi ed sampling process, (n) non-weighted frequency.
Analysis of use of medicines showed that 38.9% of the population consumed a certain type of medicine, 30.9% among men and 45.9% among women. In the GSP, 30.6% of all individuals in this area consumed medicines; in the cities of Botucatu, Campinas and São Paulo, 45.7%, 41.2% and 38.9% of the general population consumed them, respectively.
Table 2 shows the use of medicines according to disabi-lities. The percentage of persons with a visual disability who consumed medicines was 62.8%; among those with a hearing disability, 60.2%; and among persons with a physical disability, 70.1%. After adjustment, the prevalence ratio for use of medicines among persons with a physical disability was higher than that among non-physically disabled ones (aPR = 1.2).
Use of medicines by persons with disabilities is shown in categories in Table 3. There was a greater use among persons with a visual disability in the category of use of two to six medicines (aPR = 1.8) and seven and more medicines (aPR = 3.9). This pattern repeated itself in persons with a physical disability for categories of use of two to six (aPR = 4.9) and seven and more medicines (aPR = 5.7). On the other hand, among those with a hearing disability, prevalence ratios did not maintain their signifi cance level after adjustment.
Considering the therapeutic group of medicines consumed, the pattern of use among persons with disabilities was different between gender and age domains, and also different from that recorded in the total population (Tables 4 and 5).
Agents of the renin-angiotensin system (38.1%) and diuretics (21.2%) were the medicines most frequently used by men with visual disability aged between 20 and 59 years; women with the same type of disability and in the same age group reported a greater use of analgesics (14.2%) and diuretics (10.1%). Among individuals with a visual disability and aged more than 59 years, agents of the renin-angiotensin system (10.8% of men and 8.6% of women) and diuretics (10.6% of men and 10.8% of women) were the most frequently consumed therapeutic groups (Table 4).
Analgesics (26.7%) and agents of the renin-angiotensin system (15.3%) were those most frequently used among males with hearing disability, aged between 20 and 59 years (Table 4). Women in this same age group and with the same disability consumed more analgesics (32.9%), antacids and drugs to treat peptic ulcer and
fl atulence (15.4%). Agents of the renin-angiotensin system (13.5% of men and 7.7% of women) and vita-mins (7.1% of men and 5.9% of women) were more consumed among persons with a hearing disability aged more than 59 years. In addition, a greater use of psychoanaleptics among women in this same group was found (5.3%).
Male individuals with physical disabilities and aged between 20 and 59 years used more analgesics (27.4%) and systemic antibacterial drugs (20.3%); women in this same age group reported that the medicines most frequently consumed by them were analgesics (16.2%), agents of the renin-angiotensin system (14.6%) and antithrombotics (13.7%). On the other hand, among Table 2. Prevalence, crude and adjusted prevalence ratios for use of medicines in the three days prior to the interview, according to type of disability. State of São Paulo, Southeastern Brazil, 2002-2003.
Prevalence
Visual Hearing Physical
With disability
Without disability
With disability
Without disability
With disability
Without disability
Usea (%) 62.8 37.8 60.2 38.4 70.1 38.9 Crude PR (95% CI) 2.2 (1.5;3.3) 1.0 1.9 (1.2;3.0) 1.0 1.6 (1.3;1.9) 1.0
Adjusted PRb(95% CI) 1.5 (0.9;2.3) 1.0 1.4 (0.9;2.2) 1.0 1.2 (1.2;1.8) 1.0 a Weighted percentages, according to the weight attributed in the stratifi ed sampling process.
b Prevalence ratios adjusted for age, gender and level of education of individuals
Table 3. Crude and adjusted prevalence ratio of use of medicines among persons with disabilities. State of São Paulo, Southeastern Brazil, 2002-2003.
Medicines consumeda
Visual disability Hearing disability Physical disability
Crude PR (95% CI)
Adjusted PRb (95% CI)
Crude PR (95% CI)
Adjusted PRb (95% CI)
Crude PR (95% CI)
Adjusted PRb (95% CI)
None 1 1 1 1 1 1
1 1.3 (0.9;1.9) 1.0 (0.7;1.5) 1.7(1.1;2.8) 1.4 (0.8;2.3) 1.2 (0.6;2.5) 1.2 (0.6;2.5) 2 to 6 3.8 (2.5;5.6) 1.8 (1.1;3.1) 2.9 (1.8;4.5) 1.4 (0.8;2.2) 5.6 (3.0;10.6) 4.9(2.3;10.1) 7 and more 9.8 (4.8;20.0) 3.9 (1.4;10.2) 7.4 (3.1;17.0) 2.2 (1.1;4.2) 9.3 (3.2;26.3) 5.7 (1.7;19.0)
Table 4. Distribution of percentage of groups of medicines consumed in the three days prior to the interview, according to disabilities and stratifi ed by gender and age. State of São Paulo, Southeastern Brazil, 2002-2003.
Therapeutic group
Visual disabilitya Hearing disabilitya
20-59M (n=43)
20-59F (n=124)
>59M (n=459)
>59F (n=609)
20-59M (n=32)
20-59F (n=54)
>59M (n=433)
>59F (n=493)
Antacids, drugs to treat peptic ulcer
and fl atulence 0.0 4.2 3.7 1.2 0.1 15.4 2.6 1.6
Propulsive, anticholinergic and
antispasmodic agents 0.0 0.0 0.2 1.6 0.0 4.2 0.1 2.1
Drugs used in diabetes 5.1 8.7 7.1 7.6 1.1 0.0 3.6 4.1
Vitamins 0.1 0.0 5.3 6.2 0.0 0.5 7.1 5.9
Mineral supplements 0.0 0.0 0.0 1.9 0.0 0.0 0.1 4.7
Antithrombotics 7.5 1.5 4.8 3.7 0.3 0.0 5.1 3.0
Anti-anemia drugs 0.0 1.4 0.0 1.8 8.1 0.0 1.1 0.0
Cardiac therapy 0.0 2.0 6.9 3.2 0.2 0.0 5.5 4.3
Antihypertensive drugs 0.0 3.5 1.9 0.6 0.0 0.0 1.2 0.4
Diuretics 21.2 10.1 10.6 10.8 8.8 5.6 7.8 7.2
Peripheral vasodilators 0.0 0.0 1.0 0.7 0.0 0.0 2.7 1.3
Beta-blockers 5.5 1.5 1.9 5.1 1.5 1.1 3.4 5.1
Calcium channel blockers 1.5 1.8 5.5 6.1 1.3 0.0 3.5 3.8
Agents of the renin-angiotensin system 38.1 5.3 10.8 8.6 15.3 9.4 13.5 7.7
Serum-lipid reducing agents 0.0 0.0 1.3 2.3 0.4 0.0 2.3 1.1
Sexual and reproductive system
hormones 0.0 2.7 0.9 0.0 0.0 2.6 0.0 1.1
Systemic corticosteroids 0.0 1.9 0.0 0.0 0.0 1.0 0.0 0.0
Thyroid therapy 0.0 4.5 1.8 1.7 0.2 1.3 0.0 1.9
Systemic antibacterial drugs 0.0 3.9 0.9 0.6 0.0 0.0 1.5 0.1
Anti-infl ammatory and antirheumatic
drugs 0.0 5.0 1.6 3.9 10.2 6.0 3.0 4.3
Muscle relaxants 0.0 3.8 1.2 1.0 0.0 1.1 1.4 0.2
Analgesics 0.0 14.2 3.4 1.2 26.7 32.9 4.5 1.7
Antiepileptic drugs 0.0 3.4 1.9 1.1 3.0 0.0 1.4 1.7
Psycholeptics 0.0 0.4 1.7 1.2 0.0 0.0 2.3 2.6
Psychoanaleptics 0.0 2.9 3.0 3.6 0.0 1.1 4.4 5.3
Other nervous system drugs 0.0 0.3 1.7 0.9 10.2 0.9 1.1 3.4
Anti-asthma drugs 0.0 1.4 4.0 0.5 0.0 0.0 1.6 1.8
Preparations for cough and colds 5.3 0.0 0.1 0.0 0.0 0.0 0.0 0.0
Systemic antihistamines 5.4 1.2 0.2 0.0 0.0 0.0 0.0 0.0
Ophthalmological products 0.8 1.5 4.7 3.8 10.2 0.0 1.7 1.8
Otological products 0.0 1.4 0.0 0.0 0.0 4.7 0.0 0.0
Phytotherapeutic medicines 0.0 2.1 1.5 3.3 0.0 0.0 1.4 2.1
Other non-plant natural products 0.0 1.4 0.0 0.8 0.0 0.0 0.5 0.9
Homeopathic medicines 0.0 2.0 0.0 0.2 0.0 6.9 0.5 3.5
Not identifi ed 1.4 4.4 3.1 6.7 0.0 1.2 5.8 7.7
Others (percentages of use lower than
1.0%) 8.1 1.6 7.3 8.1 2.4 4.1 9.3 7.6
Total 100.0 100.0 100.0 100.0 100.0 100.0 100.0 100.0
a Domains of gender and age lower than 20 years were not shown in the table as they included records of use of medicines
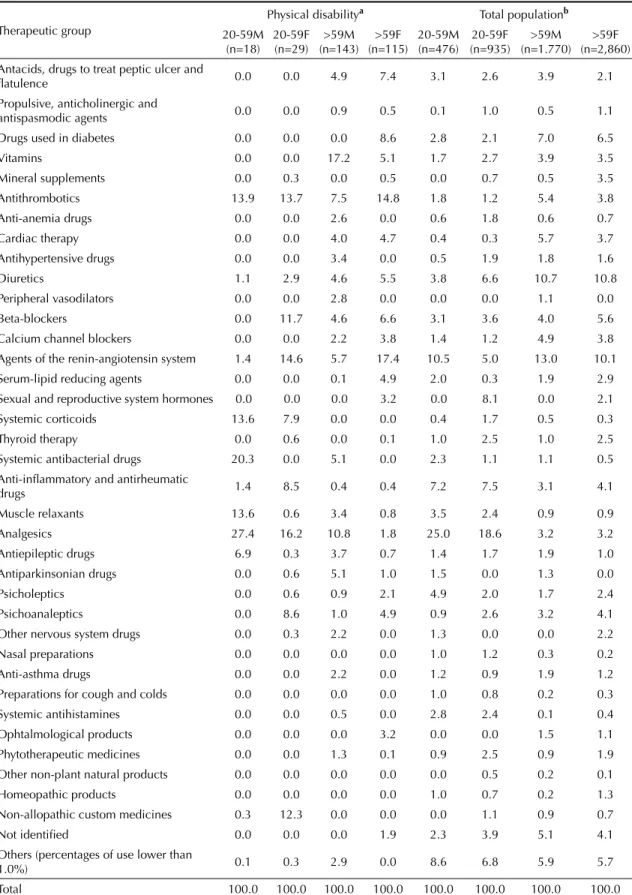
Table 5. Distribution of percentage of groups of medicines consumed in the three days prior to the interview among persons with a physical disability and for the total population,b according to age and gender. State of São Paulo, Southeastern Brazil,
2002-2003.
Therapeutic group
Physical disabilitya Total populationb
20-59M (n=18)
20-59F (n=29)
>59M (n=143)
>59F (n=115)
20-59M (n=476)
20-59F (n=935)
>59M (n=1.770)
>59F (n=2,860) Antacids, drugs to treat peptic ulcer and
fl atulence 0.0 0.0 4.9 7.4 3.1 2.6 3.9 2.1 Propulsive, anticholinergic and
antispasmodic agents 0.0 0.0 0.9 0.5 0.1 1.0 0.5 1.1
Drugs used in diabetes 0.0 0.0 0.0 8.6 2.8 2.1 7.0 6.5 Vitamins 0.0 0.0 17.2 5.1 1.7 2.7 3.9 3.5 Mineral supplements 0.0 0.3 0.0 0.5 0.0 0.7 0.5 3.5 Antithrombotics 13.9 13.7 7.5 14.8 1.8 1.2 5.4 3.8 Anti-anemia drugs 0.0 0.0 2.6 0.0 0.6 1.8 0.6 0.7 Cardiac therapy 0.0 0.0 4.0 4.7 0.4 0.3 5.7 3.7 Antihypertensive drugs 0.0 0.0 3.4 0.0 0.5 1.9 1.8 1.6 Diuretics 1.1 2.9 4.6 5.5 3.8 6.6 10.7 10.8 Peripheral vasodilators 0.0 0.0 2.8 0.0 0.0 0.0 1.1 0.0 Beta-blockers 0.0 11.7 4.6 6.6 3.1 3.6 4.0 5.6 Calcium channel blockers 0.0 0.0 2.2 3.8 1.4 1.2 4.9 3.8 Agents of the renin-angiotensin system 1.4 14.6 5.7 17.4 10.5 5.0 13.0 10.1 Serum-lipid reducing agents 0.0 0.0 0.1 4.9 2.0 0.3 1.9 2.9 Sexual and reproductive system hormones 0.0 0.0 0.0 3.2 0.0 8.1 0.0 2.1 Systemic corticoids 13.6 7.9 0.0 0.0 0.4 1.7 0.5 0.3 Thyroid therapy 0.0 0.6 0.0 0.1 1.0 2.5 1.0 2.5 Systemic antibacterial drugs 20.3 0.0 5.1 0.0 2.3 1.1 1.1 0.5
Anti-infl ammatory and antirheumatic
drugs 1.4 8.5 0.4 0.4 7.2 7.5 3.1 4.1
Muscle relaxants 13.6 0.6 3.4 0.8 3.5 2.4 0.9 0.9 Analgesics 27.4 16.2 10.8 1.8 25.0 18.6 3.2 3.2 Antiepileptic drugs 6.9 0.3 3.7 0.7 1.4 1.7 1.9 1.0 Antiparkinsonian drugs 0.0 0.6 5.1 1.0 1.5 0.0 1.3 0.0 Psicholeptics 0.0 0.6 0.9 2.1 4.9 2.0 1.7 2.4 Psichoanaleptics 0.0 8.6 1.0 4.9 0.9 2.6 3.2 4.1 Other nervous system drugs 0.0 0.3 2.2 0.0 1.3 0.0 0.0 2.2 Nasal preparations 0.0 0.0 0.0 0.0 1.0 1.2 0.3 0.2 Anti-asthma drugs 0.0 0.0 2.2 0.0 1.2 0.9 1.9 1.2
Preparations for cough and colds 0.0 0.0 0.0 0.0 1.0 0.8 0.2 0.3 Systemic antihistamines 0.0 0.0 0.5 0.0 2.8 2.4 0.1 0.4 Ophtalmological products 0.0 0.0 0.0 3.2 0.0 0.0 1.5 1.1 Phytotherapeutic medicines 0.0 0.0 1.3 0.1 0.9 2.5 0.9 1.9 Other non-plant natural products 0.0 0.0 0.0 0.0 0.0 0.5 0.2 0.1 Homeopathic products 0.0 0.0 0.0 0.0 1.0 0.7 0.2 1.3 Non-allopathic custom medicines 0.3 12.3 0.0 0.0 0.0 1.1 0.9 0.7 Not identifi ed 0.0 0.0 0.0 1.9 2.3 3.9 5.1 4.1 Others (percentages of use lower than
1.0%) 0.1 0.3 2.9 0.0 8.6 6.8 5.9 5.7
Total 100.0 100.0 100.0 100.0 100.0 100.0 100.0 100.0
aDomains of gender and age lower than 20 years were not shown in the table as they included records of use of medicines
by fewer than six individuals.
men with physical disability aged more than 59 years, the most frequently consumed therapeutic groups were vitamins (17.2%) and analgesics (10.8%); women with physical disability in the same age group reported greater use of agents of the renin-angiotensin system (17.4%) and antithrombotics (14.8%) (Table 5).
Medicines most frequently consumed by the total population are shown in Table 5. Among men in the total population and aged between 20 and 59 years, analgesics (25.0%) and agents of the renin-angiotensin system (10.5%) were the most frequently consumed medicines; among women in the same age group, anal-gesics (18.6%) and antirheumatic and anti-infl ammatory drugs (7.5%) were those most often reported. Among individuals aged more than 59 years, the most frequently consumed medicines were agents of the renin-angio-tensin system (13.0% of men and 10.1% of women) and diuretics (10.7% of men and 10.8% of women).
DISCUSSION
Considering the lack of population-based, cross-sec-tional studies on use of medicines by individuals with a certain type of disability in the scientifi c literature, comparisons of such use, performed in the present study, will be made with the general population, disre-garding the presence or absence of disabilities.
The prevalence of use of medicines in the total popu-lation was similar to those found by Sans et al22 (2002) in a study with the same methodology, in Cataluña, in 2001. The authors found a prevalence of 26% for men and 38% for women.
Bertoldi et al2 (2004), in a population-based, cross-sectional study with a weighted sample, performed in the city of Pelotas, Southern Brazil, reported preva-lences of 65.9% in the general population, 49.3% in men and 69.7% in women, contrasting with data found in the present study, which were 38.9%, 30.9% and 45.9% for the general population, men and women, respectively. However, the length of time of use of medicines was 15 days in the study by Bertoldi et al.2 These authors2 also showed other prevalences, found by different researchers: a prevalence of 69.9% of use of medicines in adults, when the suggested length of time of use was 30 days; when this length of time was 90 days, prevalence rose to 73.3%.
Loyola Filho et al14 (2002) obtained a prevalence of use of medicines of 78.2% among female participants aged 18 years, against 21.8% among males, using a three-month recall period in the city of Bambuí, Southeastern Brazil.
With regard to the diversity of recall periods, Pelicioni (2005)a calculates that a long interval of time would reduce respondent’s recall of certain medicines used,
thus leading to underreporting. Nevertheless, the author considers that, the longer the recall period used, the higher the probability of rarely consumed medicines being reported, which could be particularly important in a study with a reduced sample. The present study, however, is population-based, rendering the adoption of long recall periods unnecessary. As a result, recall of the three days prior to interview was adopted. Moreover, in a multi-center study performed in different countries, Kohn et al (1976),12 reported that a recall period of approximately two days, used to estimate the prevalence of use of medicines, promoted respondents’ recall, resulting in reliable data.
Persons with disabilities used medicines more frequently, when compared to non-disabled ones. This fact could be due to characteristics of the health status of this population, usually more exposed to diseases resulting from age and gender, rather than exclusively the disability itself, thus requiring more health care. In addition, the chronicity of diseases could lead to a debilitating process and require pharmacological care for those affected. A higher incidence of comorbidi-ties among persons with disabilicomorbidi-ties is reported in the literature,11 which could indicate a greater need for pharmaceutical assistance.
Adjustment variables seem to have several infl uences, when the three types of disabilities are considered. Among persons with visual or hearing disabilities, the signifi cance of use of at least one medicine does not remain after adjustment. This fact could indicate that a greater use of medicines in these two populations could be more of a result of other factors (gender, age and level of education) than the disability itself. A different pattern occurs among persons with physical disabi-lities. In this group, adjustment variables are shown as confounding variables, changing after adjustment to PR (crude PR = 1.6; adjusted PR = 1.2), although without loss of statistical signifi cance. The greater use of medicines among persons with physical disabilities could have resulted from their health status, promo-ting this greater use due to the comorbidities to which they are exposed.6 This could indicate that a disability or debilitating process in itself may be more closely associated with greater use of medicines.
However, when the number of medicines consumed was analyzed, it is observed that, even after adjustment, the signifi cance remained among persons with a physical or visual disability. It can be inferred from such data that those with physical or visual disabilities tend to consume more types of medicines than non-disabled ones, something that does not occur among those with a hearing disability.
of medicines prescribed by doctors or dentists could indicate greater search for such type of care, empha-sizing the idea of implementation of a specifi c health care policy for persons with disabilities.
In general, the group of medicines most frequently used by persons with disabilities were the analgesics, followed by antithrombotics. The greater use of anal-gesics could be justifi ed by the frequent occurrence of pain among persons with a physical disability.9,19 Studies on the use of analgesics in the general popula-tion show different values, according to the country and methodology adopted. In Brazil, use of analgesics was reported by 22% of respondents in a national survey
conducted in 2003.3 Use of medicines was reported
by 73% of respondents who mentioned pain in fi ve
Turkish cities.16 In a study performed in Norway, 54% of respondents reported consuming analgesics in the 14 days prior to the interview.8 In the United States, the percentage of individuals who use analgesics reach 76%.17 Diuretics also show variable percentages of use in the population, with values of 24.6% and 36.9% being recorded among men and women aged 75 years or more, respectively, in a study performed in the
United States.7 A study performed in Holland with
hospitalized patients aged 75 years or more observed 37.7% of use of diuretics.25 Population data on the use of antithrombotics or agents of the renin-angiotensin system were not found for this discussion.
The use of antithrombotics is the recommended therapy to decrease the chances of recurrent thromboembolic accidents, whose frequency increases with the immo-bility that may be caused by the disaimmo-bility. The agents of the renin-angiotensin system were the third most frequently used group of medicines.
There was greater use of diuretics among persons with a visual disability. Certain authors point to a possible
relationship between use of medicines and possible harmful effects on sight.13,15 The second most frequently used group of medicines were the agents of the renin-angiotensin system, followed by analgesics. Agents of the renin-angiotensin system are probably used because of the population’s greater longevity and the group of diseases it leads to, once these medicines also play a role in fi ghting hypertension.21 Among persons with a hearing disability, analgesics were the most frequently consumed medicines. The use of agents of the renin-angiotensin system came in second. This use in both groups probably occurs due to the population’s greater longevity and the group of diseases it leads to,23 because such medicines play a role in fi ghting diseases that are typical in the elderly. The use of analgesics is also associated with age, once the threshold of pain changes with age, requiring changes in the therapy with analgesics.10
Low frequencies of report of use of medicines in certain domains of age or gender can be a limitation to the study. However, the present cross-sectional study with a representative sample shows data that only refl ect the profi le of the population analyzed. Another possible explanation could be the low occurrence of individuals in certain domains.
The use of medicines among individuals with visual, hearing or physical disabilities was always greater than non-disabled ones. Use of medicines was greater among persons with a physical disability. This greater use could be explained by the health status of such indi-viduals, which often requires greater health care. This care needed by persons with disabilities also includes medicines, which are factors that can contribute to changes in the quality of life of individuals, as their health improves, in addition to probably reducing costs with hospitalizations caused by comorbidities.
1. Barros AJD, Hirakata VN. Alternatives for logistic regression in cross-sectional studies: an empirical comparison of models that directly estimate the prevalence ratio. BMC Med Res Methodol. 2003;3:21. DOI:10.1186/1471-2288-3-21
2. Bertoldi AD, Barros AJD, Hallal PC, Lima RC. Utilização de medicamentos em adultos:
prevalência e determinantes individuais. Rev Saude Publica. 2004;38(2):228-38. DOI:10.1590/S0034-89102004000200012
3. Carvalho MF, Pascom ARP, Souza-Jr PRB, Damacena GM, Szwarcwald CL. Utilization of medicines by the Brazilian population, 2003. Cad Saude Publica. 2005;21 (Suppl 1):100-8. DOI:10.1590/S0102-311X2005000700011
4. Castro SS, Cesar CLG, Carandina L, Barros MBA, Alves MCGP, Goldbaum M. Defi ciência visual, auditiva e física: prevalência e fatores associados
em estudo de base populacional. Cad Saude Publica. 2008;24(8):1773-82. DOI:10.1590/S0102-311X2008000800006
5. Castro SS, Cesar CL, Carandina L, Barros MB, Alves MC, Goldbaum M. Physical disability, recent illnesses and health self-assessment in a population-based study in São Paulo, Brazil. Disabil Rehabil. Epub 2010 Feb 16. DOI: 10.3109/09638281003611060
6. Coyle CP, Santiago MC, Shank JW, Ma GX, Boyd R. Secondary conditions and women with physical disabilities: a descriptive study. Arch Phys Med Rehabil. 2000;81(10):1380-7. DOI:10.1053/ apmr.2000.9169
This article was based on the master’s dissertation by Castro SS, presented to the Programa de Pós-graduação em Saúde Pública of the Faculdade de Saúde Pública, Universidade de São Paulo, in 2006.
Castro SS was granted a master’s degree scholarship by the Conselho Nacional de Desenvolvimento Científi co e Tecnológico (CNPq – National Council for Scientifi c and Technological Development – Process 133707/2004-0).
The authors declare that there are no confl icts of interest 8. Eggen AE. The Tromsø study: Frequency and predicting
factors of analgesic drug use in a free-living population (12–56 years). J Clin Epidemiol. 1993;46(11):1297-304. DOI:10.1016/0895-4356(93)90098-L
9. Ehde DM, Jensen MP, Engel JM, Turner JA, Hoffman AJ, Cardenas DD. Chronic pain secondary to disability: a review. Clin J Pain. 2003;19(1):3-17. DOI:10.1097/00002508-200301000-00002
10. Gloth FM 3rd. Concerns with chronic analgesic therapy in elderly patients. Am J Med. 1996;101(1A):19S-24.
11. Harrison T. Health promotion for persons with disabilities: what does the literature reveal? Fam Community Health. 2006;29(1 Suppl):12-9.
12. Kohn R, White KL. Health care: an international study. London: Oxford University Press; 1976.
13. De La Marnierre E, Guigon B, Quaranta M, Mauget-Faÿsse M. Phototoxic drugs and age-related maculopathy. J Fr Ophtalmol. 2003;26(6):596-601.
14. Loyola Filho AI, Uchoa E, Guerra HL, Firmo JOA, Lima-Costa MF. Prevalência e fatores associados à automedicação: resultados do projeto Bambuí. Rev Saude Publica. 2002;36(1):55-62. DOI:10.1590/ S0034-89102002000100009
15. McCarty CA, Mukesh BN, Fu CL, Taylor HR. The epidemiology of cataract in Australia. Am J Ophthalmol. 1999;128(4):446-65. DOI:10.1016/ S0002-9394(99)00218-4
16. Ozkan O, Hamzaoglu O, Erdine S, Balta E, Domac M. Use of analgesics in adults with pain complaints: prevalence and associated factors, Turkey. Rev Saude Publica. 2009;43(1):140-6. DOI:10.1590/S0034-89102009000100018
17. Paulose-Ram R, Hirsch R, Dillon C, Losonczy K, Cooper M, Ostchega Y. Prescription and non-prescription analgesic use among the US adult population: results from the third National Health and Nutrition Examination Survey (NHANES III).
Pharmacoepidemiol Drug Saf. 2003;12(4):315-26. DOI:10.1002/pds.755
18. Picavet HSJ, Hoeymans, N. Physical disability in the Netherlands: prevalence, risk groups and time trends.
Public Health. 2002;116(4):231-7.
19. Robinson JP, Turk DC, Loeser JD. Pain, impairment, and disability in the AMA guides. J Law Med Ethics. 2004;32(2):315-26. DOI:10.1111/j.1748-720X.2004. tb00478.x
20. Rozenfeld S. Prevalência, fatores associados e mau uso de medicamentos entre idosos: uma revisão. Cad Saude Publica. 2003;19(3):717-24. DOI:10.1590/ S0102-311X2003000300004
21. Safar ME. Systolic hypertension in the elderly: arterial wall mechanical properties and the renin-angiotensin-aldosterone system. J Hypertens. 2005;23(4):673-81. DOI:10.1097/01.hjh.0000163130.39149.fe
22. Sans S, Paluzie G, Puig T, Balañá L, Balaguer-Vintró I. Prevalencia del consumo de medicamentos em la población adulta de Cataluña. Gac Sanit. 2002;16(2):121-30.
23. Santos V, Nitrini SMOO. Indicadores do uso de medicamentos prescritos e de assistência ao paciente de serviços de saúde. Rev Saude Publica. 2004;38(6):819-26. DOI:10.1590/S0034-89102004000600010
24. Schiaffi no A, Rodriguez M, Pasarin MI, Regidor E, Borrel C, Fernandez E. ¿Odds Ratio o razón de proporciones? Su utilización en estudios transversales.
Gac Sanit. 2003;17(1):70-4. DOI:10.1157/13043426
25. van Kraaij DJ, Jansen RW, Gribnau FW, Hoefnagels WH. Use of diuretics and opportunities for withdrawal in a Dutch nursing home population.
Neth J Med. 1998;53(1):20-6. DOI:10.1016/S0300-2977(98)00053-9