Factors associated with self-reported
diabetes according to the 2013
National Health Survey
Deborah Carvalho MaltaI, Regina Tomie Ivata BernalII,Betine Pinto Moehlecke IserIII,IV,
Célia Landmann SzwarcwaldV, BruceBartholow DuncanIII, Maria InêsSchmidtIV
I Departamento de Enfermagem Materno Infantil e Saúde Pública. Escola de Enfermagem. Universidade Federal
de Minas Gerais. Belo Horizonte, MG, Brasil
II Núcleo de Pesquisas Epidemiológicas em Nutrição e Saúde. Universidade de São Paulo. São Paulo, SP, Brasil III Programa de Pós-Graduação em Epidemiologia. Universidade Federal do Rio Grande do Sul. Porto Alegre, RS, Brasil IV Faculdade de Medicina. Universidade do Sul de Santa Catarina. Tubarão, SC, Brasil
V Instituto de Comunicação e Informação Científica e Tecnológica em Saúde. Fundação Oswaldo Cruz.
Rio de Janeiro, RJ, Brasil
ABSTRACT
OBJECTIVES: To analyze the factors associated with self-reported diabetes among adult participants of the National Health Survey (PNS).
METHODS: Cross-sectional study using data of the PNS carried out in 2013, from interviews with adults (≥ 18 years) of 64,348 Brazilian households. he prevalence of self-reported diabetes, assessed by the question “Has a doctor ever told you that you have diabetes?,” was related to sociodemographic characteristics, lifestyle, self-reported chronic disease, and self-evaluation of the health condition. Prevalence ratios were adjusted according to age, sex, and schooling by Poisson regression with robust variance.
RESULTS: he diagnosis of diabetes was reported by 6.2% of respondents. Its crude prevalence was higher in women (7.0% vs. 5.4%), and among older adults, reaching 19.8% in the elderly. Black adults who received less schooling showed higher prevalence. Among those classiied as obese, 11.8% reported having diabetes. Ex-smokers, those insuiciently active and those who consume alcohol abusively reported diabetes more often. Diferences were not veriied in eating habits among adults who reported, or did not, diabetes. A relation between diabetes and hypertension was found.
CONCLUSIONS: After adjustment according to age, schooling and sex, diabetes was shown to be associated with higher age, lower schooling, past smoking, overweight and obesity, and hypertension, as well as with a self-declared poor state of health, indicating a pattern of risk factors common to many chronic non-communicable diseases and the association of the disease with morbidity.
DESCRIPTORS: Adult. Diabetes Mellitus, epidemiology. Diagnostic Self Evaluation. Risk Factors. Socioeconomic Factors. Health Surveys.
Correspondence: Deborah Carvalho Malta Departamento de Enfermagem Materno Infantil e Saúde Pública, Escola de Enfermagem – UFMG Av. Alfredo Balena, 190, Santa Efigênia
30130-100 Belo Horizonte, MG, Brasil
E-mail: dcmalta@uol.com.br
Received: 6 May 2016 Approved: 3 Sep 2016
How to cite: Malta DC, Bernal RTI, Iser BPM, Szwarcwald CL, Duncan BB, Schmidt MI. Factors associated with self-reported diabetes according to the 2013 National Health Survey. Rev Saude Publica. 2017;51 Suppl 1:12s.
Copyright: This is an open-access article distributed under the terms of the Creative Commons Attribution License, which permits unrestricted use, distribution, and reproduction in any medium, provided that the original author and source are credited.
INTRODUCTION
he prevalence of diabetes is growing globally, partly due to the demographic transition, but
also due to urbanization and to unhealthy lifestyles, such as sedentariness and inadequate eating habits, which results in metabolic changes and excess weight1,a. Studies show that
interventions that lead to lifestyle changes, such as the practice of physical activity and adoption of a healthy eating pattern, can prevent diabetes mellitus2-4.
he World Health Organization (WHO) estimates that diabetes mellitus has been responsible for 1.5 million deaths in 2012a. Due to its numerous comorbidities and complications, diabetes
afects the occupational and social life of those with the condition and causes direct and
indirect costs to them and to society.
Estimates based on data from 193 countries indicate global expenditures on diabetes of 376 billion U.S. dollars in 2010, representing 12% of total health expenditures, and with projection to reach 490 billion dollars in 20305. A study in Brazil, which evaluated data from 1,000 patients seen at diferent levels of health care in eight Brazilian cities, estimated a total cost of more than two thousand dollars per patient per year, 63% of which were related to direct costs6. he National Health Survey (PNS), a major national representative survey, was conducted in Brazil in 2013b. In addition to diabetes and other chronic diseases, modules were included
on demographic, nutritional factors, lifestyle, use of medicines, among others, which enables comprehensive analysis about the factors associated with self-reported diabetes.
his study aimed to analyze the factors associated with self-reported diabetes among adults interviewed on PNS. Speciically, sociodemographic factors, overweight, behavioral risk and protective factors, eating habits and smoking will be assessed, as well as perception of health
and comorbidities, such as hypertension and dyslipidemia.
METHODS
his is a cross-sectional study using data of the PNS carried out in 2013, household survey that employed sampling consisting of three-stage conglomerate, with stratiication of the primary sampling units. he census tracts or set of tracts were the primary units, the households were the second-stage units, and the residents aged 18 years or older, third-stage units.
Within each household, one resident aged 18 years or more was selected from the list of residents prepared at the time of the interview to answer to a speciic questionnaire7. he
sample drafted consisted of 81,357 households, 69,994 of which, being occupied, were considered eligible for the research. At the end, interviews were held in 64,348 households (non-response rate of 8.1%)8.
he outcome analyzed in this study was the prevalence of self-reported diabetes, according
to the positive answer to the question “Has a doctor ever told you that you have diabetes?”
he explanatory variables were: a) sociodemographic characteristics: sex, age, schooling, race/color); b) habits and lifestyles considered risk factors (insuiciency in the four domains of physical activity [leisure, work, commute to work, and home], smoking, consumption of red meat with fat, report of high salt intake and abusive consumption of alcohol); c) habits and lifestyles considered protective factors: recommended intake of fruits and vegetables (5 or more servings per day); d) metabolic risk factors for cardiovascular disease
(overweight and obesity, hypertension, high cholesterol); e) self-assessment of one’s state
of health. Bivariate analysis and calculation of prevalence were performed with 95% conidence interval (95%CI). Prevalence ratios (PR) were calculated by the method of
Poisson regression with robust variance, and presented both crude and adjusted according to age, sex and schooling for the global sample and by age and schooling in each category
of sex. We used the version 12.1 Stata (Stata Corp, College Station, USA) for data processing
and statistical analysis.
a World Health Organization.
Global status report on noncommunicable diseases 2014. Geneva: WHO; 2014 [cited 2015 Jan 29]. Available from: http://www.who.int/ nmh/publications/ncd-status-report-2014/en/
b Instituto Brasileiro de Geografia
his study was approved by the Comissão Nacional de Ética em Pesquisa (CONEP – National Commission of Ethics in Research) in June 2013 (no. 328,159).
RESULTS
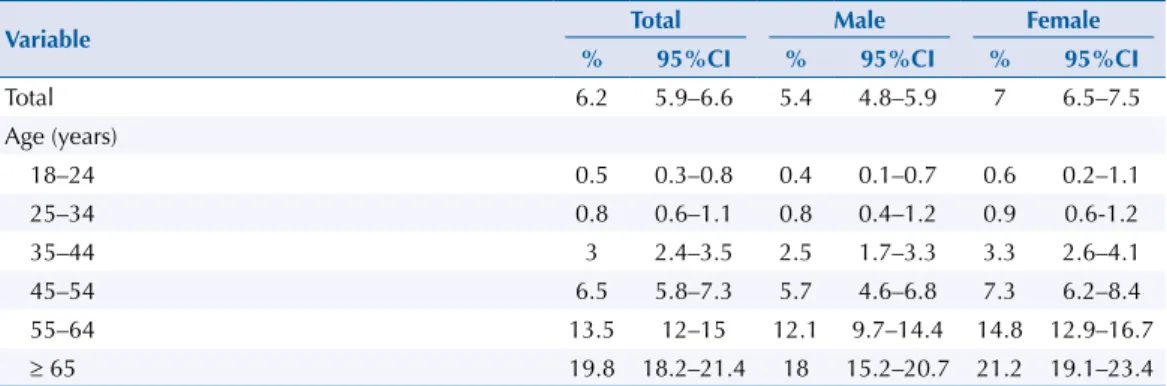
Table 1 describes the prevalence of self-reported diabetes in the sample and separately for men and women, according to various factors often associated with the diagnosis of diabetes.
he prevalence of self-reported diabetes was always greater in women and increased notably with age, reaching 19.8% in those with more than 65 years. he prevalence decreased as schooling increased, and tended to be higher in black people. Diabetes was mentioned more often in those who reported practicing very little physical activity. Ex-smokers reported diabetes more frequently than smokers and non-smokers.
Regarding eating habits, the prevalence was higher among those who reported consuming ive or more servings of fruits and vegetables (8.0% vs. 5.9%); the prevalence was lower among
those who reported consuming red meat with fat and excess salt, in relation to the others.
A greater frequency of self-reported diabetes was observed in individuals who reported drinking alcohol excessively (6.6% vs. 2.6% among the others).
Among those classiied as obese, 11.8% reported having diabetes, in contrast to those of low weight or eutrophic, of which only 3.3% reported having diabetes. he frequency of self-reported diabetes
was higher among those who reported previous diagnosis of hypertension or high cholesterol.
In those who considered their health poor or very poor, the rate reached 19.1%.
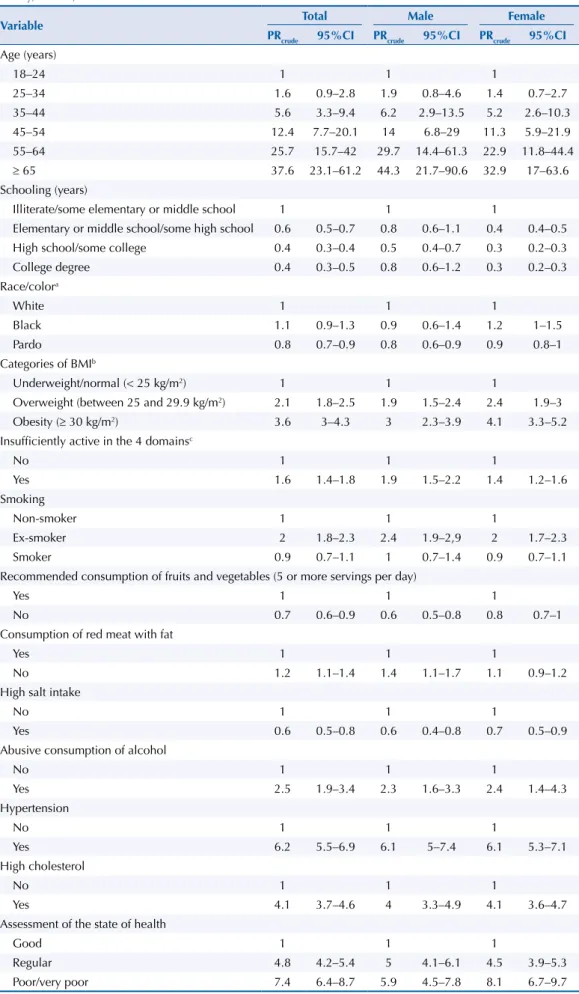
Table 2 describes the magnitude of these associations, which varied considerably among
the factors analyzed. For example, in individuals aged more than 65 years, the prevalence is
37 times higher than in youngest individuals; regarding schooling, individuals with higher
schooling showed lower PR, reaching PR = 0.4 overall for those with a college degree and PR = 0.3 among women with college degree, compared with those illiterate or with some elementary or middle school. In general, known risk factors (tobacco, BMI, consumption
of fruit and vegetables, meat with fat, alcohol, excess salt, physical inactivity, hypertension,
cholesterol, health assessment) showed statistically signiicant associations with diabetes, except for a lack of predominance among black individuals in relation to the others. In men, the inverse association with the schooling was not statistically signiicant.
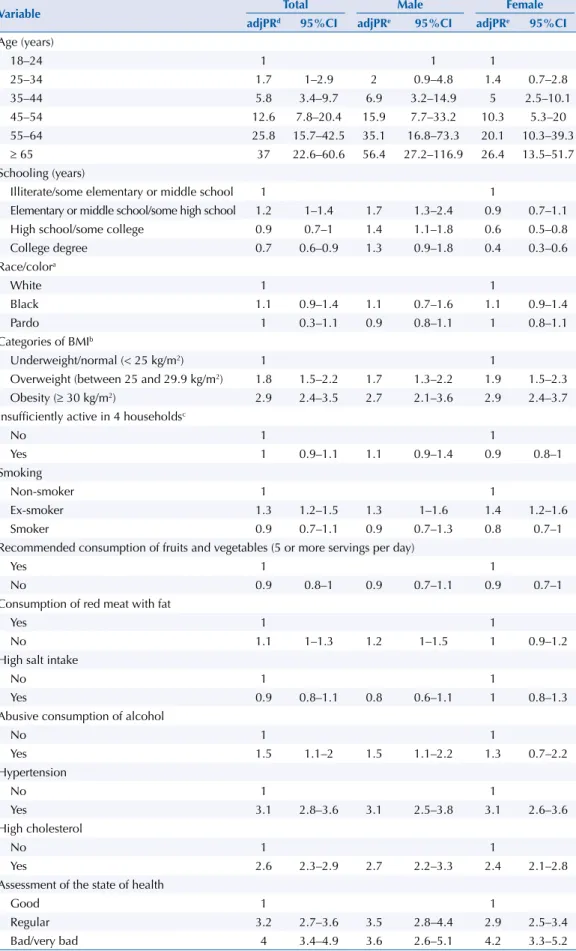
To consider possible factors in the interpretation of these associations, adjustments were made
for diferences of age, sex, and schooling, as presented in Table 3. he increase by age group was higher in men than in women. Associations with factors that increase progressively with
age, such as hypertension, high cholesterol and self-perception of poor health were lower after
the adjustments, but remained statistically signiicant. Diferences regarding eating habits and physical activity indicators lost signiicance, but overweight, obesity, alcohol consumption and smoking cessation remained associated. he inverse association between schooling and
self-reported diabetes, observed in women, remained the same after these adjustments.
Table 1. Prevalence of diabetes in adults by sex, according to sociodemographic factors. National Health Survey, Brazil, 2013.
Variable Total Male Female
% 95%CI % 95%CI % 95%CI
Total 6.2 5.9–6.6 5.4 4.8–5.9 7 6.5–7.5
Age (years)
18–24 0.5 0.3–0.8 0.4 0.1–0.7 0.6 0.2–1.1
25–34 0.8 0.6–1.1 0.8 0.4–1.2 0.9 0.6-1.2
35–44 3 2.4–3.5 2.5 1.7–3.3 3.3 2.6–4.1
45–54 6.5 5.8–7.3 5.7 4.6–6.8 7.3 6.2–8.4
55–64 13.5 12–15 12.1 9.7–14.4 14.8 12.9–16.7
Schooling (years)
Illiterate/some elementary or middle school 9.6 8.9–10.3 6.7 5.8–7.6 12.3 11.3–13.4
Elementary or middle school/some high school 5.4 4.4–6.3 5.4 3.8–6.9 5.4 4.3–6.4
High school/some college 3.4 3–3.9 3.6 2.8–4.3 3.3 2.7–3.9
College degree 4.2 3.3–5 5.7 4–7.4 3.1 2.2–3.9
Race/colora
White 6.7 6.1–7.2 6 5.2–6.8 7.3 6.5–8
Black 7.2 5.8–8.5 5.4 3.2–7.6 8.7 7.1–10.4
Pardo 5.5 5.1–6 4.6 3.9–5.2 6.4 5.8–7
Categories of BMIb
Underweight/normal (< 25 kg/m2) 3.3 2.8–3.8 3.4 2.7–4.2 3.2 2.5–3.8
Overweight (between 25 and 29.9 kg/m2) 6.9 6.1–7.7 6.5 5.3–7.6 7.5 6.4–8.6
Obesity (≥ 30 kg/m2) 11.8 10.4–13.1 10.3 8.5–12.1 13 11.2–14.8
Insufficiently active in the 4 domainsc
No 4.9 4.5–5.3 4 3.5–4.5 5.9 5.2–6.6
Yes 7.8 7.3–8.4 7.4 6.4–8.5 8.1 7.4–8.7
Smoking
Non-smoker 5.4 5–5.8 4.1 3.6–4.7 6.2 5.7–6.8
Ex-smoker 10.8 9.8–11.9 9.8 8.3–11.3 12.2 10.7–13.8
Smoker 4.8 3.9–5.7 4.2 2.9–5.5 5.7 4.5–6.8
Recommended consumption of fruits and vegetables (5 or more servings per day)
Yes 8 7–8.9 7.8 6.4–9.2 8.1 6.8–9.3
No 5.9 5.5–6.3 5 4.4–5.6 6.8 6.3–7.3
Consumption of red meat with fat
Yes 5.4 4.8–6 4.4 3.6–5.2 6.7 5.8–7.6
No 6.7 6.2–7.1 6 5.3–6.7 7.1 6.6–7.7
High salt intake
No 6.6 6.2–7 5.7 5.1–6.3 7.3 6.8–7.8
Yes 4.2 3.4–5 3.5 2.4–4.5 5.1 3.8–6.3
Abusive consumption of alcohol
No 2.6 1.8–3.3 2.4 1.6–3.3 3 1.2–4.7
Yes 6.5 6.1–6.8 5.7 5.1–6.3 7.1 6.6–7.6
Systemic hypertension
No 3 2.7–3.2 2.8 2.4–3.2 3.1 2.8–3.5
Yes 18.3 17–19.5 16.9 14.7–19 19.2 17.6–20.8
High cholesterol
No 4.5 4.1–4.8 4.1 3.6–4.7 4.8 4.4–5.2
Yes 18.5 16.9–20.1 16.7 13.9–19.4 19.6 17.6–21.5
Assessment of the state of health
Good 2.6 2.3–2.8 2.4 2–2.8 2.7 2.4–3.1
Regular 12.2 11.3–13.2 12 10.4–13.6 12.4 11.2–13.5
Poor/very poor 19.1 16.9–21.2 14.2 11–17.4 22.1 19.3–25
BMI: body mass index.
a The categories yellow and indigenous were excluded from these analyses. b 32% missing data for BMI.
Table 2. Prevalence ratio (crude) and 95% confidence interval for diabetes in adults, stratified by sex, according to sociodemographic characteristics, clinical conditions and lifestyles. National Health Survey, Brazil, 2013.
Variable Total Male Female
PRcrude 95%CI PRcrude 95%CI PRcrude 95%CI Age (years)
18–24 1 1 1
25–34 1.6 0.9–2.8 1.9 0.8–4.6 1.4 0.7–2.7
35–44 5.6 3.3–9.4 6.2 2.9–13.5 5.2 2.6–10.3
45–54 12.4 7.7–20.1 14 6.8–29 11.3 5.9–21.9
55–64 25.7 15.7–42 29.7 14.4–61.3 22.9 11.8–44.4
≥ 65 37.6 23.1–61.2 44.3 21.7–90.6 32.9 17–63.6
Schooling (years)
Illiterate/some elementary or middle school 1 1 1
Elementary or middle school/some high school 0.6 0.5–0.7 0.8 0.6–1.1 0.4 0.4–0.5
High school/some college 0.4 0.3–0.4 0.5 0.4–0.7 0.3 0.2–0.3
College degree 0.4 0.3–0.5 0.8 0.6–1.2 0.3 0.2–0.3
Race/colora
White 1 1 1
Black 1.1 0.9–1.3 0.9 0.6–1.4 1.2 1–1.5
Pardo 0.8 0.7–0.9 0.8 0.6–0.9 0.9 0.8–1
Categories of BMIb
Underweight/normal (< 25 kg/m2) 1 1 1
Overweight (between 25 and 29.9 kg/m2) 2.1 1.8–2.5 1.9 1.5–2.4 2.4 1.9–3
Obesity (≥ 30 kg/m2) 3.6 3–4.3 3 2.3–3.9 4.1 3.3–5.2
Insufficiently active in the 4 domainsc
No 1 1 1
Yes 1.6 1.4–1.8 1.9 1.5–2.2 1.4 1.2–1.6
Smoking
Non-smoker 1 1 1
Ex-smoker 2 1.8–2.3 2.4 1.9–2,9 2 1.7–2.3
Smoker 0.9 0.7–1.1 1 0.7–1.4 0.9 0.7–1.1
Recommended consumption of fruits and vegetables (5 or more servings per day)
Yes 1 1 1
No 0.7 0.6–0.9 0.6 0.5–0.8 0.8 0.7–1
Consumption of red meat with fat
Yes 1 1 1
No 1.2 1.1–1.4 1.4 1.1–1.7 1.1 0.9–1.2
High salt intake
No 1 1 1
Yes 0.6 0.5–0.8 0.6 0.4–0.8 0.7 0.5–0.9
Abusive consumption of alcohol
No 1 1 1
Yes 2.5 1.9–3.4 2.3 1.6–3.3 2.4 1.4–4.3
Hypertension
No 1 1 1
Yes 6.2 5.5–6.9 6.1 5–7.4 6.1 5.3–7.1
High cholesterol
No 1 1 1
Yes 4.1 3.7–4.6 4 3.3–4.9 4.1 3.6–4.7
Assessment of the state of health
Good 1 1 1
Regular 4.8 4.2–5.4 5 4.1–6.1 4.5 3.9–5.3
Poor/very poor 7.4 6.4–8.7 5.9 4.5–7.8 8.1 6.7–9.7
BMI: body mass index.
a The categories yellow and indigenous were excluded from these analyses. b 32% missing data for BMI.
Table 3. Adjusted prevalence ratiod and 95% confidence interval for diabetes in adults stratified by sex,
according to sociodemographic characteristics, clinical conditions, and lifestyles. National Health Survey, Brazil, 2013.
Variable Total Male Female
adjPRd 95%CI adjPRe 95%CI adjPRe 95%CI
Age (years)
18–24 1 1 1
25–34 1.7 1–2.9 2 0.9–4.8 1.4 0.7–2.8
35–44 5.8 3.4–9.7 6.9 3.2–14.9 5 2.5–10.1
45–54 12.6 7.8–20.4 15.9 7.7–33.2 10.3 5.3–20
55–64 25.8 15.7–42.5 35.1 16.8–73.3 20.1 10.3–39.3
≥ 65 37 22.6–60.6 56.4 27.2–116.9 26.4 13.5–51.7
Schooling (years)
Illiterate/some elementary or middle school 1 1
Elementary or middle school/some high school 1.2 1–1.4 1.7 1.3–2.4 0.9 0.7–1.1
High school/some college 0.9 0.7–1 1.4 1.1–1.8 0.6 0.5–0.8
College degree 0.7 0.6–0.9 1.3 0.9–1.8 0.4 0.3–0.6
Race/colora
White 1 1
Black 1.1 0.9–1.4 1.1 0.7–1.6 1.1 0.9–1.4
Pardo 1 0.3–1.1 0.9 0.8–1.1 1 0.8–1.1
Categories of BMIb
Underweight/normal (< 25 kg/m2) 1 1
Overweight (between 25 and 29.9 kg/m2) 1.8 1.5–2.2 1.7 1.3–2.2 1.9 1.5–2.3
Obesity (≥ 30 kg/m2) 2.9 2.4–3.5 2.7 2.1–3.6 2.9 2.4–3.7
Insufficiently active in 4 householdsc
No 1 1
Yes 1 0.9–1.1 1.1 0.9–1.4 0.9 0.8–1
Smoking
Non-smoker 1 1
Ex-smoker 1.3 1.2–1.5 1.3 1–1.6 1.4 1.2–1.6
Smoker 0.9 0.7–1.1 0.9 0.7–1.3 0.8 0.7–1
Recommended consumption of fruits and vegetables (5 or more servings per day)
Yes 1 1
No 0.9 0.8–1 0.9 0.7–1.1 0.9 0.7–1
Consumption of red meat with fat
Yes 1 1
No 1.1 1–1.3 1.2 1–1.5 1 0.9–1.2
High salt intake
No 1 1
Yes 0.9 0.8–1.1 0.8 0.6–1.1 1 0.8–1.3
Abusive consumption of alcohol
No 1 1
Yes 1.5 1.1–2 1.5 1.1–2.2 1.3 0.7–2.2
Hypertension
No 1 1
Yes 3.1 2.8–3.6 3.1 2.5–3.8 3.1 2.6–3.6
High cholesterol
No 1 1
Yes 2.6 2.3–2.9 2.7 2.2–3.3 2.4 2.1–2.8
Assessment of the state of health
Good 1 1
Regular 3.2 2.7–3.6 3.5 2.8–4.4 2.9 2.5–3.4
Bad/very bad 4 3.4–4.9 3.6 2.6–5.1 4.2 3.3–5.2
BMI: body mass index.
a Excluded the categories yellow and Indian. b 32% missing data for BMI.
c Physical activity domains: leisure, work, commute to work, and home. d PR adjusted by age, sex, and schooling.
DISCUSSION
Data of the PNS, held in 2013, estimate that 6.2% of individuals with 18 years or more have received medical diagnosis of diabetes, which suggests that 9.1 million Brazilian adults have diabetesb.
Type 2 diabetes is the result of an interaction between genetic and environmental factors9. Among the factors of context, we highlight the rapid transformations in eating patterns, with
the introduction of foods rich in fat and simple carbohydrates, as well as a reduction in physical activity levels, resulting in the accelerated increase of overweight and obesity10,11. To stop
diabetes, measures aiming at behavioral changes are fundamental, such as increased intake of cofee, integral grains, fruits and nuts; reduction of saturated and trans fat intake, reined grains, red or processed meat, and sugary drinks; moderate consumption of alcohol; implementation of systematic physical activity; weight maintenance; and reduction of the habit of smoking4,12. Among the factors associated with diabetes, this study identiied a greater prevalence among women. his inding is common in self-report studies as the increased use of health services
by women results in a greater opportunity for medical diagnosis, and has been reported in
other Brazilian studies1,13. However, a greater prevalence in women is not uniformly reported
in the literature, especially when biochemical measurements and adjustments for other sociodemographic characteristics are used14,15. In the Brazilian Longitudinal Study of Adult Health (ELSA-Brasil), conducted in six Brazilian cities and using biochemical measures, Schmidt et al. found a 43% higher prevalence of diabetes among men16.
he positive association between diabetes and increasing age is already considerably based
on the literature4,9,10,17,c. In the age group above 65 years, diabetes is known to be present in about a ifth of the population, a fact that can be justiied by the changes inherent in the
aging process, by the reduction of physical activity and lifelong unhealthy eating habits.
Additionally, this age group has a greater opportunity for diagnosis, especially in men, due to screening of the disease, which is indicated for everyone after 45 years of age2,d.
On the other hand, the prevalence of diabetes, as well as that of the metabolic syndrome,
associated with cardiovascular diseases in adult lifehas also been rising in younger populations18-20. he increase in the prevalence of obesity in adolescence in recent years
explains, to a large extent, the progress of type 2 diabetes mellitus in young populations.
he inverse relation between self-reported diabetes and schooling has been described in other Brazilian studies1,13,14,e. he study by Schmidt et al.16 also showed inverse relation even
when considering the total prevalence of diabetes. Similar results were found in international
studies, such as the Alameda County Study, published in 2005 by Maty et al.21, which indicated
an association between schooling and diabetes mellitus, after adjustment for income and occupation variables. Higher schooling can be a protective factor for diabetes due to the increased access to health promotion practices, such as healthy eating habits and physical activity, in addition to greater access to health services9,22.
he crude prevalence of diabetes was lower in pardos, but when adjusted by age, schooling and
sex, the diferences according to race/color were not signiicant. his relation is inconclusive in the literature. Although some studies indicate higher prevalence of diabetes among black adults14,16, recent analyses of Vigitel (telephone survey) also did not ind association
of diabetes according to race/color23. Again, diferences in disease detection methods can
inluence this result. In ELSA-Brasil, the prevalence of diabetes, determined by report and also by laboratory tests, was 9% higher in pardos and 38% higher in black people than in
white people16. he consumption of 400 g per day of fruits and vegetables is recommended by the WHO to reduce the incidence of cardiovascular diseases and certain types of cancer
and also to prevent and treat overweight and diabetesa.hese foods provide the least amount
of saturated fat and cholesterol, being appropriate in the diabetic diet4, as opposed to the consumption of fatty foods, which constitute a risk factor for cardiovascular diseases and
obesity4,a. In this study, the association between aspects of food consumption and diabetes c Ministério da Saúde (BR),
Secretaria de Vigilância em Saúde, Departamento de Doenças e Agravos não Transmissíveis e Promoção da Saúde. Vigitel Brasil 2014: vigilância de fatores de risco e proteção para doenças crônicas por inquérito telefônico. Brasília (DF): Ministério da Saúde; 2015 [cited 2015 Jan 9]. Available from: http://bvsms.saude.gov.br/bvs/ publicacoes/vigitel_brasil_2014.pdf
d Ministério da Saúde (BR),
Secretaria de Atenção à Saúde, Departamento de Atenção Básica. Estratégias para o cuidado da pessoa com doença crônica: diabetes mellitus. Brasília (DF): Ministério da Saúde; 2013 [cited 2015 Jan 21]. (Cadernos de Atenção Básica, 36). Available from: http://bvsms. saude.gov.br/bvs/publicacoes/ estrategias_cuidado_pessoa_ diabetes_mellitus_cab36.pdf
e Instituto Brasileiro de Geografia
disappeared after adjustment for age, schooling and sex, suggesting that eating patterns were
diferential according to these characteristics, rather than directly associated with diabetes.
A sedentary lifestyle has been associated with insulin resistance in non-diabetic individuals,
regardless of obesity24. he regular practice of physical activity is important for the treatment
and reduction of diabetes4, as it increases the number of capillaries and muscle ibers, facilitating glucose transport and uptake24. In this study, after the adjustments, the indicator of physical inactivity lost signiicance, a inding possibly explained by reverse causality,
considering encouragement to perform regular physical activity in this population2.
he association between adiposity, especially visceral, and diabetes is well documented4,22.
However, studies also indicate association between diabetes and overall obesity as characterized by high body mass index9. he pathophysiological mechanisms that result in the association between obesity and diabetes are complex and multifactorial. Among them is the iniltration of fat in the liver, interfering in the hepatic metabolism and increasing insulin resistance. In the pancreas,
excess of circulating fats and glucose results in increased demand for insulin secretion, leading to stress and eventual exhaustion of the β-cells, insulin producers, which worsens the situation4. he association of diabetes and obesity suggests a lifestyle among Brazilian adults that is now
common in urbanized western societies, since the excess of weight reaches more of the half
of the Brazilian adult population, and obesity about 17.4%25. he study identiied a gradient of association with increasing adiposity, the PR being about twice that of normoweight
individuals among overweight people and three times among obese people.
Tobacco is known to be a strong risk factor for cardiovascular diseasesa. he amount and
duration of smoking correlate directly with the progression of diabetes and cardiovascular complications, and smoking cessation is a fundamental and priority measure in secondary
prevention4,26. In this study, we found an association between diabetes and ex-smokers. his could be explained in two ways: irst, people with the diagnosis of diabetes stop smoking due to the illness; second, the smoking would increase the risk of developing diabetes, but the disease would manifest especially after the weight gain associated with the smoking cessation27.
he association between abusive consumption of alcohol and diabetes can occur by the direct
action of alcohol8 or confounding by other unhealthy living habits present in individuals with high alcohol intake. In this study, individuals who reported diabetes, especially men, were the ones that most reported abusive consumption of alcoholic beverages. hus, the health
team should consider this factor in the strategies of glycemic control of these patients.
Hypertension is recognized as an important risk factor for diabetes and may contribute
to both micro and macrovascular lesions4. he question concerning hyperlipidemia in the
PNS refers to high cholesterol or triglycerides, without distinction between both or among
the fractions of cholesterol. High total cholesterol and LDL cholesterol are not generally considered diabetes risk factors, while low levels of HDL-C and high triglyceride are9. he
association with high cholesterol or triglycerides shown here can represent reverse causality, arising from the fact that the investigation of dyslipidemia is more frequent in carriers of
other risk factors for cardiovascular disease, such as diabetes.
he occurrence of chronic diseases in general has been related to the assessment of a
“poor” state of healthb,e. his is a qualitative and synthetic health indicator, but with a good
ability to predict more serious outcomes7. A previous Brazilian study7 indicated diabetes
prevalence up to four times higher in adults with a self-perception of poor health, results
very close to the ones found in this study. his relation can be associated with both the
Due to high morbidity, diabetes goes along with reduced quality of life and incapacities, and
it is estimated that the disease results in 89 million quality-adjusted years of life lost in the
world.Morbidity results predominantly from macrovascular complications – ischemic heart
disease, cerebrovascular accident and peripheral artery disease – and microvascular ones, including retinopathy, nephropathy, and neuropathy, which can lead to vision loss, kidney
failure and chronic pain, respectively28-30.
Cardiovascular disease is the leading cause of morbidity and mortality in diabetic patients31,32.
he prevention of these diseases involves, among other things, the treatment of other cardiometabolic risk factors associated with diabetes, such as hypertension, dyslipidemia, obesity, smoking, and sedentariness2,4.
Some characteristic limitations of cross-sectional studies can be highlighted in relation to
this study’s results. he reverse causality bias, caused by simultaneous measurements of risk or protection factors and of outcomes, limited inferences about the directionality of causality. he use of self-reported morbidity data depends on the access to health services
for the diagnosis; thus, users who more often use these services have a higher opportunity for medical diagnosis of diabetes.
Despite the limitations of cross-sectional studies, the results of the PNS detailed in this study, allow the establishment of a set of factors associated with diabetes, contributing
to the rational construction of public policies for prevention and health promotion. After
adjustment by age, schooling and sex, diabetes was shown to be associated with increasing age, lower schooling, overweight and obesity, and hypertension, indicating a pattern of
common risk factors to the occurrence of other chronic diseases in the adult Brazilian population. he close association between diabetes and assessment of the state of health as poor shows the importance of diabetes in the quality of life of Brazilian adults and older adults. his aspect, in addition to the forecast of an increase in the prevalence of the disease
in the medium term, is worrying.
he information of PNS, by being representative of the Brazilian population, will be useful to
support the formulation of public policies in the areas of promotion, vigilance and attention
to health of the Brazilian Uniied Health System (SUS), aligned with the Strategic Action Plan to Combat Non-Communicable Diseases, in Brazil, in the period 2011-2022f and the Global
Plan to Combat Chronic Non-Communicable Diseases of the WHO in 2013g, setting targets
to reduce the burden of these diseasesa.
With the rapid aging of the Brazilian population, we reinforce the importance of early
intervention to prevent and control diabetes, along with the investment in health promotion programs, such as interventions for healthy eating, restriction of tobacco and alcohol consumption, and physical activity practice programs, which will help to reduce overweight
and obesity and other risk factors common to chronic non-communicable diseases in general.
REFERENCES
1. Schmidt MI, Duncan BB, Hoffmann JF, Moura L, Malta DC, Carvalho RMSV. Prevalence of diabetes and hypertension based on self-reported morbidity survey, Brazil, 2006. Rev Saude Publica. 2009;43 Suppl 2:74-82. https://doi.org/10.1590/S0034-89102009000900010.
2. American Diabetes Association. Standards of Medical Care in Diabetes – 2015. Diabetes Care. 2015;38 Suppl 1:S1-93. https://doi.org/10.2337/dc15-S001.
3. Nathan DM, Davidson MB, DeFronzo RA, Heine RJ, Henry RR, Pratley R, et al. Impaired fasting glucose and impaired glucose tolerance: implications for care. Diabetes Care. 2007;30(3):753-9. https://doi.org/10.2337/dc07-9920.
4. Oliveira JEP, Vencio S, organizadores. Diretrizes da Sociedade Brasileira de Diabetes, 2013-2014. São Paulo: Sociedade Brasileira de Diabetes; 2014 [cited 2015 Jan 28].
Available from: http://www.sgc.goias.gov.br/upload/arquivos/2014-05/diretrizes-sbd-2014.pdf
f Ministério da Saúde (BR),
Secretaria de Vigilância em Saúde, Departamento de Análise de Situação de Saúde. Plano de ações estratégicas para o enfrentamento das doenças crônicas não transmissíveis (DCNT) no Brasil 2011-2022. Brasília (DF): Ministério da Saúde; 2011 [cited 2012 Jan 11]. (Série B. Textos Básicos de Saúde). Available from: http:// bvsms.saude.gov.br/bvs/ publicacoes/plano_acoes_ enfrent_dcnt_2011.pdf
g World Health Organization.
5. Zhang P, Zhang X, Brown J, Vistisen D, Sicree R, Shaw J, et al. Global healthcare
expenditure on diabetes for 2010 and 2030. Diabetes Res Clin Pract. 2010;87(3):293-301. https://doi.org/10.1016/j.diabres.2010.01.026.
6. Bahia LR, Araujo DV, Schaan BD, Dib SA, Negrato CA, Leão MPS, et al. The costs of type 2 diabetes mellitus outpatient care in the Brazilian public health system. Value Health. 2011;14(5 Suppl 1):S137-40. https://doi.org/10.1016/j.jval.2011.05.009.
7. Barros MBA, Zanchetta LM, Moura EC, Malta DC. Self-rated health and associated factors, Brazil, 2006. Rev Saude Publica. 2009;43 Suppl 2:27-37. https://doi.org/10.1590/S0034-89102009000900005.
8. Kim JY, Lee DY, Lee YJ, Park KJ, Kim KH, Kim JW, et al. Chronic alcohol consumption potentiates the development of diabetes through pancreatic β-cell dysfunction. World J Biol Chem.
2015;6(1):1-15. https://doi.org/10.4331/wjbc.v6.i1.1.
9. Passos VMA, Barreto SM, Diniz LM, Lima-Costa MF. Type 2 diabetes: prevalence and associated factors in a Brazilian community – the Bambui health and aging study. Sao Paulo Med J. 2005;123(2):66-71. https://doi.org/10.1590/S1516-31802005000200007.
10. Danaei G, Finucane MM, Lu Y, Singh GM, Cowan MJ, Paciorek CJ, et al. National, regional, and global trends in fasting plasma glucose and diabetes prevalence since 1980: systematic analysis of health examination surveys and epidemiological studies with 370 country-years and 2.7 million participants. Lancet. 2011;378(9785):31-40. https://doi.org/10.1016/S0140-6736(11)60679-X.
11. Finucane MM, Stevens GA, Cowan MJ, Danaei G, Lin JK, Paciorek CJ, et al. National, regional, and global trends in body-mass index since 1980: systematic analysis of health examination surveys and epidemiological studies with 960 country-years and 9.1 million participants. Lancet. 2011;377(9765):557-67. https://doi.org/10.1016/S0140-6736(10)62037-5.
12. Ardisson Korat AV, Willett WC, Hu FB. Diet, lifestyle, and genetic risk factors for type 2 diabetes: a review from the Nurses’ Health Study, Nurses’ Health Study 2, and Health Professionals’ Follow-up Study. Curr Nutr Rep. 2014;3(4):345-54. https://doi.org/10.1007/s13668-014-0103-5.
13. Freitas LRS, Garcia LP. Evolução da prevalência do diabetes e deste associado à hipertensão arterial no Brasil: análise da Pesquisa Nacional por Amostra de Domicílios, 1998, 2003 e 2008.
Epidemiol Serv Saude. 2012;21(1):7-19. https://doi.org/10.5123/S1679-49742012000100002.
14. Iser BPM, Malta DC, Duncan BB, Moura L, Vigo A, Schmidt MI. Prevalence, correlates, and description of self-reported diabetes in Brazilian capitals: results from a telephone survey.
PLoS One. 2014;9(9):e108044. https://doi.org/10.1371/journal.pone.0108044.
15. Malerbi DA, Franco LJ. Multicenter study of the prevalence of diabetes mellitus and impaired glucose tolerance in the urban Brazilian population aged 30-69 yr. The Brazilian Cooperative Group on the Study of Diabetes Prevalence. Diabetes Care. 1992;15(11):1509-16.
16. Schmidt MI, Hoffmann JF, Diniz MFS, Lotufo PA, Griep RH, Bensenor IM, et al. High prevalence of diabetes and intermediate hyperglycemia – The Brazilian Longitudinal Study of Adult Health (ELSA-Brasil). Diabetol Metab Syndr. 2014;6(1):123. https://doi.org/10.1186/1758-5996-6-123.
17. American Diabetes Association. Economic costs of diabetes in the U.S. in 2012. Diabetes Care. 2013;36(4):1033-46. https://doi.org/10.2337/dc12-2625.
18. Goran MI, Davis J, Kelly L, Shaibi G, Spruijt-Metz D, Monica Soni S, et al. Low prevalence of pediatric type 2 diabetes: where’s the epidemic? J Pediatr. 2008;152(6):753-5.
https://doi.org/10.1016/j.jpeds.2008.02.004.
19. Moraes ACF, Fulaz CS, Netto-Oliveira ER, Reichert FF. Prevalência de síndrome metabólica em adolescentes: uma revisão sistemática. Cad Saude Publica. 2009;25(6):1195-202. https://doi.org/10.1590/S0102-311X2009000600002.
20. Vidigal FC, Bressan J, Babio N, Salas-Salvadó J. Prevalence of metabolic syndrome in Brazilian adults: a systematic review. BMC Public Health. 2013;13(1):1198. https://doi.org/10.1186/1471-2458-13-1198.
21. Maty SC, Everson-Rose SA, Haan MN, Raghunathan TE, Kaplan GA. Education, income, occupation, and the 34-year incidence (1965–99) of Type 2 diabetes in the Alameda County Study. Int J Epidemiol. 2005;34(6):1274-81. https://doi.org/10.1093/ije/dyi167.
23. Malta DC, Moura L, Bernal RTI. Differentials in risk factors for chronic non-communicable diseases from the race/color standpoint. Cienc Saude Coletiva. 2015;20(3):713-25. https://doi.org/10.1590/1413-81232015203.16182014.
24. Mayer-Davis EJ, D’Agostino R Jr, Karter AJ, Haffner SM, Rewers MJ, Saad M, et al. Intensity and amount of physical activity in relation to insulin sensitivity: the Insulin Resistance Atherosclerosis Study. JAMA. 1998;4;279(9):669-74. https://doi.org/10.1001/jama.279.9.669.
25. Malta DC, Bernal RTI, Nunes ML, Oliveira MM, Iser BPM, Andrade SSCA, et al. Prevalência de fatores de risco e proteção para doenças crônicas não transmissíveis em adultos: estudo transversal, Brasil 2012. Epidemiol Serv Saude. 2014;23(4):609-22. https://doi.org/10.5123/S1679-49742014000400003.
26. Critchley JA, Capewell S. Mortality risk reduction associated with smoking cessation in patients with coronary heart disease: a systematic review. JAMA. 2003;290(1):86-97. https://doi.org/10.1001/jama.290.1.86.
27. Yeh HC, Duncan BB, Schmidt MI, Wang NY, Brancati FL. Smoking, smoking cessation, and risk for type 2 diabetes mellitus: a cohort study. Ann Intern Med. 2010;152(1):10-7. https://doi.org/10.7326/0003-4819-152-1-201001050-00005
28. Gorter PM, Visseren FLJ, Algra A, Van der Graaf Y. The impact of site and extent of clinically evident cardiovascular disease and atherosclerotic burden on new cardiovascular events in patients with Type 2 diabetes. The SMART Study. Diabet Med. 2007;24(12):1352-60. https://doi.org/10.1111/j.1464-5491.2007.02323.x.
29. Hu G, Jousilahti P, Tuomilehto J. Joint effects of history of hypertension at baseline and type 2 diabetes at baseline and during follow-up on the risk of coronary heart disease. Eur Heart J. 2007;28(24):3059-66. https://doi.org/10.1093/eurheartj/ehm501.
30. Nagpal J, Bhartia A. Cardiovascular risk profile of subjects with known diabetes from the middle- and high-income group population of Delhi: the DEDICOM survey. Diabet Med. 2008;25(1):27-36. https://doi.org/10.1111/j.1464-5491.2007.02307.x.
31. Klafke A, Duncan BB, Rosa RS, Moura L, Malta DC, Schmidt MI. Mortalidade por complicações agudas do diabetes melito no Brasil, 2006-2010. Epidemiol Serv Saude. 2014;23(3):455-62. https://doi.org/10.5123/S1679-49742014000300008.
32. Rosa R, Nita ME, Rached R, Donato B, Rahal E. Estimated hospitalizations attributable to Diabetes Mellitus within the public healthcare system in Brazil from 2008 to 2010: study DIAPS 79. Rev Assoc Med Bras. 2014;60(3):222-30. https://doi.org/10.1590/1806-9282.60.03.010.
Funding: Conselho Nacional de Desenvolvimento Cientíico e Tecnológico (CNPq – 307865/2014-2 PQ2014 – scholarship of productivity to DCM).
Authors’ Contribution: Conception of the study, literature review, data analysis and interpretation, elaboration of
the irst version of the article, critical review of the text: DCM. Statistical analysis, data analysis and interpretation, critical review of the text: RTIB. Literature review, data analysis, critical review of the text: BPMI, BBD, MIS. Conception of the study, critical review of the manuscript: CLS. All authors approved the inal version and take
public responsibility for the article’s content.