DOI: http://dx.doi.org/10.5007/1980-0037.2015v17n2p156
original article
Licence Creative Commom
CC
RBCDH
1 Universidade Estadual do Oeste do Paraná. Curso de Educação Física – Bacharelado. Marechal Cândido Rondon, PR. Brasil.
2 Universidade Estadual de Campi-nas. Faculdade de Educação Física. Programa de Pós-Graduação em Educação Física. Campinas, SP. Brasil.
Received: 01 April 2014 Accepted: 21 September 2014
Prevalence of overweight and obesity
in schoolchildren: relationship with
socioeconomic status, gender and age
Prevalência de sobrepeso e obesidade em estudantes:
relações com nível socioeconômico, sexo e idade
Edilson Hobold1;2 Miguel de Arruda2
Abstract – Overweight and obesity in childhood and adolescence have reached alarming rates in Brazil.he aim of this study was to analyze the prevalence rates of overweight and obesity according to socioeconomic status, gender and age in schoolchildren from 11 towns around the Itaipu Lake, western Paraná. he sample consisted of 5,962 subjects (3,024 girls) aged 6 to 17 years. Overweight and obesity were identiied based on body mass index, adopting the cut-of values for age and gender suggested by the International Obesity Task Force. he prevalence rates according to diferent strata (gender, age and socioeconomic status) were compared by means of logistic regression using odds ratios. he prevalence of overweight and obesity was 14.8% and 5.8% among boys, respectively, and 15.2% and 4.5% among girls. he prevalence rates decreased with increasing age. Considering socioeconomic status, the prevalence of overweight and obesity was signii-cantly higher in schoolchildren from high-income families. he prevalence rates indicate a trend similar to that observed for the highest prevalence reported in surveys conducted in other cities and regions of Brazil. he present results suggest the need for interventions of the public health system and of society, seeking alternatives to alleviate this problem and its consequences.
Key words: Body mass index; Obesity; Overweight; Prevalence; Schoolchildren.
Excess body weight has long ceased to be merely a matter of esthetics. Studies highlight the damage to human health caused by this condition, such as the development of diabetes, cardiovascular diseases, hypertension, osteoarthritis and some types of cancer, among other chronic-degenerative disorders1-3, as well as low self-esteem4, musculoskeletal pain, fractures,
and mobility diiculties5.
In Brazil, there has been a constant increase in excess body weight, par-ticularly over the last 30 years. In 1975, the National Survey of Household Spending (Estudo Nacional de Despesa Familiar - ENDEF) showed a rate of excess weight of 18.6% in men and of 28.6% in women. he Household Budget Survey (Pesquisa de Orçamentos Familiares - POF) conducted in 2003 indicated a signiicant increase in this prevalence, which reached 41% among men and 39.8% among women. In 2006, the Brazilian Ministry of Health conducted a telephone survey of Risk and Protective Factors for Chronic Diseases (Vigilância de Fatores de Risco e Proteção para Doen-ças Crônicas por Inquérito Telefônico - VIGITEL), which conirmed the growing trends in excess weight in the country. In 2008, the prevalence of excess weight among adults was 43.3%, with a rate of 47.3% in men and of 39.5% in women6.
A similar trend is observed in childhood and adolescence. According to the 1975 ENDEF, the prevalence of excess weight in the age group of 10 to 19 years was 7.5% among girls and 3.9% among boys. he National Survey on Health and Nutrition (Pesquisa Nacional sobre Saúde e Nutrição - PNSN) conducted in 1989 indicated an increase to 13.2 and 8.3%, respec-tively. Ater a period of 14 years, the 2003 POF reported a new increase in the prevalence of excess weight, which was 18% among boys and 15.4% among girls6. his growing trend is a matter of concern considering the
fact that a signiicant proportion of these obese children and adolescents will become obese adults7-9.
In view of the above considerations, it becomes important to know the current extent of this problem and to identify possible indicators associated with these prevalence rates in order to provide substantive information for future intervention programs. herefore, the objective of the present study was to analyze the prevalence of overweight and obesity according to gender, age and socioeconomic status in schoolchildren aged 6 to 17 years from towns around the Itaipu lake, westernmost region of Paraná state.
METHODOLOGICAL PROCEDURES
Overweight and obesity Hobold & Arruda
Ethics Committee of the School of Medical Sciences, State University of Campinas (Universidade Estadual de Campinas) (Protocol 370/2011), and were conducted according to Resolution 196/96 of the National Health Council.
A survey was conducted speciically for this study to determine the total number of schools and schoolchildren in each participating municipality, in collaboration with the State Department of Education and Municipal Secretariats of Education. he population under study comprised 58,003 schoolchildren. he sample size was calculated using a probabilistic sam-pling method and was stratiied by gender and age group as follows: SCC = SN/N and n = SCC x SN, where SCC = sample calculation coeicient, SN = sub-universe, N = universe, and n = calculated sample size. he minimum sample size estimated was 5,243 subjects. Considering losses and refus-als, an arbitrary number of 6,500 schoolchildren were chosen. At the end, 538 subjects were excluded because they met one or more of the following exclusion criteria: age younger than 6 years or older than 17 years; pres-ence of diseases or other conditions; failure to provide the free informed consent form signed by the parent or legal guardian; non-attendance on the day of data collection, and incorrectly answered questionnaires. hus, the inal sample consisted of 5,962 subjects of both genders.
hirty-four schools were randomly selected. he sample of each town was established ater a randomized study considering the proportionality of subjects. he classes were chosen by drawing lots. he chronological age of the subjects was determined as decimal age using the date of birth and date of data collection according to previously established criteria10.
Height and body weight were measured according to international rec-ommendations11. Overweight and obesity were deined based on the body
mass index (BMI) according to World Health Organization criteria1. he
cut-of values suggested by the International Obesity Task Force (IOTF) were adopted12. he prevalence of overweight and obesity was determined
separately for gender, chronological age and socioeconomic status. For the purpose of analysis, three age groups were established: 6 to 10 years, 11 to 14 years and 15 to 17 years, hereinater referred to as age groups I, II and II, respectively.
Socioeconomic status was evaluated using the questionnaire proposed by the Brazilian Association of Research Companies (Associação Brasileira de Empresas de Pesquisa – ABEP)13. Scores were attributed to each item
and the socioeconomic status (SES) was thus deined as A (highest), B, C, D and E (lowest). In the present study, strata A1 and A2, B1 and B2 and C1 and C2 were analyzed together as A, B and C, respectively.
he data were collected by a previously trained team in order to stand-ardize the protocols and to minimize errors during data collection.
he SPSS for Windowsâ 15.0 program was used for creation of the
classiication criteria gender and age. Schefé’s post-hoc test was used to identify speciic diferences. he prevalence of overweight and obesity was established based on the proportions of relative and absolute frequency. he prevalence according to gender, age group and socioeconomic status was determined by logistic regression calculating odds ratios (OR) and 95% conidence intervals.
RESULTS
Table 1 shows the composition of the sample considering age group, gender and socioeconomic status.
Table 1. Composition of the sample studied considering age group, gender and socioeconomic status (n=5,962).
Age group (years)
Socioeconomic status
Boys Girls
A B C D E Total A B C D E Total
6-10 (I) 37 520 469 27 1 1,054 29 464 448 23 0 964
11-14 (II) 48 569 535 30 2 1,184 38 580 650 34 1 1,303
15-17 (III) 37 347 298 18 0 700 14 360 359 24 0 757
Total 122 1,436 1,302 75 3 2,938 81 1,404 1,457 81 1 3,024
Table 2 shows the mean, standard deviation and F statistics of height, body weight and BMI.
Table 2. Height, body weight and body mass index according to age and gender.
Age (years) Height (cm) Body weight (kg) BMI (kg/m
2)
Boys Girls Boys Girls Boys Girls
6 120.6a.b±5.4 119.4a.b±5.3 22.8b±4.2 22.5b±4.4 15.6±2.0 15.7±2.1
7 125.8a.b±5.6 124.0a.b±5.8 25.9b±5.5 25.4b±6.1 16.3±2.5 16.3±2.8
8 131.0b±6.8 130.2b±6.7 25.9±7.1 29.1±7.4 16.6±2.9 17.0±3.1
9 137.2b±6.8 136.3b±7.1 33.7a.b±7.8 31.8a.b±7.0 17.7a±3.1 17.0a.b±3.0
10 141.5b±7.7 142.0b±7.2 37.2b±10.9 36.5b±9.4 18.3±4.0 17.9b±3.4
11 145.8a.b±6.9 147.7a.b±7.5 39.9±10.7 41.0b±10.3 18.6±3.9 18.6±3.7
12 151.3a.b±7.9 153.2a.b±7.2 44.6b±10.6 45.6b±10.8 19.3b±3.7 19.3±3.8
13 158.9a.b±9.4 157.4a±6.3 51.4b±13.2 49.9b±11.6 20.2b±3.9 20.0±4.0
14 164.7a.b±8.7 159.6a±5.6 52.2a.b±12.8 52.8a±10.5 20.2±3.7 20.7±3.8
15 169.7a.b±8.4 161.8a±6.0 59.6a.b±13.7 55.0a±10.6 20.6±3.8 21.0±3.6
16 173.9a±7.3 162.5a±6.8 63.8a.b±13.4 55.7a±9.8 21.3±4.1 21.2±3.7
17 175.3a±7.5 162.1a±6.5 68.5a.b±14.4 57.0a±10.1 22.2±4.1 21.7±3.7
F gender*age 56.770 (p<0.000) 15.332 (p<0.000) 1.311 (p>0.05)
Values are the mean ± standard deviation. BMI: body mass index.
Superscript letters indicate signiicant diferences (p < 0.05): a, between genders; b, between ages.
Overweight and obesity Hobold & Arruda
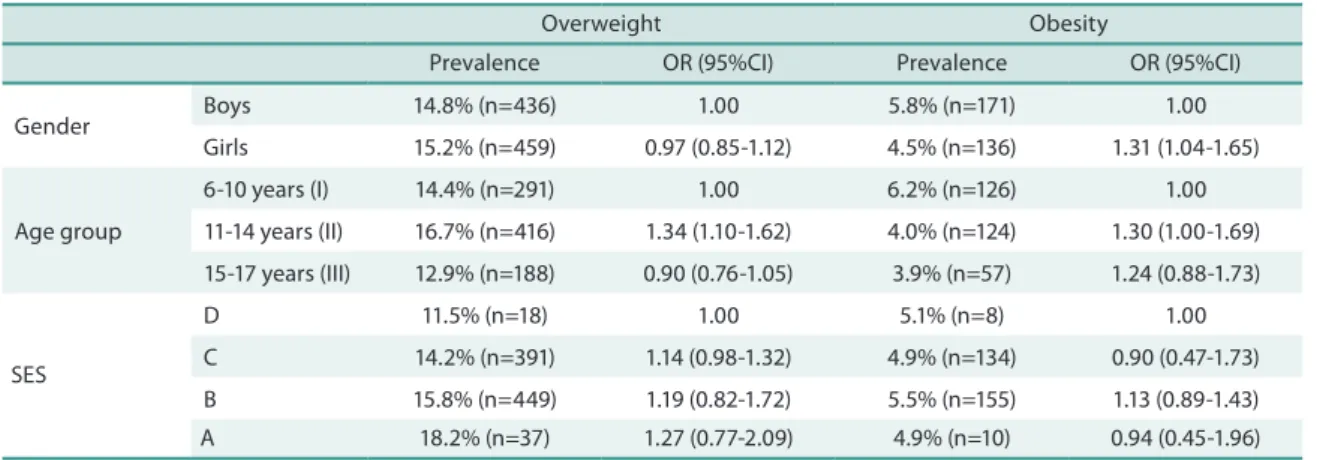
he prevalence of overweight was 14.8% among boys and 15.2% among girls, while the prevalence of obesity was 5.8% and 4.5%, respectively. he results of logistic regression showed that girls were 31% more likely to be obese than boys (OR=1.31; 95%CI=1.04-1.65).
Analysis according to age group showed a higher prevalence of over-weight in age group II. his group had a 34% higher risk of overover-weight than group I (OR=1.34; 95%CI=1.10-1.62). On the other hand, the prevalence of obesity gradually decreased with increasing age. he risk of obesity was 30% higher in group II (OR=1.30; 95%CI=1.00-1.69) and 24% higher in group III (OR=1.24; 95%CI=0.88-1.73).
With respect to socioeconomic status, a progressive increase in the prevalence of overweight was observed, indicating that the higher the socioeconomic status, the higher the prevalence of overweight. he risk of overweight was 27% higher among schoolchildren from high-income fami-lies (SES A) compared to SES D (OR=1.27; 95%CI=0.77-2.09). he prevalence of obesity was higher in SES B and lower in SES D. Furthermore, SES B was associated with a 13% higher risk of obesity (OR=1.13; 95%CI=0.89-1.43).
Considering the possible existence of diferences between genders, the variables were analyzed separately (Table 4). With respect to age group, similar prevalence rates were observed in the two genders. he highest prevalence rates were identiied in age group II and the lowest in group III. Diferences in the risk of overweight were observed between genders. In boys, group II had a 51% higher risk (OR=1.51; 95%CI=1.14-1.99), while the risk was signiicantly lower, only 19%, in girls (OR=1.19; 95%CI=1.10-1.62). he prevalence of obesity decreased with increasing age in both genders. he highest risk of obesity (42%) was identiied in girls of group II (OR=1.42; 95%CI=0.96-2.11).
In schoolchildren belonging to families of higher socioeconomic status, overweight tended to increase gradually and this trend was similar in the two genders. SES A was associated with a 48% higher risk of overweight in boys (OR=1.48; 95%CI=0.69-3.27) and with a 16% higher risk in girls (OR=1.16; 95%CI=0.64-2.09) when compared to SES D.
Table 3. Prevalence and odds ratios with 95% conidence intervals of overweight and obesity according to gender, age group and socioeconomic status.
Overweight Obesity
Prevalence OR (95%CI) Prevalence OR (95%CI)
Gender Boys 14.8% (n=436) 1.00 5.8% (n=171) 1.00
Girls 15.2% (n=459) 0.97 (0.85-1.12) 4.5% (n=136) 1.31 (1.04-1.65)
Age group
6-10 years (I) 14.4% (n=291) 1.00 6.2% (n=126) 1.00
11-14 years (II) 16.7% (n=416) 1.34 (1.10-1.62) 4.0% (n=124) 1.30 (1.00-1.69)
15-17 years (III) 12.9% (n=188) 0.90 (0.76-1.05) 3.9% (n=57) 1.24 (0.88-1.73)
SES
D 11.5% (n=18) 1.00 5.1% (n=8) 1.00
C 14.2% (n=391) 1.14 (0.98-1.32) 4.9% (n=134) 0.90 (0.47-1.73)
B 15.8% (n=449) 1.19 (0.82-1.72) 5.5% (n=155) 1.13 (0.89-1.43)
A 18.2% (n=37) 1.27 (0.77-2.09) 4.9% (n=10) 0.94 (0.45-1.96)
he highest prevalence observed was 8.2% in boys of SES A and 5.2% in girls of SES B. he results of logistic regression showed that, in boys, SES A was associated with a 47% increase in the risk of obesity compared to SES D (OR=1.47; 95%CI=0.74-2.92). In girls, the highest risk (28%) of obesity was observed in SES B (OR=1.28; 95%CI=0.90-1.81).
DISCUSSION
An expressive number of studies have been conducted in Brazil over the last decade in an attempt to identify the prevalence of obesity in children and adolescents, but these studies have used diferent criteria for the iden-tiication and classiication of obesity, a fact showing the lack of consensus and impairing large comparisons. However, we found epidemiological studies conducted in Brazil that used similar criteria: age, BMI and IOTF. Prevalence rates of overweight14-17 and obesity14,15,17-19 similar to those
ob-served here have been identiied in at least one of the genders. When the prevalence estimates of overweight and obesity were summed to determine the total prevalence of excess weight, some studies14,15,17,19 reported values
exceeding 20%, as observed in the present study.
Corso et al.20 studied schoolchildren from eight towns in Santa
Cata-rina. he age of these children corresponded to age group I. he prevalence rates of overweight (15.4%) and obesity (6.1%) were similar to those observed in the present study (14.4% and 6.2%, respectively). For age group II, two studies conducted in Pelotas21 and Capão da Canoa22, Rio Grande do Sul,
reported a prevalence of excess weight of 24.8%, while a slightly lower rate
Overweight Obesity
Prevalence OR (95%CI) Prevalence OR (95%CI)
Boys
Age group
6-10 years (I) 14.1% (n=149) 1.00 6.3% (n=66) 1.00
11-14 years (II) 16.9% (n=200) 1.51 (1.14-1.99) 6.1% (n=72) 0.98 (0.67-1.47)
15-17 years (III) 12.4% (n=87) 0.77 (0.77-0.97) 4.7% (n=33) 0.89 (0.54-1.07)
SES
D 9.3% (n=7) 1.00 6.7% (n=5) 1.00
C 13.2% (n=17(3)) 1.19 (0.74-1.92) 5.7% (n=74) 0.84 (0.33-2.15)
B 16.3% (n=234) 1.28 (1.03-1.58) 6.8% (n=82) 1.01 (0.73-1.39)
A 18.9% (n=23) 1.48 (0.69-3.27) 8.2% (n=10) 1.47 (0.74-2.92)
Girls
Age group
6-10 years (I) 14.7% (n=142) 1.00 6.2% (n=60) 1.00
11-14 years (II) 16.6% (n=216) 1.19 (1.10-1.62) 4.0% (n=52) 1.42 (0.96-2.11)
15-17 years (III) 13.3% (n=101) 0.94 (0.83-1.30) 3.2% (n=24) 1.29 (0.77-2.15)
SES
D 13.6% (n=11) 1.00 3.7% (n=3) 1.00
C 15.0% (n=219) 1.03 (0.59-2.16) 4.1% (n=60) 1.06 (1.04-1.07)
B 15.3% (n=215) 1.07 (0.83-1.25) 5.2% (n=73) 1.28 (0.90-1.81)
A 17.3% (n=14) 1.16 (0.64-2.09) 0.0% (n=0)
Overweight and obesity Hobold & Arruda
(20.7%) was observed in the present study, with the highest values in boys. A lower prevalence of excess weight was observed in age group III (16.8%). A similar trend has been reported in other studies23-25.
In the present study, the prevalence of overweight and obesity followed a similar trend in the two genders, decreasing gradually with increasing age. his trend has also been reported in another study16.
With respect to the risk of obesity, girls showed a greater predisposition, especially in age group II. In boys, a higher risk of overweight was also iden-tiied in age group II. Similar results have been reported by Guedes et al.19.
Schoolchildren of both genders from high-income families were more predisposed to develop overweight. No pattern was observed for the prevalence of obesity, which was similar in SES D and B in boys and the highest prevalence of this study (8.2%) was observed in SES A. In girls, the prevalence of obesity was higher in SES D, C and B, and no case of obesity was observed in SES A.
A markedly higher risk of both overweight and obesity (close to 50%) was observed in boys of SES A. Similar trends, but at lower percentages, were seen in girls. hese values obtained by logistic regression were con-siderably lower than those reported in another study19 conducted in 2006,
with the identiication of situations of double and even triple the risk of developing overweight and obesity.
he results of the present study suggest the need for intervention pro-grams designed to combat the constant increase in overweight and obesity in Brazil, which requires the joint efort of families, schools, society, and public authorities. Physical education professionals play a key role in this process, especially those working in schools since they have the opportunity to help change this reality.
One limitation of this study is the lack of detailed information about the eating habits and physical activity of the schoolchildren, which would permit a more thorough discussion of this subject.
CONCLUSIONS
he present study shows that overweight and obesity in children and adoles-cents have reached considerably high rates in the towns located around the Itaipu lake, irrespective of gender and age. Considering the socioeconomic status, higher prevalence rates of overweight and obesity were observed in schoolchildren from high-income families. he prevalence rates indicate a trend similar to that observed for the highest prevalence reported in surveys conducted in other cities and regions of Brazil. It is expected that these data become a matter of concern for the public health system and society, seeking alternatives to alleviate this problem and its future consequences.
REFERENCES
and obesity in adults: the evidence report. Obes Res1998;6(Suppl 2):S51-209. 3. Must A, Jacques PF, Dallal GE, Bajema CJ, Dietz WH. Long-term morbidity and
mortality of overweight adolescents. A follow-up of the Harvard Growth Study from 1922 to 1935. N Engl J Med 1992;327(19):1350-5.
4. Kiess W, Galler A, Reich A, Muller G, Kapellen T, Deutscher J, et al. Clinical aspects of obesity in children and adolescence. Obes Rev 2001;2:29-36.
5. Taylor ED, heim KR, Mirch MC, Ghorbani S, Tanofsky-Kraf M, Adler-Wailes DC, et al. Orthopedic complications of overweight in children and adolescents. Pediatrics 2006;117(6):2167-74.
6. Rodrigues LG, Pombo N, Koifman S. Prevalência de alterações metabólicas em
crianças e adolescentes com sobrepeso e obesidade: uma revisão sistemática. Rev Paul Pediatr 2011;29(2):277-88.
7. Guo SS, Roche AF, Chumlea WC, Gardner JD, Siervogel RM. he predictive value of childhood body mass index values for overweight at age 35 years. Am J Clin Nutr 1994;59:810-9.
8. Troiano RP, Flegal KM, Kukzmarski RJ, Campbell SM, Johnson CL. Overweight prevalence and trends for children and adolescents. he National and Nutrition Ex-amination Surveys, 1963 to 1991. Arch Pediatric Adolesc Med 1995;149(10):1085-91. 9. Freedman DS, Mei Z, Srinivasan SR, Berenson GS, Dietz WH. Cardiovascular
risk factors and excess adiposity among overweight children and adolescents: he Bogalusa Heart Study. J Pediatr 2007;150(1):12-17.
10. Ross WD, Marfell-Jones MJ. Kinanthropometry. In: MacDougall JD, Wenger HA, Green HJ, editors. Physiological testing of the high performance athlete. (2nd ed.). Champaign, Illinois: Human Kinetics;1991. p.223.
11. Gordon CC, Chumlea WC, Roche AF. Stature, recumbent length and weight. In Lohman TG, Roche AF, Matorell R, editors. Anthropometric standardization reference manual. Champaign, Illinois: Human Kinetics. 1991.p.3-8.
12. Cole TJ, Bellizzi MC, Flegal KM, Dietz WH. Establishing a standard deini-tion for child overweight and obesity worldwide: internadeini-tional survey. Br Med J 2000;320(7244):1240-3.
13. Associação Brasileira de Empresas de Pesquisa – ABEP. Critério de classiicação econômica do Brasil. 2011. Available from: <http://www.abep.org/novo/Content. aspx?ContentID=301>[ 2011 Mar 22].
14. Abrantes MM, Lamounier JA, Colosimo EA. Prevalência de sobrepeso e obesidade nas regiões nordeste e sudeste do Brasil. Rev Assoc Med Bras. 2003;49(2):162-6. 15. Freitas-Júnior IF, Balikian-Júnior P, Miyashita LK, Neiva CM, Isidorio SCA.
Cresci-mento e estado nutricional de crianças e adolescentes de Presidente Prudente, São Paulo, Brasil. Rev Bras Saúde Matern Infant 2008;8(3):265-74.
16. Guedes DP, Mendes RR. Crescimento físico e estado nutricional de escolares do Vale do Jequitinhonha, Minas Gerais, Brasil. Rev Bras Cineantropom Desempenho Hum 2012;14(4):363-76.
17. Guedes DP, Miranda-Neto JT, Almeida MJ, Silva AJRM. Impacto de fatores so-ciodemográicos e comportamentais na prevalência de sobrepeso e obesidade de escolares. Rev Bras Cineantropom Desempenho Hum 2010;12(4):221-31.
18. Rodrigues PA, Marques MH, Afonso MG, Chaves M, Souza CF, Carvalho MF. Prevalência e fatores associados a sobrepeso e obesidade em escolares da rede pública. Ciên & Saúde Coletiva 2011;16(Suppl 1):S1581-88.
19. Guedes DP, Paula IG, Guedes JERP, Stanganelli LCR. Prevalência de sobrepeso e obesidade em crianças e adolescentes: estimativas relacionadas ao sexo, à idade e a classe socioeconômica. Rev Bras Educ Fís Esp 2006;20(3):151-63.
Overweight and obesity Hobold & Arruda
Corresponding author
Edilson Hobold Rua Sergipe, 2400
CEP 85960-000 - Marechal Cândido Rondon, PR. Brasil
E-mail: [email protected]
21. Vieira MFA, Araújo CLP, Neutzling MB, Hallal PC, Menezes AMB. Diagnosis of overweight and obesity in adolescents from the 1993 Pelotas Birth Cohort Study, Rio Grande do Sul State, Brazil: comparison of two diagnostic criteria. Cad Saúde Pública 2007;23(12):2993-9.
22. Suñé FR, Dida-Costa JS, Olinto MTA, Pattussi MP. Prevalência e fatores as-sociados para sobrepeso e obesidade em escolares de uma cidade no Sul do Brasil. Cad Saúde Pública 2007;23(6):1361-71.
23. Pelegrini A, Petroski EL. Excesso de peso em adolescentes: prevalência e fatores associados. Rev Bras Ativ Fís Saúde 2007;12(3):45-53.
24. Kunkel N, Oliveira WF, Peres MA. Excesso de peso e qualidade de vida relacionada à saúde em adolescentes de Florianópolis, SC. Rev Saúde Pública. 2009;43(2):226-35. 25. Tassitano RM, Barros MVG, Tenório MCM, Bezerra J, Hallal PC. Prevalência e