Diabetes burden in Brazil:
fraction attributable to
overweight, obesity, and
excess weight
Carga de diabetes no Brasil: fração
atribuível ao sobrepeso, obesidade
e excesso de peso
I Programa de Pós-Graduação em Saúde
Pública. Escola Nacional de Saúde Pública Sergio Arouca. Fundação Oswaldo Cruz. Rio de Janeiro, RJ, Brasil
II Departamento de Ciências Sociais. Escola
Nacional de Saúde Pública Sergio Arouca. Fundação Oswaldo Cruz. Rio de Janeiro, RJ, Brasil
III Fundação Cesgranrio. Rio de Janeiro, RJ,
Brasil
IV Departamento de Epidemiologia e Métodos
Quantitativos em Saúde. Escola Nacional de Saúde Pública Sergio Arouca. Fundação Oswaldo Cruz. Rio de Janeiro, RJ, Brasil Correspondence:
Luísa Sorio Flor
Núcleo de Pesquisa em Métodos Aplicados aos Estudos de Carga Global de Doença Av. Brasil, 4036 Sala 904 Manguinhos 21040-361 Rio de Janeiro, RJ, Brasil E-mail: [email protected] Received: 5/12/2014 Approved: 8/7/2014
Article available from: www.scielo.br/rsp
ABSTRACT
OBJECTIVE: To estimate the burden of type 2 diabetes mellitus and its percentage attributable to overweight and obesity in Brazil.
METHODS: The burden of diabetes mellitus was described in terms of disability-adjusted life years, which is the sum of two components: years of life lost and years lived with disability. To calculate the fraction of diabetes mellitus attributable to overweight, obesity, and excess weight, we used the prevalence of these risk factors according to sex and age groups (> 20 years) obtained from the 2008 Pesquisa Dimensões Sociais das Desigualdades (Social Dimensions of Inequality Survey) and the relative risks derived from the international literature.
RESULTS: Diabetes mellitus accounted for 5.4% of Brazilian disability-adjusted life years in 2008, with the largest fraction attributed to the morbidity component (years lived with disability). Women exhibited higher values for disability-adjusted life years. In Brazil, 49.2%, 58.3%, and 70.6% of diabetes mellitus in women was attributable to overweight, obesity, and excess weight, respectively. Among men, these percentages were 40.5%, 45.4%, and 60.3%, respectively. Differences were observed with respect to Brazilian regions and age groups.
CONCLUSIONS:A large fraction of diabetes mellitus was attributable to preventable individual risk factors and, in about six years, the contribution of
these factors signiicant increased, particularly among men. Policies aimed
at promoting healthy lifestyle habits, such as a balanced diet and physical
activity, can have a signiicant impact on reducing the burden of diabetes
mellitus in Brazil.
DESCRIPTORS: Diabetes Mellitus, epidemiology. Attributable Risk. Overweight. Obesity. Disability-Adjusted Life Years. Sickness
Impact Proile.
Luísa Sorio FlorI
Monica Rodrigues CamposII
Andreia Ferreira de OliveiraIII
The epidemiological, nutritional, and demographic transitions observed in recent decades have resulted in increased morbidity and mortality from chronic non-communicable diseases (NCD).19,20 Global
data show that in 1990, NCD accounted for 43.0% of disability-adjusted life years (DALY), with this percentage increasing to 54.0% in 2010.16 Worldwide,
NCD and DALY are considered the leading causes of death, accounting for 68.0% of deaths in 2008.25
In Brazil, NCD have become established as the main disease burden, accounting for 66.0% of DALY in 1998.20 In 2009, they accounted for more than 70.0%
of deaths, particularly affecting the poorest strata of the population.4,19
RESUMO
OBJETIVO:Estimar a carga do diabetes mellitus tipo 2 e sua fração atribuível ao sobrepeso e obesidade no Brasil.
MÉTODOS: A carga de diabetes mellitusfoi descrita por meio dos anos de vida perdidos ajustados por incapacidade, a partir da soma de dois componentes: anos de vida perdidos por morte prematura e anos de vida perdidos devido à incapacidade.
Para o cálculo da fração do diabetes mellitus devida ao sobrepeso, à obesidade e ao
excesso de peso, foram utilizadas as prevalências desses fatores de risco por sexo e
faixa etária (> 20 anos), obtidas na Pesquisa Dimensões Sociais das Desigualdades,
do ano de 2008, e os riscos relativos obtidos na literatura internacional.
RESULTADOS: Diabetes mellitus respondeu por 5,4% dos anos de vida perdidos ajustados por incapacidade em 2008, sendo a maior parcela atribuída ao componente de morbidade (anos de vida perdidos devido à incapacidade). As mulheres apresentaram maiores valores de anos de vida ajustados para incapacidade. No Brasil, 49,2%, 58,3% e 70,6% do diabetes mellitus no sexo feminino foram atribuíveis ao sobrepeso, à obesidade e ao excesso de peso, respectivamente. Entre os homens, esses percentuais foram 40,5%, 45,4% e 60,3%, respectivamente. Diferenças foram observadas no que tange às grandes
regiões brasileiras e às faixas etárias.
CONCLUSÕES: Grande parte da carga do diabetes foi atribuível a fatores de
risco modiicáveis e, em aproximadamente seis anos, a contribuição desses fatores aumentou expressivamente, sobretudo entre os homens. Políticas
voltadas à promoção de hábitos saudáveis de vida, como alimentação balanceada e prática de atividade física, podem ter um impacto signiicativo na redução da
carga de diabetes mellitus no Brasil.
DESCRITORES: Diabetes Mellitus, epidemiologia. Risco Atribuível.
Sobrepeso. Obesidade. Anos de Vida Perdidos por Incapacidade. Peril
de Impacto da Doença.
INTRODUCTION
Among the NCD, type 2 diabetes mellitus (T2DM) assumes a prominent position; it is considered a global epidemic and was among the 10 leading causes of death worldwide in 2011.a Projections indicate that T2DM
will be responsible for an even greater share of the global disease burden by 2030.24
In a disease burden study conducted in Brazil in 1998, T2DM was the leading cause of DALY for both sexes.20
In addition, although the mortality attributable to NCD decreased by 20.0% between 1996 and 2007 in the country, there was a 2.0% increase in mortality resulting from T2DM in the same period.19
In view of this scenario, strategies have been formulated to combat NCD, particularly T2DM; these include those related to modifiable risk factors
a World Health Organization. The top 10 causes of death. Geneva; 2013; updated 2014 [cited 2013 Nov 26]. (Fact Sheet, 310). Available
such as overweight, physical inactivity, smoking, and excessive alcohol consumption.4
Studies show consistent associations between over-weight and a higher prevalence of T2DM.3,22 This
asso-ciation becomes alarming in countries such as Brazil where more than half of the population is overweight.14
Global estimates for the year 2000 showed that 50.0% and 66.0% of T2DM cases in men and women, respec-tively, could be prevented by controlling overweight.b
Given the importance of T2DM and the fact that overweight and obesity are important risk factors for the development of the disease, the present study aimed to estimate the burden of DM and the percentage attrib-utable to overweight and obesity in Brazil.
METHODS
This study of disease burden in Brazil in 2008 evalu-ated approximately 100 diseases, which were
classi-ied into three major groups: infectious and parasitic
diseases, maternal causes, perinatal causes, and
nutri-tional deiciencies (Group I); chronic NCD (Group II);
and external causes (Group III).c
DALY, the indicator used in this study, is a summary measurement that represents the effect of morbidity and mortality on the health status of populations. It is the sum of two components: one related to the years of life lost due to premature death (YLL) and another that represents the years lived with disability (YLD).15
To calculate YLL, mortality data were obtained from Sistema de Informação sobre Mortalidade (SIM – Mortality Information System),d considering the
average for the period 2007-2009 after reassessing the deaths in terms of age, sex, and municipality and reas-signing the garbage codes and causes of death where
signs, symptoms, and conditions were poorly deined.
YLD is calculated with the incident cases, the duration, and the severity of the disability for both uncompli-cated T2DM and sequelae of the disease (retinopathy, blindness, neuropathy, diabetic foot, and amputation).e
Given the lack of incidence parameters for the uncom-plicated cases, prevalence estimates were made for T2DM. The values for these estimates, as well as for remission and mortality, were fed into the Dismod IIf
program in order to calculate the incidence and dura-tion of T2DM by modeling.
The overall prevalence of T2DM was estimated at 7.4% on the basis of Estudo Multicêntrico de Prevalência de Diabetes (Multicenter Study of Diabetes Prevalence),12
a household survey conducted in nine Brazilian state capitals between 1986 and 1988. The relationship between this prevalence of T2DM and the nutritional state of the population, according to the 1989 Pesquisa Nacional sobre Saúde e Nutrição (Brazilian Survey of Health and Nutrition)g and the 2008-2009 Pesquisa
de Orçamentos Familiares (POF – Family Budget Survey), was then determined.h
Zero remission was assumed for cases of T2DM without complications, as well as the weight proposed by Murray & Lopez (weight = 0.023).i After modeling,
the incidences and durations of T2DM up to 19 years of age were eliminated, according to expert consensus. A discount rate of 3.0% was incorporated into the calcu-lations of YLL and YLD.
The population attributable fraction (PAF), besides stating the contribution of a speciic risk factor to the
disease or mortality, indicates the proportion of the outcome that could be avoided if the exposure factor
were eliminated, thereby enabling quantiication of the
effect of a preventive health strategy.2
The load of T2DM attributed to excess weight, obesity, and overweight was calculated in this study on the
basis of PAF following the methodology proposed by Oliveira et al.17 PAF can be expressed as follows:
FPA= i=0
=1-pi (RRi -1)
k
Σ
i=0
pi (RRi -1)
1+
k
Σ
1
i=0 pi (RRi )
k
Σ
b World Health Organization, Department of Health Statistics and Information. Global health risks: mortality and burden of disease
attributable to selected major risks. Geneva; 2009 [cited 2014 Dec 8]. Available from: http://www.who.int/healthinfo/global_burden_disease/ GlobalHealthRisks_report_full.pdf
c Leite IC, Valente JG, Schramm JMA. Relatório final do projeto Carga de Doença do Brasil - 2008. Rio de Janeiro (RJ): Escola Nacional de
Saúde Pública da Fiocruz; 2013.
d Ministério da Saúde. Sistema de Informação sobre Mortalidade. Indicadores de mortalidade. Taxa de mortalidade por diabetes mellitus tipo
2. Brasília (DF): 2007-2009. Available from: http://tabnet.datasus.gov.br
e Costa AF, Schramm JMA, Flor LS. Diário de bordo de Diabetes mellitus tipo 2. Rio de Janeiro (RJ): Escola Nacional de Saúde Pública da
Fiocruz; 2013 [cited 2014 Dec 8]. Available from: http://cargadedoenca.fiocruz.br
f World Health Organization. Health statistics and information systems. Available from: http://www.who.int/healthinfo/global_burden_disease/
tools_software/en/
g Instituto Nacional de Alimentação e Nutrição. Pesquisa Nacional sobre Saúde e Nutrição: Condições Nutricionais da População Brasileira:
adultos e idosos. INAN: Brasília (DF); 1991.
h Instituto Brasileiro de Geografia e Estatística. Pesquisa de Orçamentos Familiares 2008-2009. Antropometria e estado nutricional de crianças,
adolescentes e adultos no Brasil. Rio de Janeiro (RJ); 2010.
i Murray CJL, Lopez AD. Global health statistics: a compendium of incidence, prevalence, and mortality estimates for over 200 conditions.
In this equation, piis the prevalence of the ith category
of risk factor exposure and RRiis its relative risk (RR)
in relation to the exposure category of reference. For
this calculation, we used the prevalence of excess weight, obesity, and overweight according to sex and age groups as well as the RR for developing T2DM because of these exposure factors.
The prevalence data for Brazil and its macro-regions according to sex and age groups were obtained from the 2008 Pesquisa Dimensões Sociais das Desigualdades (PDSD – Survey on Social Dimensions of Inequalities)j (Table 1). The data
from PDSD were collected using a population-based home survey, with stratiied sampling consisting of
1,374 census sectors (primary sampling units) and 8,048 private, permanent households (secondary sampling units) in common or non-special sectors, including slumcommunities in urban and rural areas throughout Brazil.8 In total, 12,423 heads of
house-holds and their spouses over the age of 20 years were interviewed.
In the health domain, responses to questions concerning the prevalence of various diseases, life habits and risk factors, quality of life, and access to health services were collected. Weight and height measurements were also included to assess the nutritional status of adults in Brazil using the body mass index (BMI). BMI values over 25.0 kg/m² were considered “excess weight”, values between 25.0 kg/m² and 29.9 kg/m² were consid-ered “overweight”, and values over 30.0 kg/m² were considered “obese”.
The methodology of Oliveira et al17 was used to
deter-mine RR in order to calculate PAF. The odds ratios (OR) presented by Field et al,5 which assessed the
risks stemming from overweight in middle-aged men and women in the United States, were transformed into RR according to the methodology proposed by Zhang & Yu27 and used by Sichieri et al.21
Because the data from the study by Field et al5 were not
disaggregated by age groups, we used the distribution of RR according to age presented by Yoon et al.26 In this
j Universidade do Estado do Rio de Janeiro. Centro para o Estudo da Riqueza e da Estratificação Social. Pesquisa Dimensões Sociais das
Desigualdades. Rio de Janeiro (RJ); 2010. Available from: http://ceres.iesp.uerj.br/desigualdade
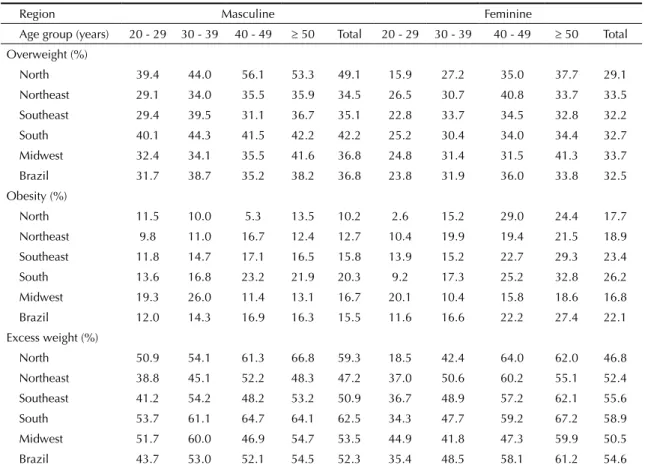
Table 1. Prevalence of overweight, obesity, and excess weight according to sex and age groups in Brazil and its regions. PDSD,* 2008.
Region Masculine Feminine
Age group (years) 20 - 29 30 - 39 40 - 49 ≥ 50 Total 20 - 29 30 - 39 40 - 49 ≥ 50 Total
Overweight (%)
North 39.4 44.0 56.1 53.3 49.1 15.9 27.2 35.0 37.7 29.1
Northeast 29.1 34.0 35.5 35.9 34.5 26.5 30.7 40.8 33.7 33.5
Southeast 29.4 39.5 31.1 36.7 35.1 22.8 33.7 34.5 32.8 32.2
South 40.1 44.3 41.5 42.2 42.2 25.2 30.4 34.0 34.4 32.7
Midwest 32.4 34.1 35.5 41.6 36.8 24.8 31.4 31.5 41.3 33.7
Brazil 31.7 38.7 35.2 38.2 36.8 23.8 31.9 36.0 33.8 32.5
Obesity (%)
North 11.5 10.0 5.3 13.5 10.2 2.6 15.2 29.0 24.4 17.7
Northeast 9.8 11.0 16.7 12.4 12.7 10.4 19.9 19.4 21.5 18.9
Southeast 11.8 14.7 17.1 16.5 15.8 13.9 15.2 22.7 29.3 23.4
South 13.6 16.8 23.2 21.9 20.3 9.2 17.3 25.2 32.8 26.2
Midwest 19.3 26.0 11.4 13.1 16.7 20.1 10.4 15.8 18.6 16.8
Brazil 12.0 14.3 16.9 16.3 15.5 11.6 16.6 22.2 27.4 22.1
Excess weight (%)
North 50.9 54.1 61.3 66.8 59.3 18.5 42.4 64.0 62.0 46.8
Northeast 38.8 45.1 52.2 48.3 47.2 37.0 50.6 60.2 55.1 52.4
Southeast 41.2 54.2 48.2 53.2 50.9 36.7 48.9 57.2 62.1 55.6
South 53.7 61.1 64.7 64.1 62.5 34.3 47.7 59.2 67.2 58.9
Midwest 51.7 60.0 46.9 54.7 53.5 44.9 41.8 47.3 59.9 50.5
Brazil 43.7 53.0 52.1 54.5 52.3 35.4 48.5 58.1 61.2 54.6
study, RR for the development of T2DM was presented separately for overweight and obesity. To estimate RR for excess weight, the prevalence of overweight and obesity
according to age groups given in PDSD were considered.j
Table 2 presents the estimated RR, as well as those found in a 2002-2003 study,17 according to sex and age groups.
Using the age group of 20-29 years as a reference, the weights were obtained from RR in the subse-quent groups using the RR ratios presented by Yoon et al.26 These weights were applied to the 2008
popu-lation data from the Brazilian Institute of Geography and Statistics (IBGE)k to determine the population
exposed to the risk of T2DM according to age groups. The mean risk was obtained by dividing the total population exposed in each BMI category by the total population in 2008 (mean risk of overweight = 0.918; mean risk of obesity = 0.688; mean risk of excess weight = 0.801).
The distribution of RR according to sex was the subject of a study by Sichieri et al.21 The mean estimated risk
and the weight of RR were applied using the rule of three, to the total RR for occurrence of T2DM. The total RR for each variable of exposure was calculated
on the basis of the risks presented according to BMI categories in the study by Sichieri et al.21 In the case of
obesity and excess weight, it was necessary to weigh the RR presented according to the prevalence of these
factors given in PDSD in order to generate an overall
risk for all BMI categories included in the previously described categories of exposure (overweight: line RR = 2.9 and feminine RR = 3.9; obesity: mascu-line RR = 6.6 and feminine RR = 7.6; excess weight: masculine RR = 4.0 and feminine RR = 5.4).
Using the prevalence data from PDSD (Table 1) and
the estimated RR (Table 2), the gross attributable frac-tions were calculated and standardized for Brazil and its macro-regions according to sex, age group, and BMI category. The fractions were standardized for age with the objective of comparison between regions of the country. The standardized prevalence was calculated by applying the crude prevalence according to sex and age groups to the 2008 Brazilian population.
The 2008 study of disease burden was approved by the Research Ethics Committee of the Escola Nacional de Saúde Pública Sérgio Arouca (ENSP-CAAE 0054.0.031.000-11).
k Instituto Brasileiro de Geografia e Estatística. Dados demográficos. Rio de Janeiro (RJ): IBGE; 2008. Available from: http://tabnet.datasus.gov.br
Table 2. Relative risk of developing diabetes mellitus in the presence of overweight, obesity, or excess weight according to sex and age groups. Brazil. 2008.
Age group
(years) RRa
RR Study 2002-2003b Estimated RR 2008 Population
Masculine Feminine Masculine Feminine 2008 Exposed
Overweight
20 - 29 2.2 NA NA 3.2 4.3 35,082,432 35,082,432
30 - 39 2.3 NA NA 3.2 4.3 28,472,896 28,472,896
40 - 49 1.9 NA NA 2.7 3.6 23,894,015 20,267,245
≥ 50 1.8 NA NA 2.6 3.4 35,747,961 28,726,040
Total NA NA NA 2.9 3.9 123,197,304 113,057,058
Obesity
20 - 29 6.7 9.4 10.9 9.7 11.1 35,082,432 35,082,432
30 - 39 4.9 6.9 8.0 7.1 8.1 28,472,896 20,854,588
40 - 49 4.1 5.8 6.6 5.9 6.8 23,894,015 14,607,851
≥ 50 2.7 3.8 4.3 3.9 4.4 35,747,961 14,267,123
Total NA NA NA 6.7 7.7 123,197,304 84,811,994
Excess weight
20 - 29 3.6 4.3 5.9 5.0 6.8 35,082,432 35,082,432
30 - 39 3.1 4.1 5.6 4.3 5.8 28,472,896 24,483,410
40 - 49 2.7 3.5 4.8 3.8 5.1 23,894,015 17,863,946
≥ 50 2.1 2.9 3.9 3.0 4.0 35,747,961 21,276,685
Total NA NA NA 4.0 5.4 123,197,304 98,706,472
NA: Not applicable
a Yoon et al26.
RESULTS
It was observed that in 2008, Brazil had a rate of 195 DALY per 1,000 inhabitants. Group II (NCD) was responsible for approximately 77.0% of the disease burden in the country. T2DM, in turn, accounted for nearly 5.0% of the burden, with a DALY rate of 9.2 per
1,000 inhabitants. Of the T2DM burden, 53.2% was
linked to morbidity, with 930,478 YLD. During this period, 7.4% of deaths were the result of T2DM, with 816,716 YLL.
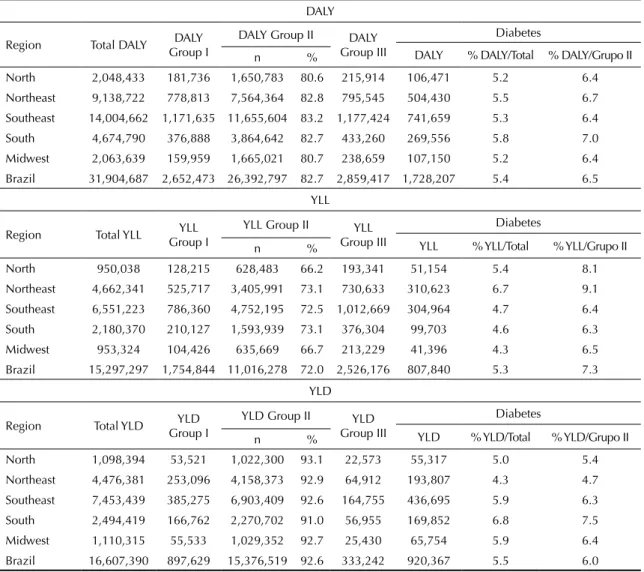
Table 3 presents the DALY, YLL, and YLD for indi-viduals over the age of 20 years according to the groups in the different regions of the country. This age group represented approximately 85.0% of the DALY of all age groups in Brazil in 2008. More than 80.0% of DALY was associated with Group II, ranging from 80.6% in the North region to 83.2% in the Southeast region. Group II’s large share of participation in YLL and YLD was also evident (72.0% and 92.6%, respectively).
Regarding T2DM, more than 5.0% of the total DALY was attributed to this disease. Although in Brazil, the
most signiicant component of the T2DM burden was
YLD (53.2%), with emphasis on the South region, 61.6% of DALY in the Northeast region was the result of YLL (310,623), representing almost 7.0% of the total YLL in this region (Table 3). The percentage of DALY from T2DM in Group II as a whole followed the pattern of the share of T2DM in the total regional distribution of DALY, with greater representativity in the Northeast region for the mortality component.
Table 4 shows the standardized PAF for overweight,
obesity, and excess weight in the major regions of Brazil according to sex. It also presents the results obtained in the 2002-2003 study.17 For Brazil, as well
as the macro-regions, women had higher fractions of
T2DM associated with excess weight and obesity. For overweight, PAF was slightly higher among men in
the North region. Among women, 49.2%, 58.3%, and 70.6% of T2DM cases were attributable to overweight, obesity, and excess weight, respectively; in men, these percentages ranged from 40.5% to 60.3%.
In just over ive years, the percentage of T2DM cases
attributable to the assessed risk factors increased, partic-ularly among men (Table 4). The percentage attribut-able to excess weight increased by 14.2% between 2002-2003 and 2008 for both sexes. The percentage attributable to obesity grew even more: 28.4% for women and 38.8% for men. The greatest growth of
PAF resulting from excess weight occurred in the North
region among men and in the Midwest region among women (25.9% and 15.1%, respectively). With regard to obesity, the Midwest and North regions showed
> 50.0% growth in PAF among men. In women, the
greatest increase (31.8%) occurred in the Midwest region (Table 4).
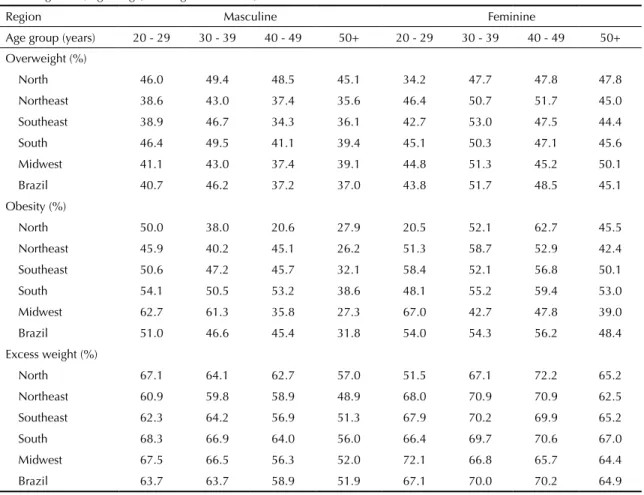
Table 5 presents PAF for Brazil and its macro-regions,
broken down according to sex and age groups. In the
country, for all BMI categories, higher PAF was seen in
men in the initial age ranges (up to 39 years), whereas the largest fractions in women were found in those
aged between 40 and 49 years. Percentages higher than
the national average were found among men in virtu-ally all age groups in the South and Midwest for all of the BMI categories. The share of T2DM attributable
to overweight was also signiicantly higher than the national average in the northern region. For women,
the share of T2DM attributable to obesity exceeded the national average in almost all age groups in the South and Southeast regions. The percentages attributable to excess weight behaved in a similar manner in the Northeast and Southeast.
DISCUSSION
A large fraction of the diabetes burden was
attribut-able to the modiiattribut-able risk factors assessed. In Brazil,
49.2%, 58.3%, and 70.6% of cases of DM in women were attributable to overweight, obesity, and excess weight, respectively. Among men, these percentages were 40.5%, 45.4%, and 60.3%, respectively.
In this study, NCD accounted for most of the disease burden in Brazil in 2008, corroborating previous studies.1,6,16 In Brazil, NCD accounted for 66.3% of the
disease burden in 1998,20 reaching 77.2% in 2008. This
relative percentage of Group II was similar to recent
indings in other Latin American countries6 such as
Mexico (73.0%) and Colombia (74.0%). It was higher
than the percentage in Peru (58.5%) and Costa Rica
(62.0%) and lower than that in Chile (84.0%).
With regard to the burden of T2DM, this disease commonly ranks among the leading causes of DALY. Worldwide, T2DM rose from the 15th to the 9th cause of
DALY between 1990 and 2010.16 In Australia, T2DM
accounted for 5.5% of DALY in 2004,1 occupying the
7th place, similar to the relative percentage found in
this study: 4.7% in all age groups and 5.4% in
indi-viduals aged > 20 years. Despite the methodological
differences in estimating DALY between the 1998 and 2008 studies, the total disease burden related to T2DM remained stable (5.1% in 1998).20 This percentage of
T2DM was higher than that reported in the interna-tional literature.6
Similar to developed countries, the greater fraction of the burden resulting from T2DM in Brazil in 2008 was the result of YLD. However, the Northeast region
and economic development. Despite the increase in the Brazilian human development index in 2013, 61.3% of the municipalities in the Northeast region were
still classiied as having “low human development”.l
This scenario is alarming, because access to health
services in Brazil can be strongly inluenced by the
social condition of individuals and the place where they live.23 This inequality can lead to inadequate
and/or insuficient assistance to patients with T2DM and its sequelae, generating a speciic disease load proile in this region.
With regard to risk factors, high BMI values have led to various adverse health outcomes in different coun-tries. In 2000,7 elevated BMI was responsible for 2.3%
of DALY worldwide and 58.0% of the T2DM burden, whereas in 2004 in Australia,1 these numbers were 7.5%
and 54.7%, respectively. Furthermore, in 2004, 39.0%
of T2DM cases could have been avoided in Canada by reducing exposure to this risk factor.10 In Switzerland,
42.5% of T2DM cases were attributed to obesity in 2002.18 In 2010, excess weight was considered the sixth
most important risk factor for worldwide DALY.16 The
PAF found in this study, however, was greater than that
presented in the international literature.
Among the results described, there was a notable
increase in PAF due to obesity and overweight in Brazil
between 2002-2003 and 2008, indicating that the
impor-tance of other factors in deining the burden of T2DM in
the country has decreased. The role played by elevated
BMI in deining the proile of T2DM has increased in
proportion to the prevalence of physical inactivity and unhealthy diet in Brazil over the years.14
Table 3. Absolute number and percentages of DALY and its components in individuals aged > 20 years according to disease clusters and regions of Brazil, 2008.
DALY
Region Total DALY DALY
Group I
DALY Group II DALY
Group III
Diabetes
DALY % DALY/Total % DALY/Grupo II
n %
North 2,048,433 181,736 1,650,783 80.6 215,914 106,471 5.2 6.4
Northeast 9,138,722 778,813 7,564,364 82.8 795,545 504,430 5.5 6.7
Southeast 14,004,662 1,171,635 11,655,604 83.2 1,177,424 741,659 5.3 6.4
South 4,674,790 376,888 3,864,642 82.7 433,260 269,556 5.8 7.0
Midwest 2,063,639 159,959 1,665,021 80.7 238,659 107,150 5.2 6.4
Brazil 31,904,687 2,652,473 26,392,797 82.7 2,859,417 1,728,207 5.4 6.5
YLL
Region Total YLL YLL
Group I
YLL Group II YLL
Group III
Diabetes
YLL % YLL/Total % YLL/Grupo II
n %
North 950,038 128,215 628,483 66.2 193,341 51,154 5.4 8.1
Northeast 4,662,341 525,717 3,405,991 73.1 730,633 310,623 6.7 9.1
Southeast 6,551,223 786,360 4,752,195 72.5 1,012,669 304,964 4.7 6.4
South 2,180,370 210,127 1,593,939 73.1 376,304 99,703 4.6 6.3
Midwest 953,324 104,426 635,669 66.7 213,229 41,396 4.3 6.5
Brazil 15,297,297 1,754,844 11,016,278 72.0 2,526,176 807,840 5.3 7.3
YLD
Region Total YLD YLD
Group I
YLD Group II YLD
Group III
Diabetes
YLD % YLD/Total % YLD/Grupo II
n %
North 1,098,394 53,521 1,022,300 93.1 22,573 55,317 5.0 5.4
Northeast 4,476,381 253,096 4,158,373 92.9 64,912 193,807 4.3 4.7
Southeast 7,453,439 385,275 6,903,409 92.6 164,755 436,695 5.9 6.3
South 2,494,419 166,762 2,270,702 91.0 56,955 169,852 6.8 7.5
Midwest 1,110,315 55,533 1,029,352 92.7 25,430 65,754 5.9 6.4
Brazil 16,607,390 897,629 15,376,519 92.6 333,242 920,367 5.5 6.0
DALY: disability-adjusted life years; YLL: years of life lost due to premature death; YLD: years lived with disability
Similar to the indings in other countries, women were affected more by greater PAF.1,17 However, between
2002-2003 and 2008, it was men who experienced greater increases in the fractions of T2DM attributable to the evaluated risk factors. In 2006, fat-rich diet and physical inactivity were more prevalent among men in Brazil.14 The POF in 2008 indicated that overweight
had almost tripled among men between 1974 and 2008, from 18.5% to 50.1%, respectively.h
Differentiated changes in the regional proile were also
observed. The more developed South and Southeast regions showed higher percentages of T2DM attribut-able to obesity, whereas in the North region, the increase
in PAF was due to overweight. Such behavior may be
related to a delayed nutritional transition in this region where economic advances have led to more recent exposure to the risk factors for T2DM.
Finally, with regard to age group, the results of this
study agree with those of Sichieri et al;21 obesity is
a recent public health problem in Brazil, and older population groups have not yet been affected by the
chronic consequences of obesity. Furthermore, among
the younger groups, excess weight competes with a smaller number of factors compared with older groups, who are already experiencing the effects of other risk factors related to age. In a country where approximately 12.0% of citizens are obese upon entering adulthood, it is clear that the impact on health conditions will occur at increasingly earlier ages (Table 1).
By aggregating information about mortality and morbidity, DALY provides a foundation for better
understanding of the changes in the T2DM proile in
the context of demographic and epidemiological transi-tion. In addition, presentation by its components (YLL and YLD) according to the major regions of the country
makes it possible to characterize different proiles
of involvement for T2DM and provides support for government actions. Despite differences in the meth-odology used for their construction, the indicators presented here are internationally comparable.
With regard to risk factors, although they may be
poten-tially relevant in deining the epidemiological proile of the
Brazilian population, monitoring is still considered inade-quate in Brazil.13 Thus, this study advances understanding
Table 4. Standardized fractions (%) attributable to overweight, obesity, and excess weight associated with diabetes mellitus according to sex and regions of Brazil in 2002-2003 and 2008.
Region Overweight Obesity Excess weight
Masculine Feminine Masculine Feminine Masculine Feminine
2008 Study
North 47.5 47.3 37.3 55.1 63.6 68.5
Northeast 38.8 50.3 40.7 55.8 57.8 70.4
Southeast 39.3 48.8 45.6 59.5 59.6 70.8
South 44.3 49.1 51.1 60.3 64.5 71.2
Midwest 40.6 50.4 49.9 54.3 61.7 70.0
Brazil 40.5 49.2 45.4 58.3 60.3 70.6
2002-2003 Study*
North NA NA 30.2 42.3 50.5 59.9
Northeast NA NA 27.1 43.2 47.9 61.2
Southeast NA NA 34.9 46.6 54.6 62.0
South NA NA 35.6 48.0 55.1 63.3
Midwest NA NA 32.0 41.2 53.9 60.8
Brazil NA NA 32.7 45.4 52.8 61.8
Difference between 2002-2003 and 2008 (growth %)
North NA NA 7.1 (23.5) 12.8 (30.3) 13.1 (25.9) 8.6 (14.4)
Northeast NA NA 13.6 (50.2) 12.6 (29.2) 9.9 (20.6) 9.2 (15.0)
Southeast NA NA 10.7 (30.7) 12.9 (27.7) 5.0 (9.1) 8.8 (14.2)
South NA NA 15.5 (43.5) 12.3(25.6) 9.4 (17.1) 7.9 (12.5)
Midwest NA NA 17.9 (55.9) 13.1(31.8) 7.8 (14.5) 9.2 (15.1)
Brazil NA NA 12.7 (38.8) 12.9 (28.4) 7.5 (14.2) 8.8 (14.2)
NA: Not applicable
of the relationship between overweight, obesity, excess weight, and T2DM. It provides data that allow compar-ison (within a time span of approximately six years) of the performance of these factors compared with the burden of T2DM in the country.
Limitations related to the complexity of DALY
esti-mates and PAF have already been addressed by some
researchers.9,11 In Brazil, apart from the scarcity of
recent population studies on the prevalence of T2DM, which requires multiple studies to calculate parameters, the data systems are weak in terms of the quality and
quantity of data available. Finally, the weights used
in calculating YLD are standardized worldwide, not
considering the speciics of the different health systems. To calculate PAF, the same methodology as that used
in the 2002-2003 study was used with the aim of
comparing the results. However, this also led to some
of the limitations identiied in a previous publication.17
These limitations are primarily related to the use of parameters from the international literature, although we defend the plausibility of their use.
The results presented here represent important tools for
managing resources and deining priorities in health
interventions at all levels of care. With regard to T2DM,
control of this disease must be guided by modiiable risk factors. Policies aimed at promoting healthy living
habits can reduce the T2DM burden in Brazil. Given the high prevalence of overweight in young people, actions
directed at school children are important. Finally, popu -lation-based actions (not aimed at risk groups) should be prioritized, because the results showed that a signif-icant fraction of the T2DM burden was attributed to moderately high BMI values.
Table 5. Standardized fractions (%) attributable to overweight, obesity, and excess weight associated with diabetes mellitus according to sex, age range, and regions of Brazil, 2008.
Region Masculine Feminine
Age group (years) 20 - 29 30 - 39 40 - 49 50+ 20 - 29 30 - 39 40 - 49 50+
Overweight (%)
North 46.0 49.4 48.5 45.1 34.2 47.7 47.8 47.8
Northeast 38.6 43.0 37.4 35.6 46.4 50.7 51.7 45.0
Southeast 38.9 46.7 34.3 36.1 42.7 53.0 47.5 44.4
South 46.4 49.5 41.1 39.4 45.1 50.3 47.1 45.6
Midwest 41.1 43.0 37.4 39.1 44.8 51.3 45.2 50.1
Brazil 40.7 46.2 37.2 37.0 43.8 51.7 48.5 45.1
Obesity (%)
North 50.0 38.0 20.6 27.9 20.5 52.1 62.7 45.5
Northeast 45.9 40.2 45.1 26.2 51.3 58.7 52.9 42.4
Southeast 50.6 47.2 45.7 32.1 58.4 52.1 56.8 50.1
South 54.1 50.5 53.2 38.6 48.1 55.2 59.4 53.0
Midwest 62.7 61.3 35.8 27.3 67.0 42.7 47.8 39.0
Brazil 51.0 46.6 45.4 31.8 54.0 54.3 56.2 48.4
Excess weight (%)
North 67.1 64.1 62.7 57.0 51.5 67.1 72.2 65.2
Northeast 60.9 59.8 58.9 48.9 68.0 70.9 70.9 62.5
Southeast 62.3 64.2 56.9 51.3 67.9 70.2 69.9 65.2
South 68.3 66.9 64.0 56.0 66.4 69.7 70.6 67.0
Midwest 67.5 66.5 56.3 52.0 72.1 66.8 65.7 64.4
Brazil 63.7 63.7 58.9 51.9 67.1 70.0 70.2 64.9
1. Begg SJ, Vos T, Barker B, Stanley L, Lopez AD. Burden of disease and injury in Australia in the new millennium: measuring health loss from diseases, injuries and risk
factors. Med J Aust. 2008;188(1):36-40.
2. Camey SA, Agranonik M, Radaelli J, Hirakata
VN. Fração atribuível populacional. Rev HCPA.
2010;30(1):77-85.
This article is part of the study “Carga de Doença no Brasil, 2008”, financed by the Brazilian Ministry of Health/Departamento de Ciência e Tecnologia e Insumos Estratégicos (MS/DECIT – Project PRES-004-LIV-10-2-2).
The authors declare no conflict of interest.
3. Cassano PA, Rosner B, Vokonas PS, Weiss ST. Obesity and body fat distribution in relation to the incidence of non-insulin-dependent diabetes mellitus. A prospective
cohort study of men in the normative aging study. Am J
Epidemiol 1992;136:1474-86.
4. Duncan BB, Chor D, Aquino EML, Bensenor IM, Mill JG, Schmidt MI, et al. Doenças crônicas não transmissíveis no Brasil: prioridade para enfrentamento e investigação.
Rev Saude Publica. 2012;46(Supl 1):126-34.
DOI:10.1590/S0034-89102012000700017
5. Field AE, Coakley EH, Must A, Spadaro JL, Laird N, Dietz WH, et al. Impact of overweight on the risk of developing common chronic diseases during a 10-year
period. Arch Intern Med. 2001;161(13):1581-6.
DOI:10.1001/archinte.161.13.1581
6. Gómez Dantés H, Castro MV, Franco-Marina F, Bedregal P, Rodríguez García J, Espinoza A, et al. La carga de la enfermedad en países de América Latina.
Salud Publica Mex. 2011;53(Suppl 2):S72-7.
7. James WPT, Jackson-Leach R, Mhurchu CN, Kalamara E, Shayegui M, Rigby NJ, et al. Overweight and obesity (high body mass index). In: Ezzati M, Lopez AD, Rodgers A, Murray CJL, editors. Comparative quantification of health risks: global and regional burden of disease attribution to selected major risk factors. Geneva: World Health Organization; 2004. v.1, p.497-596.
8. Laguardia J, Campos MR, Travassos CM, Najar AL, Anjos LA, Vasconcellos MM. Psychometric evaluation of the SF-36 (v.2) questionnaire in a probability sample of Brazilian households: results of the survey Pesquisa Dimensões Sociais das Desigualdades (PDSD), Brazil,
2008. Health Qual Life Outcomes. 2011;9(1):61.
DOI:10.1186/1477-7525-9-61
9. Levine B. What does the population attributable
fraction mean? Prev Chronic Dis. 2007;4(1):A14.
10. Luo W, Morrison H, Groh M, Waters C, DesMeules M, Jones-McLean E, et al. The burden of adult obesity in
Canada. Chronic Dis Can. 2007;27(4):135-44.
11. Lyons RA, Kendrick D, Towner EM, Christie N, Macey S, Coupland C, et al. Measuring the population burden of injuries: implications for global and national estimates: a multi-centre prospective UK
longitudinal study. PLoS Med. 2011;8(12):e1001140.
DOI:10.1371/journal.pmed.1001140
12. Malerbi DA, Franco LJ. Multicenter study of the prevalence of diabetes mellitus and impaired glucose tolerance in the urban Brazilian population aged
30-69 yr. Diabetes Care. 1992;15:1509-16.
13. Monteiro CA, Moura EC, Jaime PC, Lucca A, Florindo AA, Figueiredo ICR, et al. Monitoramento de fatores de risco para doenças crônicas por entrevistas
telefônicas. Rev Saude Publica. 2005;39(1):47-57.
DOI:10.1590/S0034-89102005000100007
14. Moura EC, Morais Neto OL, Malta DC, Moura L, Silva NN, Bernal R, et al. Vigilância de fatores de risco para doenças crônicas por inquérito telefônico nas capitais dos 26 estados brasileiros e no Distrito Federal
(2006). Rev Bras Epidemiol. 2008;11(Supl 1):20-37.
DOI:10.1590/S1415-790X2008000500003
15. Murray CJ. Quantifying the burden of disease: the
technical basis for disability-adjusted life years. Bull
World Health Organ. 1994;72(3):429-45.
16. Murray CJL, Vos T, Lozano R, Naghavi M, Flaxman AD, Michaud C, et al. Disability-adjusted life years (DALYs) for 291 diseases and injuries in 21 regions, 1990–2010: a systematic analysis for the Global Burden of Disease Study
2010. Lancet. 2012;380(9859):2197-223.
DOI:10.1016/S0140-6736(12)61689-4
17. Oliveira AF, Valente JG, Leite IC. Fração da carga global do diabetes mellitus atribuível ao excesso de peso e à obesidade no Brasil.
Rev Panam Salud Publica. 2010;27(5):338-44.
DOI:10.1590/S1020-49892010000500003
18. Schmid A, Schneider H, Golay A, Keller U. Economic burden of obesity and its comorbidities in
Switzerland. Soz Präventivmed. 2005;50(2):87-94.
DOI:10.1007/s00038-004-4067-x
19. Schmidt MI, Duncan BB, Azevedo e Silva G, Menezes AM, Monteiro CA, Barreto SM, et al. Chronic non-communicable diseases in Brazil: burden and
current challenges. Lancet. 2011;377(9781):1949-61.
DOI:10.1016/S0140-6736(11)60135-9
20. Schramm JMA, Oliveira AF, Leite IC, Valente JG, Gadelha AMJ, Portela MC, et al. Transição epidemiológica e o estudo de carga de doença no
Brasil. Cienc Saude Coletiva. 2004;9(4):897-908.
DOI:10.1590/S1413-81232004000400011
21. Sichieri R, Nascimento S, Coutinho W. The burden of hospitalization due to overweight and obesity
in Brazil. Cad Saude Publica. 2007;23(7):1721-7.
DOI:10.1590/S0102-311X2007000700025
22. Shaten BJ, Smith GD, Kuller LH, Neaton JD. Risk Factors for the Development of Type II Diabetes Among Men Enrolled in the Usual Care Group of the Multiple Risk
Factor Intervention Trial. Diabetes Care 1993;16:1331-9.
23. Travassos C, Oliveira EXG, Viacava F. Desigualdades geográficas e sociais no acesso aos serviços de saúde no Brasil: 1998 e 2003.
Cienc Saude Coletiva. 2006;11(4):975-86.
DOI:10.1590/S1413-81232006000400019
24. World Health Organization. The global burden of disease: 2004 update. Geneva; 2008.
25. World Health Organization. Global status report on noncommunicable diseases 2010. Geneva; 2011.
26. Yoon YS, Shin SA, Noh JH, Oh SW. Burden of type 2 diabetes in young Korean adults owing
to obesity. Diabetes Care. 2005;28(9):2329.
DOI:10.2337/diacare.28.9.2329
27. Zhang J, Yu KF. What’s the relative risk? A method of correcting the odds ratio in cohort studies of
common outcomes. JAMA. 1998;280(19):1690-1.