1
Universidade Estadual de Campinas, Faculdade de Ciências Médicas, Departamento de Saúde Coletiva. R. Tessália Vieira de Camargo, 126, Cidade Universitária Zeferino Vaz, 13083-887, Campinas, SP, Brasil. Correspondência para/Correspondence to: AM SEGALL-CORRÊA. E-mail: <[email protected]>.
2
McGill University, Institute for Global Food Security, Faculty of Agricultural and Environmental Sciences. Montreal, Quebec, Canada.
3
Yale University, School of Public Health, Department of Chronic Disease Epidemiology. New Haven, CT, United States.
Refinement of the Brazilian Household
Food Insecurity Measurement Scale:
Recommendation for a 14-item EBIA
Aprimoramento da Escala Brasileira de Medida
Domiciliar de Insegurança Alimentar
:
recomendação de EBIA com 14 itens
Ana Maria SEGALL-CORRÊA1
Letícia MARIN-LEÓN1
Hugo MELGAR-QUIÑONEZ2
Rafael PÉREZ-ESCAMILLA3
A B S T R A C T
Objective
To review and refine Brazilian Household Food Insecurity Measurement Scale structure.
Methods
The study analyzed the impact of removing the item “adult lost weight” and one of two possibly redundant items on Brazilian Household Food Insecurity Measurement Scale psychometric behavior using the one-parameter logistic (Rasch) model. Brazilian Household Food Insecurity Measurement Scale psychometric behavior was analyzed with respect to acceptable adjustment values ranging from 0.7 to 1.3, and to severity scores of the items with theoretically expected gradients. The socioeconomic and food security indicators came from the 2004 National Household Sample Survey, which obtained complete answers to Brazilian Household Food Insecurity Measurement Scale items from 112,665 households.
Results
Conclusion
Brazilian Household Food Insecurity Measurement Scalereanalysis reduced the number of scale items from 16 to 14 without changing its internal validity. Its use as a nationwide household food security measure is strongly recommended.
Indexing terms: Food security. Hunger. Psychometrics. Scale.
R E S U M O
Objetivo
Revisar e aprimorar a estrutura da Escala Brasileira de Medida Domiciliar de Insegurança Alimentar.
Métodos
A avaliação do impacto resultante da remoção do item “adulto perdeu peso” e de um de dois itens possivelmente redundantes sobre o comportamento psicométrico da Escala Brasileira de Medida Domiciliar de Insegurança Alimentar foi realizada com uso de análise estatística por modelo logístico de parâmetro único de Rasch. O comportamento psicométrico da Escala Brasileira de Medida Domiciliar de Insegurança Alimentar foi analisado em relação a valores aceitáveis de ajustamento ao modelo, entre 0,7 e 1,3 e escore de severidade dos itens com gradientes teoricamente esperados. Para as análises, foram usados dados da Pesquisa Nacional Por Amostra
de Domicílios de 2004, com 112.665 domicílios visitados e com respostas completas para os itens da Escala
Brasileira de Medida Domiciliar de Insegurança Alimentar.
Resultados
Retirando o item “adulto diminuiu os alimentos” e posteriormente “adulto comeu menos” não foi observada mudança nos ajustes dos demais itens, exceto quanto a “adulto perdeu peso”, que passou de 1,21 para 1,56. Posteriormente, este e um dos itens redundantes foram excluídos, sendo mantidos adequados a consistência interna e os valores de severidade dos itens.
Conclusão
A reanálise reduziu os itens da escala de 16 para 14, o que manteve a validade interna da escala. Sua adoção como medida nacional da segurança alimentar domiciliar é, portanto, fortemente recomendada.
Termos de indexação: Segurança alimentar. Fome. Psicometria. Escala.
I N T R O D U C T I O N
In January 2003, around the time when the program Fome Zero (Zero Hunger)1 was
launched, a series of studies were undertaken to adapt and validate to the Brazilian reality an instrument that directly measures household food security. Back then, the absence of direct methods or indicators for following and assessing public policies against food insecurity and hunger was recognized.
In early 2003, a multicentric project was carried out to validate a scale that measured household food security directly, resulting in the, Escala Brasileira da Insegurança Alimentar (EBIA, Brazilian Household Food Insecurity Measurement Scale). Six research institutions participated in all
phases of this project, namely the Universidade Estadual de Campinas (Unicamp), coordination, Universidade de Brasília (UnB), Universidade Federal da Paraíba (UFPB), Universidade Federal do Mato Grosso (UFMT), Instituto Nacional de Pesquisa Amazônica (INPA), and University of Connecticut (UCONN)2,3. The North American
household food security scale, known as Household Food Security Survey Module (HFSSM), was then considered an appropriate starting point for building a similar instrument in Brazil4.
with groups of nutrition experts and Food and Nutrition Security (FNS) policy managers were organized, followed by 11 focal groups with representatives from rural and urban communities2,3,5.
The second stage of EBIA’s validation process administered quantitative surveys to convenience samples in the same areas of the four Brazilian regions mentioned above, where the expert and focus group meetings took place2,3.
The Brazilian Household Food Insecurity Measurement Scale version resulting from the study conducted in 2003 had 15 items, three less than the number of items of the HFSSM, the scale that provided EBIA’s foundation. Important structural changes were also made, but they did not affect the theoretical assumptions upon which experience-based household food security scales rest2-4. These assumptions constitute the grouping
of concepts that enable estimating food security prevalences and classifying households into three levels of food insecurity severity, namely mild, moderate, and severe.
All quantitative analyses showed that EBIA is an instrument with high internal consistency and ability to reliably predict (external validity) food security and insecurity6,7. The external validity
analysis relied on food intake and traditional food access predictors, such as income and education level2,3.
In 2003 the Ministério do Desenvolvimento Social e do Combate a Fome (MDS, Ministry of Social Development and Fight against Hunger) managers recommended and provided the required resources to include EBIA as a special module in the 2004 Pesquisa Nacional por Amostra de Domicílios (PNAD, National Household Income and Expenditures Survey) questionnaire, developed by the Instituto Brasileiro de Geografia e Estatística (IBGE, Brazilian Institute of Geography and Statistics)8. EBIA provided the
first nationally representative diagnosis of food security/insecurity in Brazil, and included both urban and rural areas. These results became the reference baseline for later surveys, such as the Pesquisa Nacional de Demografia e Saúde 2006
(PNDS, National Demographic and Health Survey) and PNAD 20099,10.
National surveys and many academic studies confirmed EBIA’s appropriateness and validity11-14. Nevertheless, the results also indicated
the possibility of improving EBIA by adjusting and suppressing some items, and this observation was consistent with the new information that became available in the specialized scientific literature15-21.
The decision to review EBIA after its widespread use for more than six years was communicated to MDS’s evaluation managers, who decided to support a meeting of experts to discuss EBIA’s reanalysis results. The statistical analyses were discussed by experts and summarized in a technical report for MDS and IBGE.
The objective of this communication is to describe EBIA’s refinement process and compare the two versions of the scale with respect to their psychometric characteristics using the Rasch model.
M E T H O D S
The analytical procedures aiming to refine EBIA relied on a one-parameter logistic model, the Rasch model6,7,22,23. The Rasch model has
historically been used in education knowledge testing. Like other techniques based on Item Response Theory (IRT), this model analyzes binary answers (correct/incorrect or yes/no) to questions distributed in a continuum of increasing difficulty. More recently, this statistical technique has been used for analyzing the internal validity of food security measurement scales with similar item structure and psychometric characteristics6,7.
Rasch model-based analysis estimates the severity of food insecurity (expected scores) of a household and item most consistent with the answers, according to model-dependent assumptions4,23,24. These procedures also provide
item meet the model’s assumptions. This statistic compares the discrimination ability of each item with the mean discrimination given by all items23,24.
The final score of the level of food insecurity of each household constitutes a nonlinear scale with intervals distributed along increasing levels of item severity.
As has been done in the field of education23,
the following assumptions must be met to justify using the Rasch model for analyzing the psychometric behavior of food insecurity measurement scales8:
a) As the severity expressed by an item of the scale increases, the probability that it is affirmed decreases;
b) As the food insecurity of the interviewee increases (as food access becomes harder), the probability that he/she will answer yes to all items increases. The higher the food insecurity of the interviewee (greater difficulty to access food), the higher the probability that he/she will answer affirmatively to all items.
c) The relationship between food insecurity and affirmed items is described by a mathematical formula that corresponds to a logistic model in which the odds of a household classified with a certain degree of food insecurity severity (h) of affirming an item (i) is equal to the power of (h-i):
ph,i=e(h-i)/(1+e(h-i)
d) All scale items have the same power of discrimination.
The use of the Rasch model for assessing the psychometric behavior of food security measurement scales is justified by a fact observed in previous analyses, which indicate that the scales’ items are sufficiently consistent with these assumptions4,8. During the process of validation
of the original 15-item EBIA for inclusion in the 2004 PNAD’s questionnaire, the question “…member older than 18 years cut meal size or skipped meals…” should actually be asking two
different things, namely “cutting meal size” and “skipping meals,” - thus, this question was disaggregated into two questions. Since this did not change the validity of the scale significantly, this modification was maintained, leading to the 16-item EBIA. The 2004 PNAD analyses included 112,665 households of which 68,369 had at least one member aged less than 18 years, and the remainder 44,296 households had only adults. All the households sampled by PNAD 2004 that had no missing data for any of the 16 EBIA items were included in the analyses.
The Brazilian Household Food Insecurity Measurement Scale reanalysis using the Rasch model included the progressive and alternated exclusion of each item. First, the item “interviewee lost weight” (EB9) was removed, followed by the item “adult cut meal size” (EB5a), and lastly, “adult started skipping meals” (EB5b). The Rasch analysis was repeated at each step, as each item was excluded, to measure the psychometric behavior of the resulting scale. Basically, the fit of the items to the expected model (infit) was analyzed, with values between 0.7 and 1.3 being considered appropriate, observing the severity measure sequence of each item. At the end, this analysis was repeated with the 14-item EBIA (EBIA14).
In the second stage of the study, we tested the predictive or external validity of EBIA14. Tentative cut-off points were used for classifying households with and without individuals under 18 years of age into different levels of household food insecurity. These levels were then associated with different socioeconomic and demographic factors, including household income and skin color of the household head. Chi-square tests were used for examining these statistical associations using p<0.05 as a criterion for statistical significance.
R E S U L T S
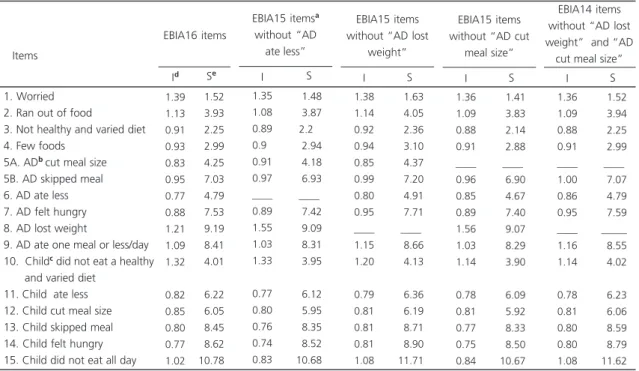
18 years of age. The items’ fit (infit) and severity were similar in the 16-item scale and the alternative 15-item and 14-item scales. This shows that the omitted items did not affect EBIA’s internal consistency.
In the 15-item Brazilian Household Food Insecurity Measurement Scale, when the following items were removed one at a time, “adult ate less than he/she felt he/she should” and “adult cut meal size”, the fit statistic (infit) changed slightly; the most significant change occurred in the item “adult lost weight”: the infit value increased from 1.21 to 1.55 and 1.56, respectively, hence beyond the appropriate limits (0.7 and 1.3). However, when only the item “adult lost weight” was excluded, all items presented appropriate infit values, and the item “worried” presented a marginally acceptable value (1.36). Also, in the 15-item EBIA, the fit of the item “individual aged less than 18 years did not consume a healthy and
varied diet” fell within the optimal interval (0.8 to 1.2), contrasting with its less than optimal fit in the 16-item EBIA (Figure 1).
In relation to the Brazilian Food Insecurity Measurement Scale 14, the magnitude of the severity measures of the items follows the same pattern. When EBIA16 and EBIA14 are compared, the item severity values have very similar magnitudes and follow the same sequence order. As theoretically expected the severity values of the items decreases exponentially from the more to the less severe items (Figure 2). The item “the child did not eat all day” has the highest and the item “household members were worried” has the lowest severity measure. The ordering of the items according to their level of severity meets one of the key assumptions of the Rasch model: “the higher the severity of a scale item, the lower its probability of being answered affirmatively” (p.66)8.
Table 1. Infit and severity values of the items of the Brazilian Household Food Security Scale with 16, 15 and 14 items in households with at least one person younger than 18 years. Brazil, 2010.
EBIA16 items
1. Worried 2. Ran out of food
3. Not healthy and varied diet 4. Few foods
5A. ADbcut meal size
5B. AD skipped meal 6. AD ate less 7. AD felt hungry 8. AD lost weight
9. AD ate one meal or less/day 10. Childc did not eat a healthy
and varied diet 11. Child ate less 12. Child cut meal size 13. Child skipped meal 14. Child felt hungry 15. Child did not eat all day
Items
Id Se
1.39 1.13 0.91 0.93 0.83 0.95 0.77 0.88 1.21 1.09 1.32 0.82 0.85 0.80 0.77 1.02 01.52 03.93 02.25 02.99 04.25 07.03 04.79 07.53 09.19 08.41 04.01 06.22 06.05 08.45 08.62 10.78
EBIA15 itemsa
without “AD ate less” I S 1.35 1.08 0.89 0.90 0.91 0.97 ____ 0.89 1.55 1.03 1.33 0.77 0.80 0.76 0.74 0.83 01.48 03.87 2.20 02.94 04.18 06.93 ____ 07.42 09.09 08.31 03.95 06.12 05.95 08.35 08.52 10.68 EBIA15 items without “AD lost
weight” I S 1.38 1.14 0.92 0.94 0.85 0.99 0.80 0.95 ____ 1.15 1.20 0.79 0.81 0.81 0.81 1.08 01.63 04.05 02.36 03.10 04.37 07.20 04.91 07.71 ____ 08.66 04.13 06.36 06.19 08.71 08.90 11.71 EBIA15 items without “AD cut
meal size” I S 1.36 1.09 0.88 0.91 ____ 0.96 0.85 0.89 1.56 1.03 1.14 0.78 0.81 0.77 0.75 0.84 01.41 03.83 02.14 02.88 ____ 06.90 04.67 07.40 09.07 08.29 03.90 06.09 05.92 08.33 08.50 10.67 EBIA14 items without “AD lost weight” and “AD
cut meal size”
I S 1.36 1.09 0.88 0.91 ____ 1.00 0.86 0.95 ____ 1.16 1.14 0.78 0.81 0.80 0.80 1.08 01.52 03.94 02.25 02.99 ____ 07.07 04.79 07.59 _____ 08.55 04.02 06.23 06.06 08.59 08.79 11.62
Note: aScales with less than 16 items were obtained from the sucessive exclusion of items 6, 8, and 5A; bAD: Adult= individual 18 years old or older; cChild: individual aged less than 18 years;dInfit value; eSeverity value.
It is possible to group items according to the proximity of the clustering of their severity measures, taking into account the theoretical assumptions of the household food security measurement scales: a) in a mild food insecurity situation, families develop strategies to ensure
access to foods that may compromise the quality of their diet; b) if the coping strategies are not effective or the condition that compromised food access did not change, there is food restriction, especially for the adults, and c) the household adults and children experience hunger4. The
Figure 1. Distribution of infit values of the Brazilian Household Food Security Scale items by type of scale in households with at least one person younger than 18 years. Brazil, 2010.
Source: Pesquisa Nacional por Amostra de Domicílio, 2004 (National Household Income and Expenditures Survey). .
Figure 2. Distribution of severity values of the Brazilian Household Food Security Scale items by type of scale in households with at least one person younger than 18 years. Brazil, 2010.
grouping by level of severity and the corresponding frequencies of affirmed items (Table 2) characterize these conditions: group A represents mild food insecurity, group B, moderate food insecurity, and group C, severe food insecurity. These conceptual groupings along with the Rasch analysis results provide the basis for establishing the cutoff points of the 14-item scale, which are not presented in this article.
The Brazilian Food Insecurity Measurement Scale 14’s predictive ability (external validity) was also studied by assigning households to food insecurity using tentative cutoff points. In households with a family income per member equivalent to 25.0% of the minimum salary or less, the prevalence of severe food insecurity is 28.9%. By contrast, the corresponding prevalence is 0.2% in households whose members have an income of five minimum salaries or more. Similar results were found when the sociodemographic characteristics of the household head were analyzed by level of food insecurity. Severe food insecurity is 3.5 times more prevalent among
families with a Black vs. a White household head. Severe food insecurity is 2.9 times more prevalent in households where the head has 5 years or less vs. more than 5 years of schooling. Other indicators, such as household size, employment, and gender of the household head, are associated in similar ways with food insecurity. All of these associations are statistically significant.
D I S C U S S I O N
Food insecurity can be associated with both weight loss and weight gain19,20-22. This
change is especially appropriate in the context of the nutritional transition seen in Brazil16
characterized by high prevalences of overweight and obesity, especially among the poorest, and therefore, most vulnerable to food insecurity17,22.
The exclusion of this item was based on psychometric analysis and does not affect the conceptual foundation of EBIA.
Additionally, the identification of two questions with similar semantic meaning, “adult
Table 2. Frequency of affirmative answers (%) to items and severity values in households with at least one person younger than 18 years by EBIA with 16 items and EBIA with 14 items. Brazil, 2010.
A
B
C
1a Worried
3 Not healthy and varied diet 4 Few types of foods 2 Ran out of food
10 Childbdid not eat healthy and varied diet
6 Adultcate less
12 Child had to cut meal size 11 Child ate less
5b Adult skipped meal 7 Adult felt hungry
9 Adult ate one meal/day or less 13 Child skipped meal 14 Child felt hungry 15 Child did not eat all day
37.8 33.8 31.8 27.1 23.7 20.6 13.7 12.9 10.8 09.1 07.2 06.0 05.6 02.3
01.52 02.25 02.99 03.93 04.01 04.79 06.05 06.22 07.03 07.53 08.41 08.45 08.62 10.78
01.52 02.25 02.99 03.94 04.02 04.79 06.06 06.23 07.07 07.59 08.55 08.59 08.79 11.62
Note: aThe number order 1 to 15 corresponds to the items in the original scale, except item 5b that was the last part of item 5; bChild: individual
aged less than 18 years;cAdult: individual aged 18 years or more; dBrazilian Household Food Insecurity Measurement Scale (EBIA) 16 and EBIA14
have the same value of affirmative answers since they relate to the same household and same interviewees. Source: Pesquisa Nacional por Amostra de Domicílio, 2004 (National Household Income and Expenditures Survey).
Groups EBIA14 items
EBIA14 EBIA16
Frequency of Affirmative Answers (%) EBIA16 and 14d
1. Nos últimos três meses, os moradores deste domicílio tive-ram a preocupação de que os alimentos acabassem antes de poderem comprar ou receber mais comida?
2. Nos últimos três meses, os alimentos acabaram antes que os moradores deste domicílio tivessem dinheiro para comprar mais comida?
3. Nos últimos três meses, os moradores deste domicílio ficaram sem dinheiro para ter uma alimentação saudável e variada?
4. Nos últimos 3 meses os moradores deste domicílio comeram apenas alguns poucos tipos de alimentos que ainda tinham, porque o dinheiro acabou?
5. Nos últimos três meses, algum morador de 18 anos ou mais de idade, deixou de fazer alguma refeição, porque não havia dinheiro para comprar comida?
6. Nos últimos três meses, algum morador de 18 anos ou mais de idade, alguma vez, comeu menos do que achou que de-via, porque não havia dinheiro para comprar comida? 7. Nos últimos três meses, algum morador de 18 anos ou mais
de idade, alguma vez, sentiu fome mas não comeu, porque não havia dinheiro para comprar comida?
8. Nos últimos três meses, algum morador de 18 anos ou mais de idade, alguma vez, fez apenas uma refeição ao dia ou ficou um dia inteiro sem comer, porque não havia dinheiro para comprar a comida?
9. Nos últimos três meses, algum morador com menos de 18 anos de idade, alguma vez, deixou de ter uma alimentação saudável e variada, porque não havia dinheiro para compa-rar comida?
10. Nos últimos 3 meses, algum morador com menos de 18 anos de idade alguma vez, não comeu quantidade suficiente de comida porque não havia dinheiro para comprar comida? 11. Nos últimos três meses, alguma vez foi diminuída a
quanti-dade de alimentos das refeições de algum morador com me-nos de 18 ame-nos de idade, porque não havia dinheiro para comprar a comida?
12. Nos últimos três meses, alguma vez, algum morador com menos de 18 anos de idade deixou de fazer alguma refeição, porque não havia dinheiro para comprar a comida? 13. Nos últimos três meses, alguma vez, algum morador com
menos de 18 anos de idade sentiu fome, mas não comeu porque não havia dinheiro para comprar mais comida? 14. Nos últimos três meses, alguma vez algum morador com
me-nos de 18 ame-nos de idade fez apenas uma refeição ao dia ou ficou sem comer por um dia inteiro, porque não havia di-nheiro para comprar comida?
Quadro 1. Escala Brasileira de Medida de Insegurança Alimentar com 14 itens (EBIA14) para classificação da condição de segurança alimentar nos domicílios, nos três me-ses anteriores à entrevista. Brasil, 2010.
Chart 1.Brazilian Household Food Security Scale with 14 items (EBIA14) for classifying household food security in the last three months. Brazil, 2010.
1. In the last 3 months, did household members worry that they would run out of food before being able to buy or receive more food?
2. In the last 3 months, did household members run out of food before having money to buy more?
3. In the last 3 months, did household members run out of money to have a healthy and varied diet?
4. In the last 3 months, did household members eat only a few kinds of foods they still had because they had run out of money?
5. In the last 3 months, did any household member 18 years old or older skip a meal because there was no money to buy food?
6. In the last 3 months, did any household member 18 years old or older eat less than what he/she felt he/she should because there was no money to buy food?
7. In the last 3 months, did any household member 18 years old or older feel hungry but did not eat because there was no money to buy food?
8. In the last 3 months, did any household member 18 years old or older have just one meal a day or didn’t eat for a whole day because there was no money to buy food?
9. In the last 3 months, did any household member aged less than 18 years stop having a healthy and varied diet because there was no money to buy food?
10. In the last 3 months, did any household member aged less than 18 years not have enough to eat because there was no money to buy food?
11. In the last 3 months, did any person in your household aged less than 18 years have to reduce the size of meals because there was no money to buy food?
12. In the last 3 months, did any household member aged less than 18 years skip a meal because there was no money to buy food?
13. In the last 3 months, did any household member aged less than 18 years feel hungry but could not eat because there was no money to buy more food?
14. In the last 3 months, did any household member aged less than 18 years have just one meal a day or went without eating for a whole day because there was no money to buy food?
Note: Data Source: IBGE - PNAD 2004; FI: Food Insecurity.
cut meal size” and “adult ate less,” led to the realization that these items had similar infit values and severity measures, confirming that they were redundant, and therefore, one of them should be excluded. Hence, the former reports of interviewees interpreting these two questions similarly are confirmed.
These analyses enabled the study authors, IBGE researchers, food security policy management technicians, and other experts to gather in a seminar promoted by the MDS and adopt, by consensus, the new EBIA14 scale (Chart 1). On this occasion, IBGE researchers decided to reanalyze PNAD 2004 data and analyze PNAD 2009 data with the new scale, thereby allowing comparison of the results of these two nationally representative surveys10.
Only a few countries besides Brazil use the scientific data produced by reliable and valid measures to analyze their public policies against food insecurity. Data generated by academic studies11-15,19,20,25,26 supported or not by public and
governmental research institutions like IBGE8-10
have been useful for the development of evidence-based public food and nutrition security policies27
and thus help to improve food security governance28, a fact that strongly motivated us
to refine EBIA.
C O N C L U S I O N
The changes proposed for EBIA consist of refinements that update it with respect to the Brazilian nutritional reality and simplify its content by excluding a redundant item. At the same time, it reduces the costs of its administration by national surveys conducted by IBGE.
The Brazilian Food Insecurity Measurement Scale’s refinement did not change its internal consistency or modify the ordering of the 14 items when these were compared against the expected theoretical sequence.
The Brazilian Food Insecurity Measurement Scale 14 has high internal consistency and high
predictive ability (external validity), which strongly encourages its nationwide use as an instrument for measuring household food security and insecurity.
The next step in this research study is to determine EBIA14’s cutoff points for classifying households with (14 items) and without (8 items) individuals under 18 years of age according to the level of household food (in)security. The goal is for these cutoff points to detect equivalent levels of severity in household with and without children using Rasch item severity comparative analyses. These analyses will involve comparing Rasch item severities in households with and without individuals under 18 years of age. For this purpose we will use representative EBIA14 data drawn from diverse national surveys, including PNAD 2004, PNAD 2009, PNAD 2013, PNDS 2006, and other surveys conducted in specific vulnerable populations. The cutoff points will then be tested for consistency across surveys. Once the final set of cutoff points is determined, we will proceed to estimate the prevalences of household food insecurity and compare them with the prevalences previously determined by EBIA16 and their corresponding cutoff points. We expect that this effort will allow Brazil to monitor household food insecurity and help improve food security governance using well validated cutoff points for EBIA14 that we conclude, based on the findings reported herein, has very strong psychometric validity and utility in the Brazilian context. We strongly recommend Brazil to adopt EBIA14 as its national household food security measure.
C O N T R I B U T O R S
All authors helped to conceive and design the study; analyze and interpret the data; and review all versions of the article. AM SEGALL-CORRÊA performed the statistical analyses.
R E F E R E N C E S
Desenvolvimento Agrário; 2010 [acesso 2014 jan 6]. Disponível em: <http://www.fao.org/docrep/ 016/i3023p/i3023p.pdf>.
2. Segall-Corrêa AM, Perez-Escamilla R, Marin-Leon L, Yuyama L, Vianna RPT, Coitinho D, et al. Evaluation of household food insecurity in Brazil: Validity assessment in diverse sociocultural settings. Santiago: FAO; 2009 [cited 2014 Jan 6]. Available from: <http://www.rlc.fao.org/iniciativa/pdf/ memredsan.pdf>.
3. Pérez-Escamilla R, Segall-Corrêa AM, Maranha LK, Archanjo MF, Marin-León L, Panigassi G. An adapted version of the US Departament of Agriculture Food Insecurity Module is a valid tool for assessing food insecurity in Campinas, Brasil. J Nutr. 2004; 134(8):1923-8.
4. Bickel G, Nord M, Price C, Hamilton W, Cook J. Guide to measuring household food security: Revised 2000. Alexandria: United States Department of Agriculture; 2000 [cited 2014 Jan 6]. Available from: <www.ers.usda.gov/ publications/fanrr11-1/fanrr11_1b.pdf>.
5. Sampaio MFA, Kepple AW, Segall-Corrêa AM, Oliveira JA, Panigassi G, Maranha LK, et al.
(In)segurança alimentar: experiência de grupos focais com populações rurais do Estado de São Paulo. Segur Alimen Nutr. 2006; 13(1):64-77. 6. Hackettt M, Melgar-Quiñonez H, Pérez-Escamilla
R, Segall-Corrêa AM. Gender of respondent does not affect the psychometric properties of the Brazilian household food security scale. Int J Epidemiol. 2008; 37(4):766-74.
7. Melgar-Qinonez H, Nord M, Pérez-Escamilla R, Segall-Corrêa AM. Psychometric properties of a modified US-household food security survey module in Campinas, Brazil. Eur J Clin Nutr. 2008; 62:665-73; doi: 10.1038/sj.ejcn.1602760 8. Instituto Brasileiro de Geografia e Estatística.
Pes-quisa nacional por amostra de domicílios: suple-mento de segurança alimentar. Rio de Janeiro: IBGE; 2006 [cited 2014 jan 6]. Disponível em: <http:// bvsms.saude.gov.br/bvs/publicacoes/pnad_ seguranca_alimentar.pdf> .
9. Brasil. Ministério da Saúde. Pesquisa nacional de demografia e saúde da criança e da mulher: dimensões do processo reprodutivo e da saúde da criança - PNDS 2006. Brasília: Ministério da Saúde; 2009. Série G: Estatística e Informação em Saúde. 10. Instituto Brasileiro de Geografia e Estatística. Pes-quisa nacional por amostra de domicílio: seguran-ça alimentar. Rio de Janeiro: IBGE; 2010 [acesso 2014 jan 6]. Disponivel em: <http://www.ibge.gov. br/home/estatistica/populacao/seguranca_ alimentar_2004_2009/default.shtm>.
11. Panigassi G, Segall-Corrêa AM, Marin-León L, Pérez-Escamilla R, Sampaio MFA, Maranha LK. Insegu-rança alimentar como indicador de iniqüidade: análise de inquérito populacional. Cad Saúde Públi-ca. 2008; 24(2):2376-84.
12. Vianna RPT, Segall-Corrêa AM. Insegurança ali-mentar das famílias residentes em municípios do interior do estado da Paraíba, Brasil. Rev Nutr. 2008; 21(Supl):111s-22s.
13. Salles-Costa R, Pereira RA, Vasconcellos MTL, Veiga GV, Marins VMR, Jardim BC, et al. Associação entre fatores socioeconômicos e insegurança alimentar: estudo de base populacional na Região Metro-politana do Rio de Janeiro, Brasil. Rev Nutr. 2008; 21(Supl):99-109.
14. Anschau FR, Matsuo T, Segall-Corrêa AM. Inse-gurança alimentar entre beneficiários de programas de transferência de renda. Rev Nutr. 2012; 25(2): 177-89. doi: 10.1590/S1415-52732012000200 001
15. Vianna RPT, Hromi-Fiedler AJ, Segall-Corrêa AM, Pérez-Escamilla R. Household food insecurity in small municipalities in Northeastern Brazil: A validation study. Food Secur. 2012; 4(2):295-303. 16. Batista Filho M, Rissin A. A transição nutricional no Brasil: tendências regionais e temporais. Cad Saúde Pública. 2003; 19(Supl 1):181s-9s.
17. Drewnowski A, Specter SE. Poverty and obesity: The role of energy density and energy costs. Am J Clin Nutr. 2004; 79(1):6-16.
18. Instituto Brasileiro de Geografia e Estatística. Pesquisa de orçamentos familiares 2008-2009. Rio de Janeiro: IBGE; 2010 [acesso 2014 jan 6]. Disponível em: <http://www.ibge.gov.br/home/ estatistica/populacao/condicaodevida/pof/ 2008_2009_encaa/pof_20082009_encaa.pdf>. 19. Schlussel MM, Silva AAM, Pérez-Escamilla R, Kac
G. Household food insecurity and excess weight/ obesity among Brazilian women and children: A life-course approach. Cad Saúde Pública. 2013; 29(2): 219-26.
20. Kac G, Velasquez-Melendez G, Schlussel MM, Segall-Corrêa AM, Silva AA, Pérez-Escamilla R. Severe food insecurity is associated with obesity among Brazilian adolescent females. Public Health Nutr. 2012; 15(10):1854-60. doi: 10.1017/S1368 980011003582
21. Cordeiro LS, Wilde PE, Semu H, Levinson FJ. Household food security is inversely associated with undernutrition among adolescents from Kilosa, Tanzania. J Nutr. 2012; 142(9):1741-7.
U.S. children: Is there a paradox? Arch Pediatr Adolesc Med. 2001; 155(10):1161-7.
23. Bond T, Fox C. Applying the Rasch model: Fundamental measurement in the human sciences. New Jersey: Lawrence Erbaum Associates; 2001. 24. Nord M, Andrews M, Winicki J. Frequency and
duration of food insecurity and hunger in US households. J Nutr Educ Behav. 2002; 34(4):194-200. 25. Segall-Corrêa AM, Marín-León L, Pérez-Escamilla R, Helito H, Pacheco LMS, Souza RP. A transferência de renda no Brasil e a insegurança alimentar; anali-sando a PNAD 2004. Rev Nutr. 2008; 21(Supl):39s-51s. 26. Segall-Correa AM, Marín-León L, Panigassi G, Perez--Escamilla R. Segurança alimentar no domicílio. In: Ministério da Saúde; Centro Brasileiro de Análise e Planejamento, Organizadores. Pesquisa Nacional de Demografia e Saúde da criança e da mulher - PNDS 2006: dimensões do processo reprodutivo e da
saúde da criança. Brasília: Ministério da Saúde; 2009. v.1:227-44.
27. Tapajós L, Quiroga J, Pereira F, Pinto A. O processo de avaliação da política de segurança alimentar e nutricional entre 2004 e 2010. Brasília: Ministério do Desenvovlimento Social e Combate a Fome; 2010 [acesso 2014 jan 6]. Disponível em: <http:// www.mds.gov.br/segurancaalimentar/ publicacoes/ livros/fome-zero-2013-uma-historia-brasileira- 2013-volumes-1-2-e-3/fome-zero-2013-uma-historia-brasileira-2013-volumes-1-2-e-3>. 28. Pérez-Escamilla R. Can experience-based household
food security scales help improve food security governance? Glob Food Sec. 2012; 1(2):120-5.