INTRODUCTION
Address to: Dr. José Manuel Macário Rebêlo. Laboratório de Entomologia
e Vetores/Depto de Patologia/UFMA. Praça Madre Deus 2, 65025-560 São Luis, MA, Brasil.
Phone: 55 98 3231-3644
e-mail: [email protected]
Received 22 November 2012
Accepted 03 June 2013
An analysis of the spatiotemporal distribution of American
cutaneous leishmaniasis in counties located along road and
railway corridors in the State of Maranhão, Brazil
Vicente Silva Gonçalves Neto
[1],[2],
Allan Kardec Duailibe Barros Filho
[1],[3],
Alcione Miranda dos Santos
[4],
Margarida Paula Carreira de Sá Prazeres
[5],
Ana Célia Rolim Bezerril
[6],
Alexandre Vitor de Lima Fonseca
[7]and José Manuel Macário Rebêlo
[8],[9][1]. Rede Nordeste de Biotecnologia. [2]. Coordenação de VISA de Portos, Aeroportos e Fronteiras, Agência Nacional de Vigilância Sanitária, São Luis, MA. [3]. Laboratório de Processamento da Informação Biológica, Departamento de Engenharia Elétrica, Universidade Federal do Maranhão, São Luis, MA. [4]. Programa de Pós-Graduação em Saúde Coletiva, Departamento de Saúde Pública, Universidade Federal do Maranhão, São Luis, MA. [5]. Agência Estadual de Defesa Agropecuária, Secretaria de Agricultura, Pecuária e Pesca do Estado do Maranhão, São Luis, MA. [6]. Departamento de Epidemiologia, Secretaria de Saúde do Estado do Maranhão, São Luis, MA. [7]. Departamento de Geociências, Universidade Federal do Maranhão, São Luis, MA. [8]. Departamento de Biologia, Universidade Federal do Maranhão, São Luis, MA. [9]. Laboratório de Entomologia e Vetores, Departamento de Patologia, Universidade Federal do Maranhão, São Luis, MA.
ABSTRACT
Introduction: The incidence of American cutaneous leishmaniasis (ACL) is increasing in Latin America, especially in Brazil, where 256,587 cases were confi rmed in the last decade. Methods: This study used a Bayesian model to examine the spatial and temporal distribution of ACL cases between 2000 and 2009 in 61 counties of State of Maranhão located along the three main road and railway corridors. Results: During the study period, 13,818 cases of ACL were recorded. There was a signifi cant decrease in the incidence of ACL in the ten study years. The recorded incidence rate ranged from 7.36 to 241.45 per 100,000 inhabitants. The relative risk increased in 77% of the counties, decreased in 18% and was maintained in only fi ve counties. Conclusions: Although there was a decreased incidence of the disease, ACL was present in all of the examined municipalities, thus maintaining the risk of contracting this illness.
Keywords: American cutaneous leishmaniasis. Bayesian model. Spatio temporal distribution. Relative risk.
American cutaneous leishmaniasis (ACL) is an infectious disease affecting the skin and mucosa. It is caused by protozoa of the genus Leishmania and is transmitted by different species of phlebotomine sandfl ies1.
The incidence of ACL is increasing in Latin America, especially in Brazil, where 256,587 cases were recorded from 2000 to 2009. In this period, 82,510 (32.2%) cases were reported in the northeastern region of the country, of which 32,548 (39.4%) came from the State of Maranhão2.
The State of Maranhão is located among three biomes that display variations in physiographic, climatic and ecosystem diversity. These regions are of critical importance in the
epidemiology of ACL, as they are highly endemic for the disease. The Cerrados of central Brazil are situated in the eastern portion of this region, while Caatinga ecosystems are found to the northeast and the Amazonian forest to the west3.
Several researchers have conducted spatial analyses of the dynamics of infectious diseases4,5. The analysis of relative risk (RR) over space and time has received a great deal of attention in epidemiological studies over the last few decades. Many studies assume that RR is composed of several random components, and these components explain different variations related to risk, such as temporal and spatial effects4,6,7.
In this study, data on ACL from 2000-2009 were analyzed. The ACL data were expected to be correlated in space due to exposure to common environmental characteristics that infl uence transmission similarly in neighboring areas. The standard statistical methods assume independent observations. To take spatial correlations into account, Bayesian spatiotemporal models8,9 were developed to evaluate the spatiotemporal autocorrelation of the disease. Due to the large number of model parameters, a Markov Chain Monte Carlo (MCMC) simulation was used for model fi tting.
METHODS
RESULTS
DISCUSSION
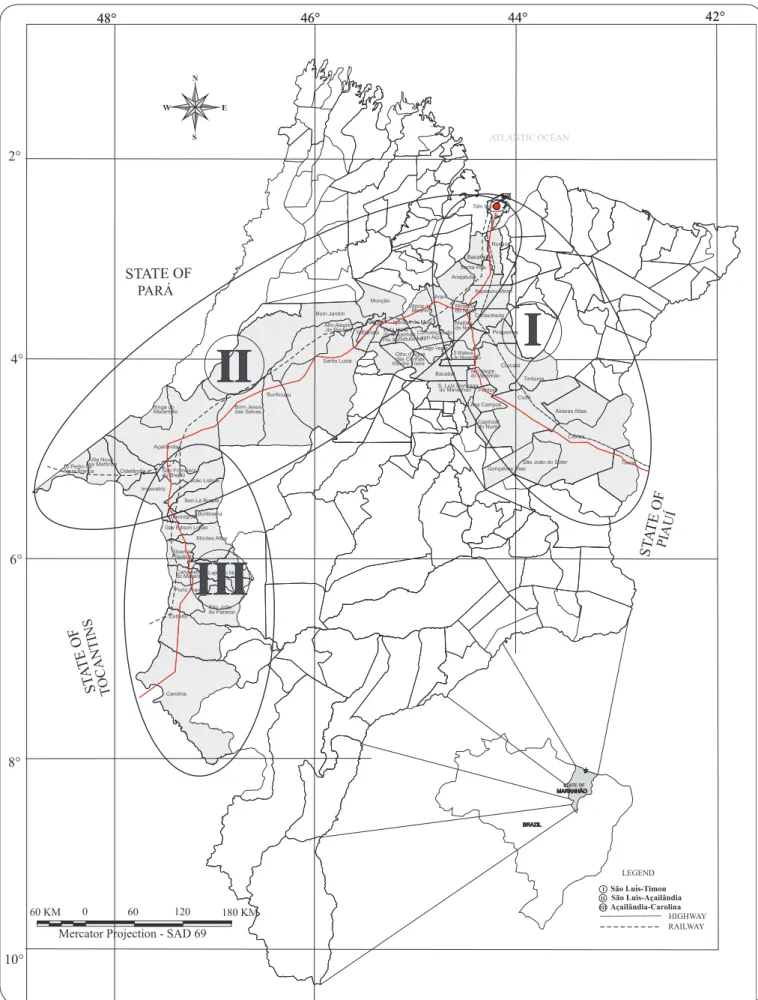
We conducted a retrospective ecological study describing the spatiotemporal distribution of ACL cases in 61 counties in the State of Maranhão, Brazil, from 2000 to 2009. Sixty-one counties located along the main road and railway corridors were selected as the study sites: I - São Luis-Timon (construction started in 1895): 27 counties along roads 135 and 316 and the line of the Northeastern Railway Company; II - São Luis-Açailândia (beginning of the 1980s): 20 counties along roads 135 and 222 and the line of the Carajás Railroad; and III - Açailândia-Carolina(beginning of the 1980s):14 counties along road 010 and the North-South Railroad (Figure 1).
The ACL data were obtained from the Ministry of Health of Brazil and the demographic data from the Brazilian Institute of Geography and Statistics (IBGE).
An initial descriptive analysis of ACL incidence was conducted. Bayesian spatiotemporal Poisson regression models were constructed using WinBUGS software10. The response variable, yit,was the number of ACL cases reported in county i
in year t (for i = 1, 2 ..., 61 and t = 1, 2 ..., 10). We assumed that
yit followed a Poisson distribution with a mean of eitθit, where
eit is the number of cases expected in county i at time t, and θit is the area-specifi c risk rate in county i at time t.
The number of expected cases, eit,between 2000 and 2009 for each county was calculated with the equation
eit = pitpt, pt= , where pit is the population in county i at time t.
In the disease-mapping literature, estimates of RR are obtained through a maximum likelihood estimator, which, in this case, is given by θit= yit/eit. Estimates of θit based on maximum likelihood estimators are biased, especially when the disease is rare, or the region of interest has a small population8.
In the present study, the spatiotemporal model considers
log(θit) = βt + bit,, where the temporal effect is given by βt = βt – 1 + wt, and wt is a normally distributed random error with a mean of zero and an unknown variance. This model assumes that the RR is related to both the temporal effect βt and spatiotemporal effect bit.
Prior distributions must be specified for the model parameters. We modeled the random effects terms, bit, as a conditional auto-regressive (CAR) model with variance of . For wt, we assumed an a priori non-informative Gaussian distribution with a mean of zero and an unknown variance of . Additional references using CAR prior distributions for disease mapping are provided by Bernardinelli et al.6,11,12. Inverse-gamma prior distributions were specifi ed for all of the variance parameters, with a shape of a=1 and a scale of b=1.
We estimated the parameters through an MCMC simulation. Three parallel chains were run with different initial values for the parameter estimates. A burn-in of 5,000 interactions, followed by 10,000 interactions was allowed, and the values of the main
parameters were stored. Terra View software, version 3.5, was used for mapping the resulting posterior distribution of the estimated RR parameters.
Ethical considerations
This study was approved by the Ethics Committee of the University Hospital of Maranhão Federal University (243/2008).
From 2000 to 2009, there were 13,818 cases of ACL recorded, including 4,571 cases along Line I (169 cases/county), 7,137 cases (357 cases/county) along Line II and 2,110 cases (151 cases/county) along Line III.
The annual incidence of ACLis shown in Figure 2. Since 2000, a gradual decrease in ACL incidence has been reported in the studied areas. This pattern of occurrence was common to the three lines.
The RRs for each of the 61 counties during 2000-2009 are provided in Figure 3 and Table 1. The counties along Line II always presented a high risk. However, the eastern region (Line I) of the state showed a signifi cant decrease in risk over the study years. Along Line III, different risks were observed in the counties.
Throughout the study period, the RR increased in 77% of counties, decreased in 18% and was maintained in only fi ve counties.
Recent advances in techniques and computer-based programming have helped scientists and researchers monitor environmental and ecological factors affecting the spatial and temporal distribution of several vector-borne diseases, including malaria, leishmaniasis and schistosomiasis, among other diseases7-9,13.
The Bayesian model employed here provided an estimate of the RR of ACL in the examined counties during the study period. The epidemiologic data indicated a signifi cant decrease in the incidence of ACL over the ten years addressed in this study. The examined counties were situated in an historical area for ACL transmission and displayed incidences ranging from 7.36 to 241.45/100,000 inhabitants14,15.
The area with the highest incidence of ACL was located in the western region of the state (Line II), which is under the infl uence of the Amazon rainforest and is known as an endemic disease area in Brazil14,15. The climate and vegetation of this forest favor a high diversity of vector species, reservoirs and etiological agents16-18. The phlebotomine fauna found in this area are quite diverse, with an abundance of L. whitmani, L. migonei, L. umbratilis and L. complexa being observed14,19,20. The eastern region of the state (Line I) is also under the infl uence of the Amazon forest, combined with the transitional palm forest and Cerrado moving from west to east. These 61
Σ i=1yit / Σ 61i=1Pit
^
σ2 b
ST A TE OF
STATE OF
ST ATE OF
STATE OF
. .
100 150 200 250 300
2000 2001 2002 2003 2004 2005 2006 2007 2008 2009
42.85 67.25 30.35 19.05 19.27 22.04 11.11 10.47 9.13 7.36
194.66 241.45 184.74 137.66 99.6 101.51 44.14 73.4 39.03 36.97
60.26 98.59 74.46 65 45.31 46.07 33.8 39.76 21.82 20.8 0
50
São Luis-Timon
São Luis-Açailândia
Açailândia-Carolina
,
FIGURE 3 - The relative risk of American cutaneous leishmaniasis in the counties located along road and railway corridors in the State of Maranhão, Brazil, 2000-2009. FIGURE 2 - Incidence of American cutaneous leishmaniasis cases along road and railway corridors in the State of Maranhão, Brazil, 2000-2009.
2000 2001 2002 2003 2004
2005 2006 2007 2008 2009
N
Legend<= 0.09 0.09 |- 0.50 0.50 |- 1.00
TABLE 1 - Relative risk of American cutaneous leishmaniasis in the cities located along the road and railway corridors, State of Maranhão, Brazil, 2000-2009.
County 2000 2001 2002 2003 2004 2005 2006 2007 2008 2009
Line I
Rosário 0.598 0.071 0.245 0.128 0.485 1.407 1.792 1.260 1.933 3.069
Alto Alegre do Maranhão 0.069 0.261 0.615 0.415 0.741 2.297 6.733 4.998 3.903 4.094
Cantanhede 1.089 1.312 0.456 0.662 0.595 1.251 0.585 0.427 1.659 1.957
Codó 0.713 1.116 1.093 1.100 1.192 1.139 1.035 0.783 1.063 1.159
Gonçalves Dias 0.357 0.485 0.953 1.428 3.316 1.395 4.193 3.176 3.203 4.196
São Luís Gonzaga do Maranhão 0.381 0.192 0.574 0.824 0.527 2.208 0.953 0.722 1.203 1.144
São Mateus do Maranhão 0.063 0.170 0.143 0.114 0.133 0.195 0.364 0.222 0.247 0.201
Timbiras 0.209 0.491 0.606 0.527 0.970 1.170 1.244 0.833 0.304 0.948
Timon 0.121 0.180 0.317 0.222 0.243 0.190 0.144 0.108 0.287 0.268
Santa Rita 0.141 9.080 0.464 0.185 0.734 0.441 0.261 0.188 0.402 0.508
São Luis 0.001 0.033 0.047 0.032 0.084 0.058 0.093 0.063 0.120 0.082
Miranda do Norte 0.377 0.185 0.381 2.434 1.425 0.647 0.872 0.647 0.478 0.412
Peritoró 0.217 0.438 1.190 0.555 0.581 0.427 1.164 0.865 1.739 0.802
Lago Verde 0.036 0.118 0.123 0.206 0.131 0.128 0.403 0.344 0.214 0.144
Conceição do Lago-Açu 0.033 0.099 0.132 0.189 0.214 0.215 0.257 0.288 0.242 0.162
Coroatá 0.140 0.743 0.663 0.769 0.815 0.419 0.748 0.550 0.815 0.714
Bacabal 0.040 0.086 0.073 0.084 0.102 0.104 0.193 0.103 0.470 0.200
Bacabeira 0.043 0.099 0.099 0.229 0.175 0.279 0.239 0.174 0.666 0.730
Anajatuba 0.149 0.097 0.264 0.139 0.190 0.356 1.146 0.850 0.633 0.226
Aldeias Altas 2.938 2.740 1.996 1.654 2.886 3.496 3.098 2.365 0.626 1.608
Capinzal do Norte 1.020 0.633 0.643 1.776 0.539 0.241 0.463 0.349 1.167 0.451
Caxias 4.867 3.098 2.084 1.012 1.652 1.781 0.781 0.569 1.154 0.661
São João do Soter 1.208 1.930 1.660 4.004 2.615 2.352 2.378 1.795 1.399 0.689
Itapecuru Mirim 1.068 1.378 0.808 0.636 1.362 2.207 0.627 0.415 1.427 0.933
Pirapemas 0.442 0.700 0.357 0.316 0.576 0.736 0.829 0.457 0.486 0.323
Lima Campos 0.673 1.103 1.634 2.886 0.495 0.637 1.452 1.103 1.111 0.652
Matões do Norte 0.297 0.882 2.516 0.454 0.258 0.528 0.563 0.399 0.334 0.295
Line II
Açailândia 2.002 3.869 2.703 2.707 3.938 2.723 3.026 3.025 2.225 3.390
Alto Alegre do Pindaré 0.139 1.319 1.579 1.102 1.058 2.281 2.947 2.736 5.620 7.780
Arari 0.055 0.081 0.098 0.123 0.129 0.125 0.237 0.176 0.221 0.154
Bela Vista do Maranhão 0.035 0.097 0.371 0.436 1.435 0.679 0.495 0.683 1.005 0.338
Bom Jardim 1.077 1.509 1.497 1.449 2.200 1.611 2.311 1.686 2.947 2.551
Cidelândia 2.285 0.830 2.537 1.468 1.149 1.615 2.221 1.036 5.947 3.629
Igarapé do Meio 0.039 0.120 0.282 0.712 0.232 1.013 0.276 0.393 0.329 0.243
Monção 0.042 0.087 0.174 0.239 0.299 0.232 0.317 0.286 0.296 0.227
Pindaré-Mirim 0.067 0.487 0.700 0.348 0.488 0.851 0.852 0.839 0.847 0.765
Pio XII 0.038 0.159 0.440 0.174 0.238 0.378 0.320 0.728 0.201 0.143
Santa Inês 0.037 0.311 1.110 0.532 0.470 0.632 0.371 0.769 0.437 0.410
São Pedro da Água Branca 1.080 0.128 0.876 1.087 2.880 1.223 0.298 1.190 1.926 1.296
TABLE 1 - Continue.
County 2000 2001 2002 2003 2004 2005 2006 2007 2008 2009
Line II
Vitória do Mearim 0.031 0.060 0.081 0.287 0.392 0.146 0.210 0.209 0.310 0.131
Bom Jesus das Selvas 4.472 1.867 5.459 5.301 4.644 6.323 5.631 5.960 3.463 0.952
Buriticupu 12.910 7.875 11.98 10.13 6.431 7.162 4.172 4.636 2.504 2.609
Itinga do Maranhão 7.582 5.025 3.944 5.035 8.994 4.460 6.334 8.221 6.615 7.347
Santa Luzia 4.196 3.119 2.986 5.171 2.376 3.358 1.677 4.797 4.282 3.582
Line III
Campestre do Maranhão 0.487 0.531 0.414 0.886 0.407 0.605 0.878 1.067 0.456 0.622
Carolina 0.539 0.060 0.203 0.428 1.035 0.435 3.500 1.636 3.275 1.200
Davinópolis 0.949 2.847 2.079 3.875 0.407 1.720 1.558 1.250 1.423 1.527
Governador Edson Lobão 1.557 1.675 1.386 0.860 0.588 0.987 1.322 0.778 2.188 2.777
Imperatriz 0.659 0.948 0.930 0.749 0.995 0.861 1.034 1.160 1.001 0.769
João Lisboa 0.694 0.463 1.591 2.282 1.694 1.992 1.890 2.532 1.057 0.932
Lajeado Novo 1.229 0.581 0.581 3.144 1.641 0.779 2.329 1.140 1.056 3.198
Montes Altos 1.007 1.025 3.237 4.434 3.446 2.744 10.570 3.725 2.280 3.450
Porto Franco 0.460 0.420 0.628 0.838 0.824 1.076 0.852 1.245 1.033 1.169
Ribamar Fiquene 0.556 0.412 0.741 1.517 1.095 0.794 1.609 1.127 1.432 2.425
São João do Paraíso 0.173 0.228 0.342 0.944 0.577 0.283 0.690 0.527 1.601 10.41
Senador La Rocque 0.641 1.645 3.173 5.899 3.006 2.904 1.541 2.937 2.898 2.239
São Francisco do Brejão 7.120 2.991 2.608 1.573 1.376 0.844 2.602 3.381 1.574 1.599
Estreito 0.538 0.292 0.520 0.732 0.810 1.487 1.426 0.958 0.343 0.563
Source: Secretary of Health Surveillance/Ministry of Health of Brazil.
characteristics may explain why the incidence found in this region is higher than that recorded in the southwest of the state, which is dominated by Cerrado formations, as the climate is drier in the south21,22.
Studies have shown that many species of phlebotomine ACL vectors previously found in wild environments19,20 are encroaching on rural and peri-urban areas, where they are becoming infected by Leishmania spp.17,23.
The fi rst records of ACL in Maranhão come from the late 1970s from an outbreak detected in Buriticupu15 on the Amazon side of the state. A number of outbreaks recorded in Maranhão, São Paulo and Bahia were associated with the introduction of roads and railway lines in forest areas24,25, and we believe the same phenomenon may have occurred along road and railway Line I. However, this line is much older and has existed for more than a century with no record of an infection. Thus, it is possible that the lack of cases reported in association with this line resulted from the absence of disease specialists at the time. This hypothesis finds support in current records of autochthonous cases of ACL in urban areas of Caxias26, which suggest a long-term adaptation process among phlebotomine sandfl ies (L. cortelezii, L. evandroi, L. goiana, L. intermedia, L. lenti, L. longipalpis, L. longipennis, L. squamiventris, L. termitophila, and L. whitmani) in these environments. This
phenomenon was previously observed in an entomological survey conducted in several counties along this road and railway line27. However, such adaptation has not yet been detected on the Amazonian (west) side, where ACL remains rural or peri-urban27,28.
Given the above fi ndings, it is presumed that the studied road and railway lines have increasingly been drawing populations from Maranhão and other states from different regions in the country. The northwest road and railway line receives migrants from Pará, Tocantins and other Amazon states, whereas the northeast road and railway line mainly receives migrants from the States of Piauí and Ceará but also from other northeastern States and Minas Gerais. Thus, these lines facilitate the transmission of ACL in the oldest settled areas, such as the area along road and railway Line I receiving a large population fl ow from the northeastern states, as well as areas settled more recently, including along access routes to the Amazon states and the central region of Brazil.
Nevertheless, the results of this study can be interpreted despite their limitations and potential biases. First, the incidence rates of ACL are based on secondary data, which may underestimate the true incidence due to underreporting. A second potential problem was the failure to consider socioeconomic and environmental indicators given the diffi culty of obtaining such data29.
To better understand the influence of roads on the epidemiological profi le of this disease, further research will be required to identify variables that can contribute resolving the complex factors contributing to disease transmission.
Road and railway corridors may play an important role in the spread of LTA by facilitating the movement of populations with varying risks of contracting the disease, thus infl uencing its epidemiology.
The data presented and discussed in this report allow us to conclude that although there was a decrease in the incidence of ACL over the study period, the risk of contracting the disease remains in all of the studied municipalities. Therefore, preventive measures implemented by the Unifi ed Health System should be directed towards the control of disease expansion.
REFERENCES
The authors declare that there is no confl ict of interest.
1. Organización Mundial de la Salud (OMS). Lucha contra las leishmaniasis. Ginebra: OMS; 1990.
2. Ministério da Saúde. Secretaria de Vigilância em Saúde [Internet]. Casos de Leishmaniose Tegumentar Americana. Brasil, Grandes Regiões e Unidades Federadas. 1990 a 2010. Brasília: MS/SVS [Cited 2011 March 23]. Available from: http://portal.saude.gov.br/portal/arquivos/pdf/lta_casos08_09_11.pdf
3. Instituto Brasileiro de Geografi a e Estatística (IBGE). Atlas do Maranhão.
Rio de Janeiro: IBGE; 1984.
4. Assunção RM, Reis I.A, Oliveira CDL. Diffusion and prediction of Leishmaniasis in a large metropolitan area in Brazil with a Bayesian space–time model. Stat Med 2001; 20:2319-2335.
5. Prado RR, Castilho EA. The aids epidemic in the State of São Paulo: application of the full Bayesian space-time model. Rev Soc Bras Med Trop 2009; 42:537-542.
6. Bernardinelli L, Clayton D, Montomoli C. Bayesian Estimates of Disease Maps: how important are priors? Stat Med 1995; 14:2411-2431. 7. Choi J, Lawson AB, Cai B, Hossain M. Evaluation of Bayesian
spatio-temporal latent models in small area health data. Environm 2011; 22:1008-1022.
8. Nobre AA, Schmidt AM, Lopes HF. Spatiotemporal models for mapping the incidence of malaria in Para. Environm 2005; 16:291-304.
9. Kato SK, Vieira DM, Fachel JMG. Utilization of fully Bayesian modeling to detect patterns in relative risk variation for infant mortality in Rio Grande do Sul State, Brazil. Cad Saúde Pública 2009; 25:1501-1510. 10. Spieglhalter DJ, Best NG, Carlin BP, Linde A. Bayesian measures of
model complexity and fi t. J Royal Stat Soc B 2002; 64:583-639.
11. Best NG, Arnold RA, Thomas A, Waller LA, Conlon EM. Bayesian models for spatially correlated disease and exposure data. In: Bernardo JM, Dawid JO, Berger AP, Smith AFM. Bayesian Statistics 6. Oxford Univ. Press 1999; p. 131-156.
12. Ketsall J, Wakefi eld J. Modeling Spatial Variation in Disease Risk:
a Geostatistical Approach. J Am Statist Ass 2002; 97:692-701.
13. Elmaiem DE, Schorscher J, Bendall A, Obsomer V, Osman ME, Mekkaawi AM, et al. Risk mapping of visceral leishmaniasis: the role of local variation in rainfall and altitude on the presence and incidence of kala-azar in eastern Sudan. Am J Trop Med Hyg 2003; 68:10-17.
14. Costa JML, Rebêlo JMM, Saldanha ACR, Balby IT, Gama MEA, Bezerril ACR, et al. Epidemiology of American Tegumentary Leishmaniasis (ATL) and perspectives of control in Maranhão, Brazil. Rev Hospital Universitário/UFMA 2005; 6:32-38.
15. Silva AR, Martins G, Melo JEM, Araújo JP, Mendes MG. Surto epidêmico de leishmaniose tegumentar americana na colonização agrícola de Buriticupu (MA), Brasil. Rev Inst Med Trop São Paulo 1979; 21: 45-50.
16. Oliveira-Pereira YN, Moraes JLP, Lorosa ES, Rebêlo JMM. Feeding
preference of sandflies in the Amazon, Maranhão State, Brazil. Cad Saúde
Pública 2008; 24:2183-2186.
17. Fonteles RS, Vasconcelos GC, Azevêdo PCB, Lopes GN, Moraes JLP, Lorosa ES, et al. Blood feeding preference of Lutzomyia whitmani (Diptera, Psychodidae) in an area of transmission of American cutaneous leishmaniasis in the State of Maranhão, Brazil. Rev Soc Bras Med Trop 2009; 42:647-650.
18. Rebêlo JMM, Rocha RV, Moraes JLP, Alves GA, Leonardo FS. Distribution of Lutzomyia whitmani in phytoregions of the state of Maranhão, Northeastern Brazil. Rev Saúde Pública 2009; 43:1070-1074. 19. Rebêlo JMM, Oliveira ST, Barros VLL, Silva FS, Costa JML, Ferreira
LA, et al. Sandfl ies (Diptera: Psychodidae) of Lagoas, municipal
district of Buriticupu, Amazonia of Maranhão. I - Richness and relative abundance of the species in area of recent colonization. Rev Soc Bras Med Trop 2000; 33:11-19.
20. Rebêlo JMM, Oliveira ST, Barros VLL, Silva FS. Phlebothominae of Amazon of Maranhão IV – Richness and relative abundance of species in an area of ancient settlement. Entomol & Vec 2000; 7:61-72.
21. Instituto Brasileiro de Geografi a e Estatística (IBGE) [Internet].
Cartografi a. Rio de Janeiro: IBGE; 2010. [Cited 2010 July 5]. Available from: http://www.ibge.gov.br/home/geociencias/cartografi a/default_geog_
int.shtm?c=6.
22. Rebêlo JMM, Rocha RV, Moraes JLP, Silva CRM, Leonardo FS, Alves GA. The fauna of phlebotomines (Diptera, Psychodidae) in different phytogeographic regions of the state of Maranhão, Brazil. Rev Bras Entomol 2010; 54:494-500.
23. Oliveira-Pereira YN, Rebêlo JMM, Moraes JLP, Pereira SRF. Molecular diagnosis of the natural infection rate due to Leishmania sp in sandfl ies (Psychodidae, Lutzomyia) in the Amazon region of Maranhão, Brazil. Rev Soc Bras Med Trop 2006; 39:540-543.
24. Costa JML. Estudo clínico-epidemiológico de um surto epidêmico de leishmaniose tegumentar americana em Corte de Pedra, Bahia. [Masters Thesis]. [Brasília]: Universidade Nacional de Brasília; 1986.
25. Marzochi KBF, Marzochi MCA, Silva AF, Grativol N, Duarte R, Confort EM, et al. Phase 1 Study of an Inactivated Vaccine against American Tegumentary Leishmaniasis in Normal Volunteers in Brazil. Mem Inst Osw Cruz 1998; 93:205-212.
26. Silva MH, Nascimento MDSB, Leonardo FS, Rebêlo JMM, Pereira SRF. Genetic Differentiation in Natural Populations of Lutzomyia longipalpis (Lutz & Neiva) (Diptera: Psychodidae) with Different Phenotypic Spot Patterns on tergites in Males. Neotrop Entomol 2011; 40:501-506. 27. Rebêlo JMM, Leonardo FL, Costa JML, Pereira YNO, Silva FS.
Phlebothominae (Diptera, Psychodidae) of an endemic area of leishmaniasis in the region of cerrados, State of Maranhão, Brazil. Cad Saude Publica 1999; 15:623-630.
28. Costa JML, Saldanha ACR, Melo E, Silva AC, Serra-Neto A, Galvão CES, et al. Estado atual da leishmaniose cutânea difusa (LCD) no Maranhão. Rev Soc Bras Med Trop 1992; 25:115-123.
29. Randremanana RV, Richard V, Rakotomanana F, Sabatier P, Bicout DJ. Bayesian mapping of pulmonary tuberculosis in Antananarivo, Madagascar. BMC Infect Dis 2010; 10:21.