c.G2114A
MYH9
mutation (DFNA17) causes non-syndromic autosomal
dominant hearing loss in a Brazilian family
Vitor G.L. Dantas
1, Karina Lezirovitz
1,2, Guilherme L. Yamamoto
1, Carolina Fischinger Moura de Souza
3,
Simone Gomes Ferreira
1and Regina C. Mingroni-Netto
11
Departamento de Genetica e Biologia Evolutiva, Instituto de Biociências, Instituto de Biociências,
Universidade de São Paulo, São Paulo, SP, Brazil.
2
Laboratório de Otorrinolaringologia/LIM32, Hospital das Clinicas, Faculdade de Medicina,
Universidade de São Paulo, São Paulo, SP, Brazil.
3
Serviço de Genética Médica, Hospital de Clínicas de Porto Alegre, Porto Alegre, RS, Brazil.
Abstract
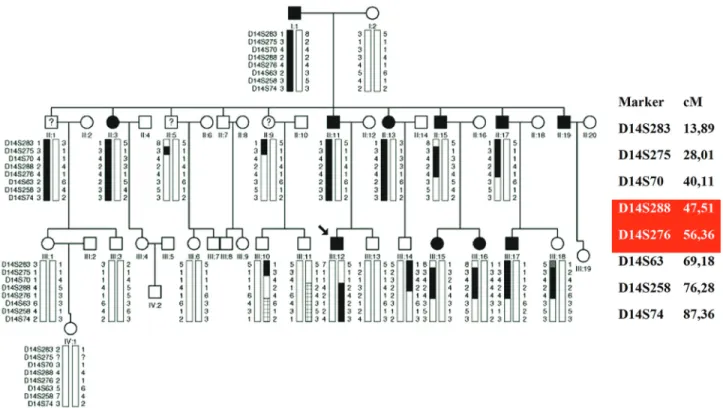
We studied a family presenting 10 individuals affected by autosomal dominant deafness in all frequencies and three individuals affected by high frequency hearing loss. Genomic scanning using the 50k Affymetrix microarray technol-ogy yielded a Lod Score of 2.1 in chromosome 14 and a Lod Score of 1.9 in chromosome 22. Mapping refinement us-ing microsatellites placed the chromosome 14 candidate region between markers D14S288 and D14S276 (8.85 cM) and the chromosome 22 near marker D22S283. Exome sequencing identified two candidate variants to explain hear-ing loss in chromosome 14 [PTGDR – c.G894A:p.R298R and PTGER2 – c.T247G:p.C83G], and one in chromosome 22 [MYH9, c.G2114A:p.R705H]. Pedigree segregation analysis allowed exclusion of the PTGDR and PTGER2 vari-ants as the cause of deafness. However, theMYH9 variant segregated with the phenotype in all affected members, except the three individuals with different phenotype. This gene has been previously described as mutated in autosomal dominant hereditary hearing loss and corresponds to DFNA17. The mutation identified in our study is the same described in the prior report. Thus, although linkage studies suggested a candidate gene in chromosome 14, we concluded that the mutation in chromosome 22 better explains the hearing loss phenotype in the Brazilian family.
Keywords: DFNA17,MYH9gene, Hearing loss. Received: June 3, 2014; Accepted: July 28, 2014.
Introduction
According to the World Health Organization (WHO) almost 360 million people of all ages around the world have disabling hearing loss. Hearing loss can be caused by envi-ronmental factors, by genetic factors, or both. Hereditary hearing loss exhibits enormous heterogeneity of inheri-tance mechanisms, of chromosomal loci and of alleles in the same locus. Almost 70% of hereditary hearing loss cases do not display syndromic features (Keats and Berlin, 1999) and are thus called nonsyndromic. On the other hand, 30%, of cases are associated to syndromic features. About 80% of nonsyndromic hereditary hearing loss is due to autosomal recessive mechanisms (The Connexin Deafness Homepage), the autosomal dominant mechanism corre-sponds to 10-20% (Guilfordet al., 1994), X-linked
inheri-tance corresponds to 2-3% of the genetic cases of hearing
loss (Van Campet al., 1997) and the contribution of
mater-nal inheritance was estimated to be near 1%. To date, about 170 loci have been mapped for nonsyndromic hearing loss and different types of mutations in 75 identified genes have been found in humans (http://hereditaryhearingloss.org/). Regarding autosomal dominant hearing loss, about 55 loci have been mapped and 29 genes have been identified.
Here we report linkage studies and mutation identifi-cation after massive parallel sequencing of the whole exo-me in a large Brazilian pedigree with autosomal dominant hearing loss.
Materials and Methods
Patients
This study was approved by the Comissão Nacional de Ética em Pesquisa (CONEP; Process number 25000.143724/2003-29). After written informed consent, samples from 10 individuals affected by postlingual pro-gressive hearing loss in all frequencies, 10 unaffected indi-viduals and three indiindi-viduals affected by high frequency www.sbg.org.br
Send correspondence to Regina Célia Mingroni Netto. Depar-tamento de Genetica e Biologia Evolutiva, Instituto de Biociências, Universidade de São Paulo, Rua do Matão, trav. 14, n 321, Cidade Universitária, 05508-090 São Paulo, SP, Brazil. E-mail: [email protected].
hearing loss from the same family were obtained (Figure 1). The family was ascertained in the city of Porto Alegre, RS, in southern Brazil. Audiological evaluation of the affected patients was conducted by different professionals and insti-tutions.
DNA extraction
DNA was extracted from peripheral blood lympho-cytes using commercial kits.
Linkage analysis
Genomic scanning was performed using the Affymetrix technologies SNP array 50k and analyzed with the softwares Genechip 3000 Scanner and GeneChip Com-mand Console Software (Affymetrix, Santa Clara, CA, USA).Fluorescent-labeled microsatellites were analyzed in an Applied Biosystems 3730 DNA analyzer with the help of the software GeneMapper 4.0 (Applied Biosystems, Foster City, CA, USA) for genetic mapping refinement.
Lod score calculations
Merlin software (Abecasiset al., 2002) was used to
calculate multiple point Lod scores for each autosome. The disease allele frequency was 0.0001 and allelic frequencies were calculated considering the genotype of the individuals from the family. Penetrance was assumed to be complete.
Array – CGH (Comparative Genomic Hybridization)
Array-CGH was performed in the index patient using a platform from Agilent Technologies (Agilent Technol-ogies, Santa Clara, CA, USA) containing 180.000 oligo-nucleotides, as described by the manufacturer. Data were analyzed with Feature Extraction software and Genomic Workbench software (Agilent Technologies, Santa Clara, CA, USA). Gains and losses of genomic sequences were called using an aberration detection statistical algorithm ADM-2, with a sensitivity threshold of 6.7.
Massive parallel sequencing
DNA samples from three affected individuals were submitted to whole exome sequencing at Laboratório de Biotecnologia Animal (ESALQ-USP, Piracicaba, SP, Bra-zil). Libraries were prepared with an Illumina TruSeq li-brary preparation kit (Illumina INC., San Diego, CA, USA.) Sequence capture was performed with Illumina Exome enrichment kit (~62 Mb target size). Sequencing was performed with an Illumina HiSeq system with aver-age read depths of 120x.
Fastq files were aligned to the human reference se-quence (hg19) with BWA (Burrows-Wheeler Aligner; Li and Durbin, 2010) for the generation of the BAM files (Bi-nary Alignment Map). Realignment of indel regions, vari-ant detection and recalibration of base qualities were performed with BWA for the production of VCF files (Variant Call Format). Annotation was performed with
Annovar (Wang et al., 2010). Variant frequencies were
compared to the 1000 genomes and ESP6500 databases. PolyPhen2 (Adzhubeiet al., 2010), SIFT (Kumar et al.,
2009) and Mutationtaster (Schwarzet al., 2014) were used
forin silicodamage prediction to the protein.
PTGDR,PTGER2andMYH9exon analyses by Sanger sequencing
Primers for amplification of the exons of three candi-date genes were designed with Primer3. PCR fragments were purified and directly sequenced in both strands using the ABI BigDye Terminator v3.1 Cycle Sequencing Kit and the ABI 3730 DNA Analyzer (Applied Biosystems, Foster City, CA, USA).
Results
Clinical findings
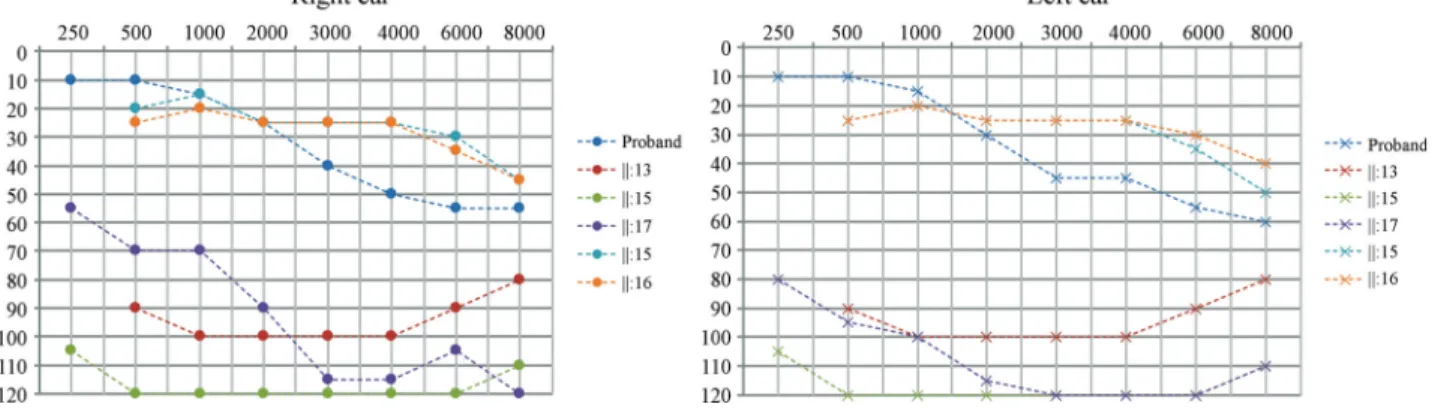
Hearing loss in this family can be described as pro-gressive, bilateral, affecting all frequencies, with age of on-set ranging from 1stto 5thdecade of life. Figure 2 presents
the audiogram of six affected individuals, with ages rang-ing from four to 43 years. Three affected individuals (II:1, II:5 and II:9) presented a distinct phenotype, since the age of onset was near 40 and hearing loss affects only high fre-quencies (audiogram shown in Figure 3) .
Genetic mapping
Genomic scanning was performed with samples of seven affected individuals (proband, I:1, II:13, II:15, II:17, III:15, III:17); the three individuals with a distinct pheno-type were not included. Data from SNP arrays were used in Lod score calculations. A Lod score peak of 2.1 at some 14 and a Lod score peak of 1.9 in a region at chromo-some 22 were obtained.
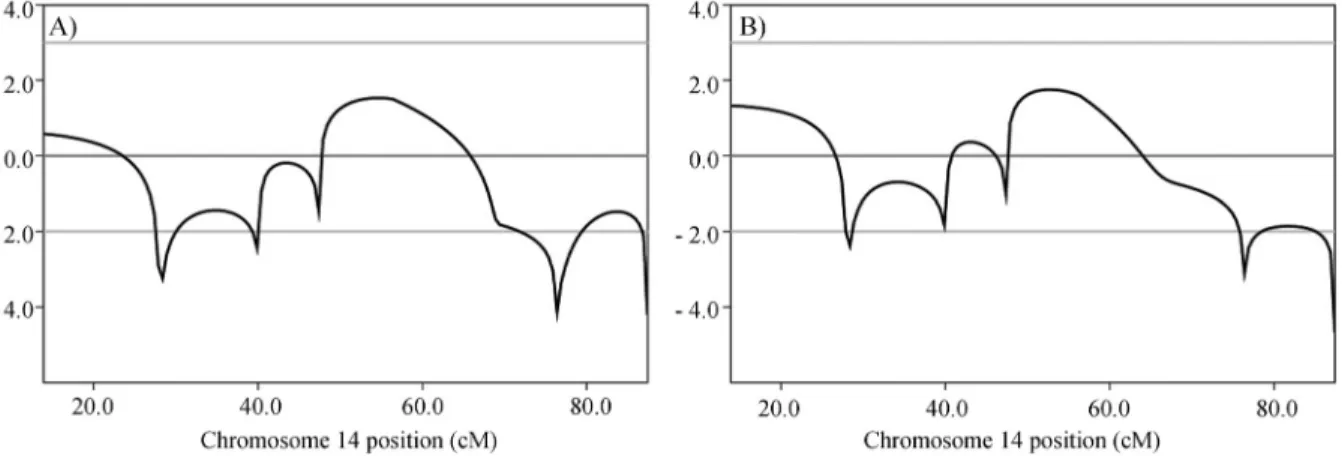
Using microsatellite data (Figure 3) obtained from 23 samples (10 affected individuals, 10 unaffected ones and the three individuals with a different phenotypic presenta-tion considered as affected), a peak Lod score of 1.8 (Fig-ure 4) was calculated for chromosome 14. In a second Lod
score calculation, these three individuals were considered as unaffected and a peak Lod score of 1.5 was obtained.
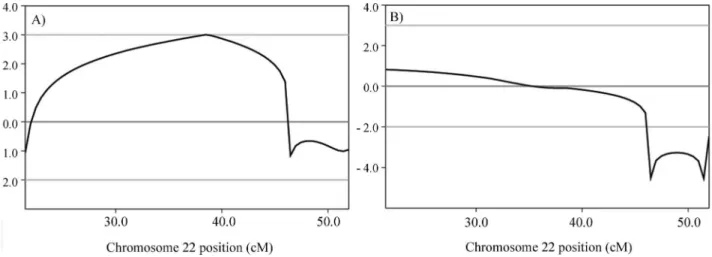
Regarding chromosome 22, the analysis using micro-satellite data (Figure 5) from 23 samples (10 affected indi-viduals, 10 unaffected ones and the three individuals with different phenotypic presentation considered as affected) revealed a Lod score of 0.8 (Figure 6). When these three in-dividuals were considered as unaffected, a peak Lod score of 3.0 was obtained (Figure 6). A simulation of maximum possible Lod score in the pedigree was performed using Merlin, including the same set of samples, this resulting in a Lod score value of 4.2.
Array-CGH
A DNA sample from one affected individual (proband) was analyzed by Array-CGH and no pathogenic copy-number variation was detected.
Massive parallel sequencing
A total of 80.200.676 reads of 99pb each were gener-ated, presenting an average coverage of 124x. All variants that were present in heterozygosis in the samples from the three affected individuals submitted to whole exome se-quencing and that were not detected in the 17 control sam-ples sequenced by the same method (controls from our own research center) were screened for quality and checked against the1000 genomespublic variant database and the
6500 exomes from Washington University. Only variants observed with frequencies lower than 1% and located in the mapped regions were selected for the study. Within the mapped chromosomal interval in chromosome 14, (D14S288 to D14S276), two missense variants (not de-scribed in 1000 genomes) within two genes PTGDR
(c.G894A: p.R298R, position 52,741,496; NM_000953) and PTGER2 (c.T247G: p.C83G, position 52,781,513;
NM_000956) were found. One variant within theMYH9
gene (c.G2114A:p.R705H, position 36,702,021; NM_002473) in the candidate chromosome 22 region was found (linked to D22S283). Polyphen2 predictions indi-cated a probability of being damaging of 1% for c.G894A
Figure 3- Tonal audiometry showing thresholds for II-V, who presented hearing loss only in high frequencies and with onset near the age of 40.
Figure 4- Multipoint Lod Scores (on the Y-axis) obtained with microsatellite data for chromosome 14. A) Individuals marked with ? in Figure 1 were considered unaffected in this calculation; B) Individuals marked with ? in Figure 1 were considered affected by the same genetic disorder in this calcula-tion.
inPTGDR, 100% for c.T247G inPTGER2and 100% for c.G2114A inMYH9.
The three variants were, thus, selected for segregation studies. All 23 samples from the pedigree were screened by Sanger sequencing for the presence of the variants c.G894A, c.T247G and c.G2114A. The variants inPTGDR
andPTGER2genes did not segregate with the phenotype,
but the variant in theMYH9gene did so. The three
individu-als with the different phenotypic presentation carried the
PTGDRandPTGER2variants, but theMYH9variant was
not detected in any of their samples.
Discussion
At first, we considered the Lod score peak at chromo-some 14, which had the highest value, as indicative of the location of the gene. There are three DFNAs (autosomal dominant hearing loss loci) already mapped to different re-gions in chromosome 14. DFNA9 is located at chromo-somal region 14:31,343,740-31,359,821 and it was mapped by Manoliset al.(1996). Later on, Robertsonet al.(1998)
studied three different families affected by autosomal dom-inant hearing loss which mapped to DFNA9, and they found theCOCHgene to be associated with hearing loss.
DFNA53 is located at chromosomal region 14:19,100,000-33,300,000 and it was mapped by Yanet al.
(2006). The DFNA53 locus overlaps with DFNA9, but since the authors were not able to find mutations in the
COCHgene, the locus was considered distinct from DFNA
9. DFNA23 is located in chromosomal region 14: 61,110,132-61,124,977 and it was mapped by Salamet al.
(2000), but the respective gene remains unknown. None of the three loci overlaps with the region at chromosome 14 mapped in our study, which made us suspect that a new lo-cus was mapped. However, after segregation studies were performed with the variants identified after massive paral-lel exome sequencing, we came to the conclusion that the
mutation that best explains the phenotype lies, in fact, in chromosome 22, in theMYH9gene, which corresponds to DFNA17. This variant is not present in the three individuals with the distinct phenotype, who were, thus, considered to be either phenocopies or affected by another type of genetic hearing loss.
The locus DFNA17 in chromosome 22 has been mapped by Lalwaniet al.(1999), who described a pedigree
from a US family with 18 individuals affected by auto-somal dominant hearing loss. Age of onset of the hearing loss was near 10 years. It started at high frequencies, be-coming moderate to profound near the age of 30 years. Lalwaniet al.(2000) investigated all genes in the DFNA17
locus by Sanger sequencing and identifiedMYH9as a novel
deafness gene. The variant c.G2114A (rs80338828), found by Lawlaniet al.(2000), is the same variant we found in our
study.MYH9 is a myosin that functions in actin bundles
motility (Wilsonet al., 2010). Hildebrandet al.(2006)
in-vestigated an Australian family presenting autosomal dom-inant hearing loss, and they found the same variant. The onset of hearing loss in this family was around the age of six, becoming severe to profound in the second or third de-cade of life. The clinical presentation observed in the fam-ily investigated by us is similar to the phenotype found in the two previously studied families, except that many of our patients noticed their hearing impairment around 20 years of age.
It is intriguing that a strong suggestion of linkage was also found in chromosome 14 in the first analysis, using SNP data only. But after microsatellite linkage studies with more individuals and considering II:1, II:5 and II:9 as unaf-fected, we realized that the evidence of linkage to chromo-some 22 was stronger. It is worthy of note that the variants detected in the genesPTGDRandPTGER2were found in
the three individuals with different phenotypic presenta-tion, and they all share a small region on chromosome 14. It is tempting to speculate that there could be other genetic
features in chromosome 14 which could explain the hearing loss with a less severe phenotype in these individuals. Some affected individuals in the pedigree inherited both candi-date haplotypes (in chromosome 14 and 22), but there are no significant differences in their phenotypes when com-pared to individuals who inherited only theMYH9
muta-tion. In fact, a particular allele for D14S275 marker was inherited by the three individuals with atypical phenotype and by nine individuals affected by severe hearing loss, which may have contributed to the high Lod score value ob-tained for chromosome 14 in this family.
Since the pedigree investigated by us is the third re-port of variant rs80338828 in theMYH9gene being
associ-ated to autosomal dominant hearing loss, we came to the conclusion that this is the most likely cause of the hearing loss, although a secondary effect of genetic factors lying in chromosome 14 can not be completely ruled out.
Acknowledgments
We thank Dr. Erika Freitas and Dr. Carla Rosenberg for performing the array-CGH studies. We also thank Maria Teresa Balester de Mello Auricchio for technical as-sistance. We thank the Laboratório Multiusuários Centra-lizado de Genômica Funcional Aplicada à Agropecuária e Agroenergia – EASALQ-USP Piracicaba-SP-Brasil for providing the sequencing facilities. We thank CEPID -FAPESP and CAPES for financial support.
References
Abecasis GR, Cherny SS, Cookson WO and Cardon LR (2002) Merlin-rapid analysis of dense genetic maps using sparse gene flow trees. Nat Genet 30:97-101.
Adzhubei IA, Schmidt S, Peshkin L, Ramensky VE, Gerasimova A, Bork P, Kondrashov AS and Sunyaev SR (2010) A method and server for predicting damaging missense muta-tions. Nat Methods 7:248-249.
Guilford PS, Ben Arab S, Blanchard S, Levilliers J, Weissenbach J, Belkahia A and Petit C (1994) A non-syndrome form of neurosensory, recessive deafness maps to the peri-centromeric region of chromosome 13q. Nat Genet 6:24-28. Hildebrand MS, Silva MG, Gardner RJ, Rose E, de Graaf CA,
Bahlo M and Dahl HH (2006) Cochlear implants for DFNA17 deafness. Laryngoscope 116:2211-2215. Keats BJ and Berlin CI (1999) Genomics and hearing impairment.
Genome Res 9:7-16.
Kumar P, Henikoff S and Ng PC (2009) Predicting the effects of coding non-synonymous variants on protein function using the SIFT algorithm. Nat Protoc 4:1073-1081.
Lalwani AK, Luxford WM, Mhatre AN, Attaie A, Wilcox ER and Castelein CM (1999) A new locus for nonsyndromic heredi-tary hearing impairment, DFNA17, maps to chromosome 22 and represents a gene for cochleosaccular degeneration. Am J Hum Genet 64:318-323.
Lalwani AK, Goldstein JA, Kelley MJ, Luxford WM, Castelein CM and Mhatre AN (2000) Human nonsyndromic heredi-tary deafness DFNA17 is due to a mutation in nonmuscle myosin MYH9. Am J Hum Genet 67:1121-1128.
Li H and Durbin R (2010) Fast and accurate long-read alignment with Burrows-Wheeler Transform. Bioinformatics 26:589-595.
Manolis EN, Yandavi N, Nadol Jr JB, Eavey RD, McKenna M, Rosenbaum S, Khetarpal U, Halpin C, Merchant SN, Duyk GM, et al.(1996) A gene for non-syndromic autosomal dominant progressive postlingual sensorineural hearing loss maps to chromosome 14q12-13. Hum Mol Genet 5:1047-1050.
Robertson NG, Lu L, Heller S, Merchant SN, Eavey RD, McKenna M, Nadol Jr JB, Miyamoto RT, Linthicum Jr FH, Lubianca Neto JF,et al.(1998) Mutations in a novel co-chlear gene cause DFNA9, a human nonsyndromic deafness with vestibular dysfunction. Nat Genet 20:299-303. Salam AA, Hafner FM, Linder TE, Spillmann T, Schinzel AA and
Leal SM (2000) A novel locus (DFNA23) for prelingual autosomal dominant nonsyndromic hearing loss maps to 14q21-q22 in a Swiss German kindred. Am J Hum Genet 66:1984-1988.
Schwarz JM, Cooper DN, Schuelke M and Seelow D (2014) MutationTaster2: Mutation prediction for the deep-sequencing age. Nat Methods Apr 11:361-362.
Van Camp G, Willems PJ and Smith RJ (1997) Nonsyndromic hearing impairment: Unparalleled heterogeneity. Am J Hum Genet 60:758-764.
Wang K, Li M and Hakonarson H (2010) ANNOVAR: Functional annotation of genetic variants from next-generation sequen-cing data. Nucleic Acids Research 38:e164.
Wilson CA, Tsuchida MA, Allen GM, Barnhart EL, Applegate KT, Yam PT, Ji L, Keren K, Danuser G and Theriot JA (2010) Myosin II contributes to cell-scale actin network treadmilling through network disassembly. Nature 465:373-377.
Yan D, Ke X, Blanton SH, Ouyang XM, Pandya A, Du LL, Nance WE and Liu XZ (2006) A novel locus for autosomal domi-nant non-syndromic deafness, DFNA53, maps to chromo-some 14q11.2-q12. J Med Genet 43:170-174.
Internet Resources
Primer3 software, http://bioinfo.ut.ee/primer3-0.4.0/ (accessed march 2013).
1000 genomes public variant database, http://www.1000genomes.org/ (accessed july 2013). The Connexin Deafness homepage ,
http://davinci.crg.es/deaf-ness/, (acessed april 2014).
The 6500 exomes database from Washington University, http://evs.gs.washington.edu/EVS/ (accessed july 2013).
Associate Editor: Mara H. Hutz