APPLICATIONS OF IMAGE ANALYSIS IN THE CHARACTERIZATION OF
STREPTOMYCES OLINDENSIS IN SUBMERGED CULTURE
Celso R. Denser Pamboukian; Luciana M. Guimarães; Maria Cândida R. Facciotti*
Escola Politécnica da Universidade de São Paulo, Departamento de Engenharia Química, São Paulo, SP, Brasil
Submitted: December 15, 2000; Returned to authors for corrections: May 02, 2001; Approved: February 25, 2002
ABSTRACT
The morphology of Streptomyces olindensis (producer of retamycin, an antitumor antibiotic) grown in submerged culture was assessed by image analysis. The morphology was differentiated into four classes: pellets, clumps (or entangled filaments), branched and unbranched free filaments. Four morphological parameters were initially considered (area, convex area, perimeter, and convex perimeter) but only two parameters (perimeter and convex perimeter) were chosen to automatically classify the cells into the four morphological classes, using histogram analysis. Each morphological class was evaluated during growth carried out in liquid media in fermenter or shaker. It was found that pellets and clumps dominated in early growth stages in fermenter (due to the inoculum coming from a shaker cultivation) and that during cultivation, the breakage of pellets and clumps caused an increase in the percentage of free filaments. The criteria of morphological classification by image analysis proposed were useful to quantify the percentage of each morphological class during fermentations and may help to establish correlations between antibiotic production and microorganism morphology.
Key words: Streptomyces olindensis, image analysis, morphology
INTRODUCTION
Filamentous microorganisms such as Actinomycetales and filamentous fungi are used in several industrial fermentations. In particular, Streptomyces spp. are very important in antibiotic production. In these processes, microorganism morphology is strongly related to the production of metabolites (7,10,11), influencing the rheological properties of the fermentation broth (5), which can cause problems in mixing and mass transfer.
Despite of this importance, little quantitative work to evaluate the morphology of filamentous microorganisms in a systematic way has been published until recent years. With the development of automated image analysis techniques, in the 1990’s, a considerable quantity of information about microorganism morphology has been obtained, with faster and more accurate results than the ones obtained with the earlier time-consuming manual methods, consisting in measurements from photographs
* Corresponding author. Mailing address: Escola Politécnica da USP, Departamento de Engenharia Química, Caixa Postal 61548, 05424-970, São Paulo, SP, Brasil. Fax: (+5511) 3031-3020. E-mail: [email protected]
(1,3,10). Nowadays, image analysis is a very useful technique to assess morphology during cultivations.
Image analysis is the obtention of information (measurements) from an image by a computer in a reproducible and semi-automated or automated manner. The main advantages of image analysis are that repetitive measurements can be automated and measurements can be made accurately, reproducibly, and more quickly than manual methods based on human observations (6,8).
MATERIALS AND METHODS
Microorganism
The strain of Streptomyces olindensis was obtained from Laboratório de Genética de Microrganismos/Instituto de Ciências Biomédicas/Universidade de São Paulo. The cells were stored in tubes containing glycerol 20% v/v, at – 20ºC (4).
Culture medium
The medium for the cultivations contained the following nutrients (4): glucose (10.0 g/L), yeast extract (5.0 g/L), tris(hydroxymethyl)-aminometan (3.09 g/L), casein hydrolysate (0.10 g/L), K2SO4 (0.25 g/L), and MgCl2.6H2O (10.12 g/L). The pH was adjusted in 7.0. After medium sterilization, the following sterile solutions were added (for 250 mL of culture medium): KH2PO4 0.5 % w/v (2.5 mL), CaCl2 5M (1.0 mL), and 0.5 mL of a trace elements solution (40 mg ZnCl2, 200 mg FeCl3.6H2O, 10 mg (NH4)6Mo7O24.4H20, 10 mg CuCl2.2H2O, 10 mg MnCl2.4H2O, 10 mg Na2B4O7.10H2O in 1000 mL of distilled water).
Culture conditions
One batch run was performed in a 15-L Biolafitte fermenter (run R-1) under the following conditions: working volume = 10 L; agitation rate = 500 rev/min; air flow rate = 10 L/min; internal pressure = 1.2 atm; pH = 7.0 and temperature = 30ºC. The fermenter was provided with three flat blade turbine disk impellers, with four blades each. Another run (R-2) was performed in a New Brunswick rotary shaker at 200 rev/min and 30ºC.
Inoculum preparation
The inoculum for the fermenter run (R-1) was prepared in a New Brunswick rotary shaker at 200 rev/min and 30ºC for 24 hours. In run R-2, shaker flasks were inoculated with the stock cell suspension (4).
Methodology
Samples collected periodically from the fermenter were evaluated for dry mass (X) after vacuum filtration and drying (4), glucose concentration (S) by glucose-oxidase method (4) and morphology by image analysis.
Image analysis
A LEICA Q500MC Image Analyser, attached to an Olympus BX60 optical microscope, was used. The images were acquired with a JVC TK1280U CCD camera. The microscope images were recorded with a resolution of 640 x 512 pixels and 256 grey values. The grey image was corrected using erosion and dilation, before binarization. The image was then segmented by two thresholds to obtain a binary image. In the segmentation process, pixels which have a grey scale between the two thresholds are picked out and the others are eliminated, to form
the binary image (12). After binarization, the binary image was corrected using erosion, dilation, skeletonization and pruning. Skeletonization and pruning were useful to obtain the number of tips of the hyphal elements.
Sample preparation
Samples from the culture broth were diluted 5- to 20-fold with distilled water. A 20-µm aliquot of the diluted sample was pipetted onto a slide glass, dried and fixed over a Bunsen flame, and stained with methylene blue (0.3 g methylene blue, 30 mL 95% ethyl alcohol, in 100 mL distilled water) (1,12). For each sample, 5 slides were prepared.
For each sample, more than 100 features were characterized by area, convex area, perimeter, and convex perimeter measurements. Convex area is that area bounded by the convex perimeter, in which concavities in the feature boundary have been infilled.
RESULTS AND DISCUSSION
A series of experimental runs (data not shown) were utilized for the proposition of a criterion to classify the features into the four morphological classes in an automated way, based on microorganism dimensions. The set of results was composed by 2110 features (940 free filaments (branched and unbranched), 641 clumps, and 529 pellets). The data were analyzed by means of frequency histograms (Figs. 1 and 2).
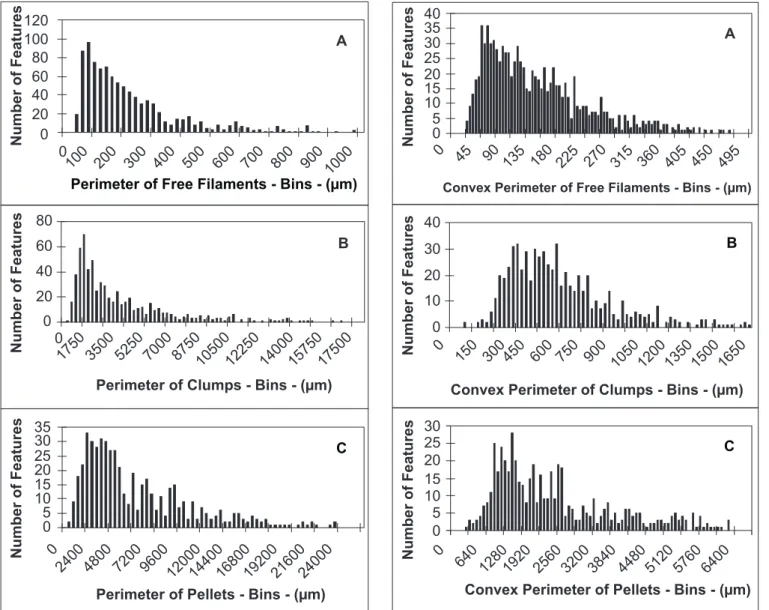
Fig. 1 shows the histograms of perimeter. From Fig. 1A, it can be calculated that 95% of free filaments had perimeter between 40 and 600 µm, while from Fig. 1B and 1C, that only 3% of clumps and 1% of pellets presented perimeter in this range. Thus, perimeter is a good criterion to identify free filaments. The criterion to distinguish branched from unbranched filaments is the number of tips. However, also from Figs. 1B and 1C, it can be calculated that 95% of clumps and 80% of pellets presented perimeter between 600 and 10,000 µm. So, perimeter is not a good criterion to distinguish pellets from clumps.
Similarly, Fig. 2 shows the histograms of convex perimeter. From Figs. 2A and 2B, it can be calculated that 93% of free filaments and 10% of clumps presented convex perimeter between 20 and 300 µm. So, convex perimeter is not a good criterion to distinguish free filaments from clumps, as the perimeter criterion. However, from Figs. 2B and 2C, 90% of clumps presented convex perimeter between 100 and 950 µm and 90% of pellets presented convex perimeter between 950 and 7,200 µm. Thus, convex perimeter is a good criterion to distinguish clumps from pellets.
did not allow the establishment of any classification criterion for the microorganism morphology.
To illustrate the applicability of these criteria, the morphology during two fermentation runs (in fermenter and in shaker) was assessed, in order to compare the evolution of morphology and pellet disruption in two very different shear conditions.
Fig. 4A shows the time course of morphology in run R-1, carried out in fermenter, with the percentage of each morphological class, assigned by image analysis. From this figure, it can be observed that pellets dominated in the beginning of fermentation (about 70%), because the inoculum contained a high quantity of pellets, provenient from a shaker culture. During growth phase (0 to 20 hours), pellet percentage decreased while
free filaments (branched and unbranched) percentage increased, as a consequence of severe shear conditions in fermenter, which cause pellet and clump disruption, forming free filaments. Clumps percentage did not vary significantly during fermentation. Fig. 4B shows biomass and glucose profiles during fermentation, in run R-1. Biomass reached a maximum of about 5.5 g/L after 20 hours of cultivation and carbon source exhausted after about 24 hours of cultivation.
In run R-2, carried out in shaker, there was mainly pellets and clumps in the beginning of cultivation, with a significant smaller percentage of free filaments. Only after about 24 hours of cultivation, the percentage of free filaments started increasing. Pellet and clump disruption was indeed faster in fermenter
Figure 2. Histograms of convex perimeter for each morphological class of Streptomycesolindensis grown in submerged cultures. (A) Free filaments; (B) Clumps; (C) Pellets.
Figure 1. Histograms of perimeter for each morphological class of Streptomycesolindensis grown in submerged cultures. (A) Free filaments; (B) Clumps; (C) Pellets.
0 100 1000 900 800 700 600 500 400 300 200 100
Perimeter of Free Filaments - Bins - (µm) A Number of Features 120 80 60 40 20 0
Perimeter of Clumps - Bins - (µm)
Number of Features 17500 15750 14000 12250 10500 8750 7000 5250 3500 0 20 40 60 80 B 0 1750 35 30 25 20 15 10 5 0 0 24000 21600 19200 16800 14400 12000 9600 7200 4800 2400
Perimeter of Pellets - Bins - (µm)
Number of Features C 5 20 30 0 6400 5760 5120 4480 3840 3200 2560 1920 1280 640 25 10 15 0 30 10 20 40 0 0 1650 1500 1350 1200 1050 900 750 600 450 300 150 35 30 10 15 20 25 40 495 0 450 405 360 315 270 225 180 135 90 45 A C
Convex Perimeter of Free Filaments - Bins - (µm)
5 0 Number of Features Number of Features
Convex Perimeter of Clumps - Bins - (µm) B
Number
of
Features
after 24 hours of cultivation. From 24 hours of cultivation up to the end of run R-2, biomass did not vary significantly but the morphology changed markedly, with pellet disruption and significant formation of free filaments. Carbon source exhausted after 44 hours of cultivation.
It should be emphasized that the results of these two runs are only examples of how the morphology can vary along the fermentation course, and that it is strictly related to the shear conditions during cultivation. Hence, very distinct morphological behaviors should be expected when different culture conditions are established.
From the results presented in this work, it can be concluded that the criteria of morphological classification by image analysis proposed here are suitable to quantify the percentage of each morphological class during fermentations. Image analysis showed to be a powerful tool to quantify morphology during filamentous microorganism cultivations and the criteria established will be very useful in future studies, with the main objective of correlating both antibiotic production and microorganism morphology.
ACKNOWLEDGEMENTS
The authors would like to thank FAPESP and PADCT/ CNPq for the financial support.
Figure 3. Morphological classes of Streptomyces olindensis grown in submerged cultures and the main characteristics of each class.
2
40 50 30
10 20 0
Time (h) 12
10 8 6 4
0
40 50 30
10 20 0
100 80 60 40 20
0
Time (h) Pellets Clumps
Branched Free Filaments Unbranched Free Filaments
A
B
S (g/L) X (g/L)
Morphology
(%)
X,
S
(g/L)
Figure 4. (A) Percentage of each morphological class of Streptomyces olindensis during run R-1, in fermenter; (B) Biomass and glucose profiles during Streptomycesolindensis cultivation in run R-1, in fermenter.
cultivation than in shaker cultivation, because of the very different shear conditions; in fermenter, there are higher shear stress conditions due to the mechanical stirrer, that causes pellet and clump breakage. At the end of the shaker cultivation, there was about 60% of free filaments, as shown in Fig. 5A. Fig. 5B shows biomass and glucose profiles during fermentation, in run R-2. The maximum biomass concentration was about 4.3 g/L,
Pellets Clumps
Branched Free Filaments Unbranched Free Filaments
S (g/L) X (g/L)
20 100 80 60
40
0
60 40
20 80
0
A
B Time (h)
Morphology
(%)
X,
S
(g/L)
Time (h)
60 40
20 80
0 2 10 8 6
4
0
Figure 5. (A) Percentage of each morphological class of Streptomycesolindensis during run R-2, in rotary shaker; (B) Biomass and glucose profiles during Streptomycesolindensis cultivation in run R-2, in rotary shaker.
Unbranched free filament
Branched free filament
Clump
(Entangled filament)
Pellet
40 m < perimeter 600 m Number of tips = 2
µ ≤ µ
40 m < perimeter 600 m Number of tips > 2
µ ≤ µ
600 m < perimeter < 12,000 m
100 m < convex perimeter 950 m
µ µ µ
µ ≤
950 m < convex perimeter < 7,200 m
REFERENCES
1. Adams, H.L.; Thomas, C.R. The use of image analysis for morphological measurements on filamentous microorganisms. Biotechnol. Bioeng., 32: 707-712, 1988.
2. Bieber, L.W.; Silva Filho, A.A.; Silva, E.C.; Mello, J.F.; Lyra, F.D.A. The anthracyclinic complex retamycin, 1. Structure determination of the major constituents. J. Nat. Prod., 52: 385-388, 1989. 3. Cox, P.W.; Paul, G.C.; Thomas, C.R. Image analysis of the morphology
of filamentous microorganisms. Microbiol., 144: 817-827, 1998. 4. Guimarães, L.M. Influência do preparo do inóculo e do pH na
produção do antibiótico retamicina por Streptomyces olindensis So20. São Paulo, 2000, 122p. (Master Thesis. Escola Politécnica. Universidade de São Paulo).
5. Olsvik, E.; Tucker, K.G.; Thomas, C.R.; Kristiansen, B. Correlation of Aspergillus niger broth rheological properties with biomass concentration and the shape of mycelial aggregates. Biotechnol. Bioeng., 42: 1046-1052, 1993
6. Pamboukian, C.R.D.; Facciotti, M.C.R. Correlation between pellet size and glucoamylase production in submerged cultures of Aspergillus awamori. Rev. Microbiol., 29: 23-26, 1998.
7. Paul, G.C.; Priede, M.A.; Thomas, C.R. Relationship between morphology and citric acid production in submerged Aspergillus niger fermentations. Biochem. Eng. J., 3: 121-129, 1999. 8. Paul, G.C.; Thomas, C.R. Characterization of mycelial morphology
using image analysis. Adv. Biochem. Eng./Biotechnol., 60: 1-59, 1998.
9. Tamura, S.; Park, Y.; Toriyama, M.; Okabe, M. Change of mycelial morphology in tylosin production by batch culture of Streptomyces fradiae under various shear conditions. J. Ferment. Bioeng., 83: 523-528, 1997.
10. Treskatis, S.K.; Orgeldinger, V.; Wolf, H.; Gilles, E.D. Morphological characterization of filamentous microorganisms in submerged cultures by on-line digital image analysis and pattern recognition. Biotechnol. Bioeng., 53: 191-201, 1997.
11. Warren, S.J.; Keshavarz-Moore, E.; Shamlou, P.A.; Lilly, M.D.; Thomas, C.R.; Dixon, K. Rheologies and morphologies of three Actinomycetes in submerged culture. Biotechnol. Bioeng., 45: 80-85, 1995.