Structural and regulatory differences in amylase isoenzymes in germinating
Brazilian barley cultivars
J.E. Georg-Kraemer
1and S.S. Cavalli
1,2 1Departamento de Genética, Universidade Federal do Rio Grande do Sul, Porto Alegre, RS, Brazil.
2Laboratório de Biodiversidade, Universidade Luterana do Brasil, Canoas, RS, Brazil.
Abstract
The amylase electrophoretic patterns of 10 Brazilian brewing-barley varieties with different malting grades and diastatic power were analyzed during the 7-day germination which occurs during the malting process. Intra and inter-variety genetic variability was observed at both the structural and regulatory level. In the first few days after germination all varieties showed a few active loci, all of them with low activity. In subsequent days, new loci became active and those already detected since early germination showed increased activity. All varieties showed a continuous increase in amylase synthesis until the 3rd and/or 4th day after germination. Some varieties maintained high amylase activity until the last day of germination, while others showed a decrease in activity on the 5th or 6th day. No specific band increased or decreased its intensity independently of the others. A total of 14 loci were detected, out of which only one locus was polymorphic, indicating very low structural genetic variability, with only 2.8% polymorphic loci, an average of 1.04 alleles per loci, and an average expected heterozygosity of only 0.7%. The mean intra-variety Jaccard similarity coefficient complement (1 - SJ) was 0.009. The mean intra-variety difference
based on regulatory differences was higher (1 - SJ = 0.17) than that obtained based on structural differences,
suggesting differential gene activation. Inter-variety differentiation also showed low structural variability, with 1 - SJ=
0.026 and a Nei genetic distance (D) value of 0.0076, and a remarkable increase in divergence caused by differential gene activation (1 - SJ= 0.34). These results indicate that regulatory polymorphism is the principal agent responsible
for amylase variability in the barley varieties analyzed.
Key words:barley, amylases, isoenzymes, structural and regulatory genetic differences.
Received: June 27, 2000; accepted: February 5, 2002.
Introduction
The central problem in plant developmental biology is to understand the role structural and regulatory genes play in differentiation. Structural genes codify RNA mole-cules, including mRNA, which is responsible for the syn-thesis of the structural proteins and enzymes necessary for cell structure and metabolic activities. Regulatory genes control structural gene expression at the temporal, spatial, and quantitative level. The effect of gene expression is il-lustrated by the fact that although all the cells of multicellular individuals are derived from a one-celled zy-gote by equal mitotic divisions, an extraordinary degree of cell and tissue heterogeneity occurs in the differentiated or-ganism, this heterogeneity being the result of the activation and repression of specific genes in different cells. During plant development a well-defined temporal and spatial pro-gram for gene expression demands interaction between reg-ulatory and structural genes.
Developmental studies with isoenzymes have pro-vided considerable insight into the role of structural genes and into the mechanisms that control enzyme synthesis dur-ing cell differentiation, consistently supportdur-ing the concept of differential gene action during this process.
Starch-degrading enzymes, present in cereal grains, are important in the development of plant embryos. In the case of barley, such enzymes are critical to the malting and brewing industries because they allow good quality malting to be obtained. Among the amylolytic enzymes,α-amylase (1,4-α-D-glucanohydrolase, EC 3.2.1.1) is thought to be the only enzyme which can initiate the cleavage of native starch granules by hydrolyzingα-1,4-linked glucose poly-mers. The debranching and degradation of the resultant maltodextrins and soluble polymers are completed by β-amylase, limit dextrinase,β-glucosidase, andα-amylase (Dunn, 1974), of which β-amylase (1,4-D-glucan malto-hydrolase, EC 3.2.1.2) is considered the principal enzyme responsible for starch hydrolysis, which it achieves by catalyzing the reaction that releasesβ-maltose from the non-reducing chain end of starch and starch-related com-pounds (Harris, 1962).
www.sbg.org.br
Send correspondence to Suzana S. Cavalli. Departamento de Genética, UFRGS, Caixa Postal 15053, 91501-970 Porto Alegre, RS, Brasil. E-mail: [email protected].
This paper describes the intra and inter-variety struc-tural and regulatory genetic variability of the amylases in 10 Brazilian barley varieties.
Material and Methods
Plant material and germination
Table 1 indicates the 10 Brazilian barley varieties (8 cultivars and 2 lines) and their genealogical data, and Table 2 their malting quality and diastatic power. Both measures were determined and supplied by Ambeve Brewery, Nave-gantes Malting Subsidiary, Porto Alegre, RS, Brazil. Dias-tatic power (a measure of starch-degrading activity) was measured in malt kilned and ground, according to EBC-Analytic 4.12 (EBC EBC-Analytica, 1997). Malting quality scores of each variety were determinated on the basis of 16 malt characteristics (fine milling, extract, diastatic power, total proteins,β-glucan concentration, friability, and viscosity be-ing the most important ones) and 10 plant characteristics (germinative power, total proteins in dry material, kernel size, to mention but a few).
Grain samples from each variety (grain size 2.2-2.8 mm) were germinated at 16 °C in a micro-malting unit at the AMBEVE Brewery - Navegantes Malting Sub-sidiary, after 13 h of stepping at 20 °C. Samples were re-moved on day 1, 2, 3, 4, 5, 6 and 7 after germination and frozen until the electrophoretic analysis.
Electrophoretic analyses
For each day after germination, 11 endosperms from each variety were dissected out and each half endosperm homogenized in 0.05 M Tris-HCl buffer (pH 6.7) supple-mented with 1 mM CaCl2. Each sample was analyzed using horizontal and vertical electrophoresis. Horizontal electro-phoresis was carried out in 6% acrylamide gel with discon-tinuous buffer (Scandalios, 1969) in a constant voltage gradient of 10 V/cm until the front line reached 9 cm be-yond the origin. Vertical electrophoresis was carried out in 3.1% acrylamide compaction gel and 7.18% acrylamide separation gel with discontinuous buffer (Davis, 1964) at 10 mA until the tracking dye reached the separation gel (about 1 h) and subsequently at 20 mA for 3 h. After elec-trophoresis, the gels were incubated to develop the amylase isoenzymes (Chao and Scandalios, 1972; Maris, 1992).
Data analysis
The genetic control of isoenzymes was determined by analyzing the patterns of different endosperms from the 10 varieties, considering that barley is an autogamous species. The intra-variety genetic variability was measured based on allele frequencies, assessing the mean number of alleles per loci (A), proportion of polymorphic loci (P) and expected heterozygosity (H). The inter-variety divergence (D) was calculated according to Nei (1972). Intra-variety and inter-variety differences were also measured at the phenotypic (banding-pattern) level using the Jaccard similarity coeffi-cient complement (1 - SJ), where SJ=a/(a+u) in whichais the number of characters shared by the two entities andu
the number of characters present in one endosperm but ab-sent in the other (Jaccard, 1908).
Results
Characterization of amylase isoenzymes in barley endosperms
Electrophoretic analyses of barley endosperm at dif-ferent stages after germination allowed the detection of 16 principal amylase bands plus one secondary band. These
Table 1- Genealogy of the ten Brazilian barley varieties.
Variety1 Genealogy
Cultivar MN-682 Cultivar MN-698 Cultivar MN-656
Cultivar MN-684 Cultivar MN-668
Cultivar BR-2 Cultivar MN-694 Cultivar MN-691 Line MN-705 Line MN-706
MN-610 X MN-599 MN-599 X MN-635
[(SG4279 X FM-404) X (4b Bacco X Union)] X FM-434
Ant-5 X MN-577
[(SG4279 X FM-404) X (4b Bacco X Union) X Delisa
NORBERT X FM-424 MN-610 X MN-578
(Bonita X MN-377) X MN-599 MN-599 X BR-2
MN-607 X MN-640 MN-610: FM-434 X Duvehot MN-599: (Ariana X Volla) X FM-462 FM-462: {[(Alpha X Pirolina) X Dunajaski]
X Mansholtz}
FM-404: seleção WISA-WB
FM-434: [(Quinn X M.Heda) X WISA-WB] MN-635: [(SG4279 X FM-404) X 4b Bacco
X Union)] X FM-434
FM-424: [(Quinn X M.Heda) X WS-5746) MN-577: Jlyb.Jlor X FM-404
MN-578: (CEB.CAPA X Volla) X (Bolivia X FM-404)
MN-607: FM-434 X FM-462
MN-640: [(SG4279 X FM-404) X (4b Bacco X Union)] X FM-404
1All varieties (except for BR-2) were origined and provided by AMBEVE
Brewery, Navegantes Malting Subsidiary, Porto Alegre-RS, Brazil. Cultivar BR-2 was origined and provided by the Centro Nacional de Pesquisa de Trigo, EMBRAPA, Passo Fundo-RS, Brazil.
Table 2- Malting quality and diastatic power from the Brazilian barley varieties.
Variety1 Malting quality Diastatic power (WK)1
Cultivar MN-682 Cultivar MN-698 Cultivar MN-656 Cultivar MN-684 Cultivar MN-668 Cultivar BR-2 Cultivar MN-694 Cultivar MN-691 Line MN-705 Line MN-706
91.2 High 94.4 High 85.6 Medium 82.4 Medium 80.0 Medium 76.8 Medium 76.8 Medium 71.2 Medium 74.4 Medium 80.0 Medium
237 High 181 Low 220 High 269 High 272 High 260 High 209 High 277 High 193 Low 173 Low
bands were considered to be the result of 14 loci, numbered in ascending order, according to the position of the band in relation to the electrophoretic anode (Amy-1 toAmy-14).
Only locus Amy-9 was polymorphic, with two alleles
(Amy-91andAmy-92).LocusAmy-1presented a band
typi-cal of secondary isoenzyme, with constant electrophoretic distance and intensity proportional to the principal. Figure 1 shows amylase banding-patterns and indicates the genetic control of some isoenzymes.
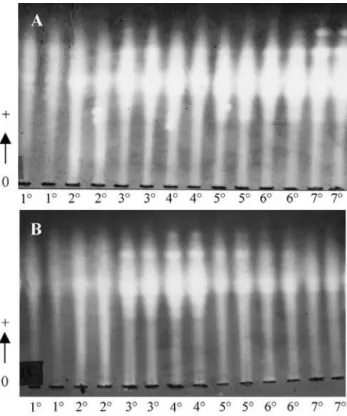
Ontogenetic regulation of genic expression
The general pattern of the temporal distribution of en-dosperm amylase isoenzymes is shown in Figure 2. All va-rieties exhibited only a few active amylase loci in the first days after germination, but there was a general increase in activity during the following days, with new loci becoming active and those already detected since early germination showing increased activity. All varieties showed increasing amylase activity up to the 3rd or 4th day after germination. Some varieties (MN-656 and MN-682) maintained this high activity until the last day (7th day) analyzed while oth-ers showed a decrease in amylase activity on the 5th or 6th day. No band increased or decreased in intensity independ-ently of the other bands.
Intra-variety variability
The 10 varieties showed two kinds of genetic vari-ability,i.e.structural polymorphism due to the occurrence of different alleles for each locus and regulatory polymor-phism due to the differential activity of each locus at each developmental stage in the endosperms of the different va-rieties.
Intra-variety polymorphism was very low when only structural differences were considered because, as has al-ready been stated, only locusAmy-9was polymorphic
(Ta-ble 3). Genetic variability measurements based on allele
Figure 1- Vertical electrophoresis banding-patterns of amylases extracted from barley seed endosperms on the 4th day after germination. A) Six
variet-ies: MN-698, MN-656, MN-684, MN-668, BR-2, MN-694. B) Variety MN-684. Some loci and the alleles of lociAmy-9are shown.
Figure 2- Ontogenetic changes in banding-patterns of amylases extracted
frequency for the 14 loci are shown in Table 4. Considering all varieties assayed, only 2.8% of loci were polymorphic, with an average number of 1.04 alleles per loci, and an av-erage expected heterozygosity of only 0.7%. Structural variability was also evaluated using the Jaccard similarity coefficient complement (1 - SJ). In this case, the occurrence of one or other band produced by the alleles of locusAmy-9
was considered as the only difference between varieties. For the other loci, only one allele (regardless of whether or not the locus was active) was used to calculate structural variability. The mean intra-variety difference was 1 - SJ= 0.009 (Table 5), a result which confirms the low intra-variety polymorphism determined by structural genes.
Although low structural polymorphism was ob-served, higher intra-variety variability was detected be-tween different endosperms due to differential gene activation,i.e.the same locus was active or inactive in
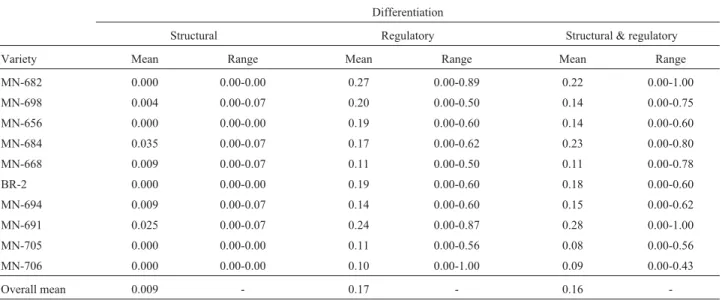
dif-ferent endosperms from each variety at the same develop-mental stage. The intra-variety differences generated by gene activation only were measured using the Jaccard simi-larity coefficient complement, calculated using the number of active loci shared by each endosperm pair divided by the total number of active loci present in the pair but without considering structural (allele) differences (Table 5). The mean intra-variety difference based on regulatory differ-ences was higher (1 - SJ= 0.17) than that obtained based on structural differences, indicating an increase in variability generated by differential gene activation.
The Jaccard similarity coefficient complement was also calculated considering both structural and regulatory differences (Table 5), producing a mean intra-variety dif-ference of 1 - SJ= 0.16, which is similar to the figure found for regulatory differences. These results suggest that regu-latory polymorphism is the principal agent of amylase vari-ability in the barley varieties analyzed.
Inter-variety differentiation
Different varieties presented few structural differ-ences in relation to locusAmy-9(Table 3), with most
variet-Table 3- Frequency of theAmy-92allele.
Varieties Amy-92frequency*
MN-682 MN-698 MN-656 MN-684 MN-668 BR-2 MN-694 MN-691 MN-705 MN-706
1.00 0.96 1.00 0.30 0.99 1.00 0.97 0.75 1.00 1.00
*Amy-91frequency is complementary.
Table 4 - Intra-variety genetic variability calculated using 673 barley endosperms assessed for 14 amylase loci.
Geneticvariability
Variety A P H
MN-682 MN-698 MN-656 MN-684 MN-668 BR-2 MN-694 MN-691 MN-705 MN-706
1.00 1.07 1.00 1.07 1.07 1.00 1.07 1.07 1.00 1.00
0.00 0.07 0.00 0.07 0.07 0.00 0.07 0.07 0.00 0.00
0.000 0.006 0.000 0.030 0.001 0.000 0.004 0.027 0.000 0.000
Mean 1.04 0.028 0.007
A = mean number of alleles per loci. P = proportion of polymorphic loci. H = expected heterozygosity.
Table 5- Intra-variety differentiation over seven days after germination, calculated using the Jaccard similarity coefficient complement (1 - SJ).
Differentiation
Structural Regulatory Structural & regulatory
Variety Mean Range Mean Range Mean Range
MN-682 0.000 0.00-0.00 0.27 0.00-0.89 0.22 0.00-1.00
MN-698 0.004 0.00-0.07 0.20 0.00-0.50 0.14 0.00-0.75
MN-656 0.000 0.00-0.00 0.19 0.00-0.60 0.14 0.00-0.60
MN-684 0.035 0.00-0.07 0.17 0.00-0.62 0.23 0.00-0.80
MN-668 0.009 0.00-0.07 0.11 0.00-0.50 0.11 0.00-0.78
BR-2 0.000 0.00-0.00 0.19 0.00-0.60 0.18 0.00-0.60
MN-694 0.009 0.00-0.07 0.14 0.00-0.60 0.15 0.00-0.62
MN-691 0.025 0.00-0.07 0.24 0.00-0.87 0.28 0.00-1.00
MN-705 0.000 0.00-0.00 0.11 0.00-0.56 0.08 0.00-0.56
MN-706 0.000 0.00-0.00 0.10 0.00-1.00 0.09 0.00-0.43
-ies having theAmy-92allele fixed or at high frequency, the
exception being variety MN-684 in which theAmy-91allele
was most common. This low structural gene divergence be-tween varieties is shown in Figure 1A. The inter-variety differences (Table 6) were measured using the Jaccard sim-ilarity coefficient complement at the same three levels (structural polymorphism, regulatory polymorphism, and both simultaneously) used to evaluate intra-variety
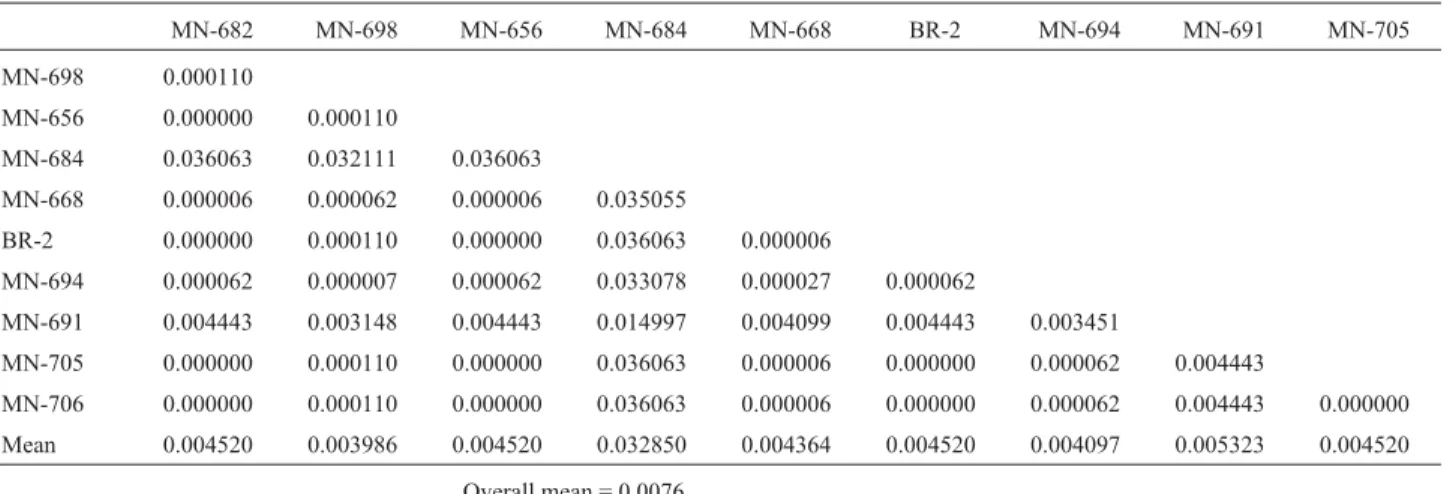
vari-ability. Nei distance (1972), based on allele frequencies, was also calculated to assess structural gene differences (Table 7). Inter-variety divergence was very low for struc-tural genes, with 1 - SJ= 0.026 and D = 0.0076. Analysis of inter-variety variability due exclusively to regulatory dif-ferences showed a remarkable increase in inter-variety di-vergence caused by differential gene activation (1 - SJ= 0.34) as compared to the divergence obtained for
Table 6- Inter-variety differentiation over seven days after germination, calculated using the Jaccard similarity coefficient complement (1 - SJ).
MN-682 MN-698 MN-656 MN-684 MN-668 BR-2 MN-694 MN-691 MN-705 MN-706 Mean Overall mean
MN-682 - 0.271 0.29 0.48 0.31 0.35 0.36 0.36 0.30 0.34 0.34
MN-698 0.0022
0.293 - 0.21 0.42 0.31 0.38 0.27 0.32 0.24 0.38 0.31
MN-656 0.000
0.33
0.003
0.25
- 0.43 0.35 0.30 0.27 0.30 0.21 0.40 0.31
MN-684 0.048 0.38 0.047 0.27 0.046 0.30
- 0.42 0.50 0.45 0.38 0.45 0.48 0.45
MN-668 0.007 0.35 0.003 0.38 0.007 0.36 0.045 0.37
- 0.38 0.34 0.42 0.33 0.15 0.33 0.35
BR-2 0.000 0.38 0.002 0.32 0.000 0.30 0.053 0.39 0.001 0.44
- 0.26 0.38 0.26 0.39 0.36
MN-694 0.003 0.39 0.003 0.27 0.004 0.30 0.039 0.33 0.004 0.40 0.004 0.25
- 0.38 0.27 0.37 0.33
MN-691 0.016 0.38 0.019 0.30 0.019 0.34 0.041 0.32 0.016 0.46 0.019 0.40 0.020 0.35
- 0.36 0.47 0.37
MN-705 0.000 0.33 0.004 0.23 0.000 0.24 0.044 0.29 0.001 0.40 0.000 0.26 0.004 0.27 0.014 0.33
- 0.33 0.31
MN-706 0.000 0.38 0.002 0.45 0.000 0.44 0.044 0.41 0.001 0.17 0.000 0.46 0.004 0.47 0.014 0.52 0.000 0.42 - -Mean 0.009 0.36 0.009 0.31 0.009 0.32 0.045 0.34 0.009 0.37 0.009 0.36 0.009 0.34 0.020 0.38 0.119 0.37
Overall mean = 0.026
0.34
1Values for structural and regulatory polymorphism together are shown above the diagonal line which cuts the table.
2Values for structural polymorphism are shown in bold in the first line of each cultivar below the diagonal line which cuts the table. 3Values for regulatory polymorphism are shown in normal type below the values for structural polymorphism.
Table 7- Nei distance between Brazilian barley varieties based on structural differences found for the amylase loci over 7 days after germination.
MN-682 MN-698 MN-656 MN-684 MN-668 BR-2 MN-694 MN-691 MN-705
MN-698 0.000110
MN-656 0.000000 0.000110
MN-684 0.036063 0.032111 0.036063
MN-668 0.000006 0.000062 0.000006 0.035055
BR-2 0.000000 0.000110 0.000000 0.036063 0.000006
MN-694 0.000062 0.000007 0.000062 0.033078 0.000027 0.000062
MN-691 0.004443 0.003148 0.004443 0.014997 0.004099 0.004443 0.003451
MN-705 0.000000 0.000110 0.000000 0.036063 0.000006 0.000000 0.000062 0.004443
MN-706 0.000000 0.000110 0.000000 0.036063 0.000006 0.000000 0.000062 0.004443 0.000000 Mean 0.004520 0.003986 0.004520 0.032850 0.004364 0.004520 0.004097 0.005323 0.004520
structural differences alone. The total difference, including structural and regulatory polymorphism, was 1 - SJ= 0.35, again similar to the figure obtained for regulatory differ-ences.
Discussion
Only one polymorphic locus was detected in the 10 Brazilian barley varieties analyzed in this study. In a previ-ous investigation, Maris (1992) assessed other Brazilian barley varieties for amylases and also detected low vari-ability for the amylase system, finding that out of the four loci analyzed only one was polymorphic with two different alleles. Although both studies have detected relatively high intra-variety structural homogeneity for amylase genes, five varieties analyzed in the present study showed some degree of intra-variety polymorphism, while those varieties analyzed by Maris (1992) did not.
The inter-variety structural divergence detected in the present study (D = 0.0076) was lower than that found by Maris (1992) for amylases (D = 0.096). In the varieties studied by Maris, one variety presented a fixed allele differ-ent from that found in the other varieties, while many of the varieties analyzed in the present research were polymor-phic for the same alleles.
In the study developed by Maris (1992), amylases showed less polymorphism than other enzymes such as es-terases, acid phosphatases, malate dehydrogenases, leucine aminopeptidases, and glutamate oxaloacetate trans-aminases. Amylases are hydrolases (IUB, 1979) involved in peripheral metabolism, and for this reason are considered potentially polymorphic enzymes (Gillespie and Langley, 1974). The low structural genetic variability found in Bra-zilian barley variety amylases compared to other enzymes also involved in peripheral metabolism, such as esterases and acid phospatases, must be related to the selection for malting characteristics that breeders impose upon these barley varieties. Such selection restricts the structural vari-ability of amylase genes by selecting only certain allelic forms.
The major differences in amylase patterns found when barley varieties were analyzed at the same develop-mental stage were at the regulatory level. These differences are probably due to differential gene activation in the dif-ferent genotypes. It is known that regulatory differences are of greater adaptive and evolutionary significance than structural gene changes (Wilson, 1976), and Soulé (1973) emphasized that the process involved in species differentia-tion requires changes mainly at the gene regulatory level. Differently, at the intraspecific level, gene regulation fol-lows a standard development program with precisely coor-dinated sequences, although some regulatory mutants have been detected in different species (Holmes et al., 1983;
Doane et al., 1983; Scandalios, 1983). In self-pollinated
plants intraspecific regulatory differences seem to be more common (Motta, 1981; Cavalli-Molina, 1984; Schiengold,
1985; Georg, 1996) because, as pointed out by Cavalli-Molina (1984), self-pollination restricts gene flow, assur-ing that each line (an individual and its progeny) follows an independent evolutionary path. Conversely, in outbreeding species, individual differences in regulatory genes do not seem to be so frequent because gene flow, heterozygosity and recombination of regulatory genes may lead to sterile and unviable genotypes. The present study confirms the im-portance of regulatory mechanisms for genetic differentia-tion at least in self-pollinated species.
The developmental study showed that, at least for the varieties analyzed, there is a high general amylase activity around the fourth day after germination. This finding is very important for malting proposes because it would allow reduction in expenses and the malting of a larger amount of grain in less time. This conclusion was fully examined in Georg-Kraemer et al. (2001).
Acknowledgments
CNPq, FAPERGS, and AMBEVE - Navegantes Malting Subsidiary, Porto Alegre-RS, Brazil supported this research.
References
Cavalli-Molina S (1984) Variabilidade genética em populações naturais deRelbunium hypocarpium(Rubiaceae). Ph Thesis, Universidade Federal do Rio Grande do Sul, Porto Alegre. Chao SE and Scandalios JG (1972) Developmental dependent
ex-pression of tissue specific amylase in maize. Molec Gen 115:1-9.
Davis B J (1964) Disc electrophoresis. II. Method and application to human serum proteins. Ann N Y Acad Sci 121:404-427. Doane WW, Treat-Clemons LG, Buchberg AM, Gemmill RM,
Levy JN and Hawley SA (1983) Genetic mechanisms for tis-sue-specific control of alpha-amylase expression in
Drosophila melanogaster.In: Rattzzi MC, Scandalios JG, Whitt GS (eds) Isozymes: Current Topics in Biological and Medical Research, Alan R. Liss, Inc., New York: 9, pp 63-90.
Dunn, GA (1974) A model for starch breakdown in higher plants. Phytochemistry 13:1341-1346.
EBC ANALYTICA (1997). EBC Method 4.12.
Georg JE (1996) Análise ontogenética dos padrões isoenzimá-ticos deHordeum euclastonL. (Gramineae). Bachelor
The-sis, Universidade Federal do Rio Grande do Sul, Porto Alegre.
Georg-Kraemer JE, Mundstock EC and Cavalli-Molina S (2001) Developmental expression of amylases during barley malt-ing. Journal of Cereal Science 33:279-288.
Gillespie JH and Langley CH (1974) A general mode to account for enzyme variation in natural populations. Genetics 76:837-884.
Harris G (1962) In: Cook AH (ed) Barley and Malt Biology, Bio-chemistry and Technology. Academic Press, London & New York, pp 583.
Isozymes: Current Topics in Biological and Medical Re-search. Alan R. Liss, Inc., New York: 9, pp 155-174. IUB (1979) Enzyme Nomenclature. Recommendation (1978) of
the Nomenclature Committee of the International Union of Biochemistry. International Union of Biochemistry, Aca-demic Press, New York.
Jaccard P (1908) Étude comparitive de la distribution florale dans une portion des Alpes et des Jura. Bull Soc Voudoise Sci Nat 37:547-579.
Maris AF (1992) Caracterização isoenzimática de cultivares bra-sileiras de cevada (Hordeum vulgareL.). Bachelor Thesis.
Universidade Federal do Rio Grande do Sul, Porto Alegre. Motta VEP (1981) Desenvolvimento ontogenético e
modifica-ções dos padrões isoesterásicos deRelbunium hypocarpium
(Rubiaceae). Master Thesis. Universidade Federal do Rio Grande do Sul, Porto Alegre.
Nei M (1972) Genetic distance between populations. Amer Natur 106:283-292.
Scandalios JG (1969) Genetic control of multiple molecular forms of enzymes in plants: a review. Biochem Genet 3:37-79. Scandalios JG (1983) Molecular varieties of isozymes and their
role in studies of gene regulation and expression during eukaryote development. In: Rattzzi MC, Scandalios JG, Whitt GS (eds) Isozymes: Current Topics in Biological and Medical Research. Alan R. Liss, Inc., New York: 9, pp 1-31. Schiengold M (1985) Efeito da regulação gênica na variabilidade
isoesterásica deRelbunium hypocarpium(Rubiaceae).
Mas-ter Thesis. Universidade Federal do Rio Grande do Sul, Porto Alegre.
Soulé M (1973) The epistasis cycle: a theory of marginal popula-tions. Ann Rev Syst 4:165-187.
Wilson AC (1976) Gene regulation in evolution. In: Ayala FJ (ed) Molecular Evolution. Sinauer Press, Sunderland, Mass., pp 225-234.