Ney Meziat FilhoI Gulnar Azevedo e SilvaII
I Programa de Pós-Graduação em Saúde
Coletiva. Instituto de Medicina Social (IMS). Universidade do Estado do Rio de Janeiro (UERJ). Rio de Janeiro, RJ, Brasil
II Departamento de Epidemiologia. IMS-UERJ.
Rio de Janeiro, RJ, Brasil Correspondence: Ney Meziat Filho R. São Francisco Xavier, 524 Pavilhão João Lyra Filho, 7º andar Bloco E, Maracanã
20550-900 Rio de Janeiro, RJ, Brasil E-mail: [email protected] Received: 5/5/2010 Approved: 11/14/2010
Article available from: www.scielo.br/rsp
Disability pension from back
pain among social security
benefi ciaries, Brazil
ABSTRACT
OBJECTIVE: To describe disability pension from back pain.
METHODS: Descriptive study based on data from the Brazilian Social Security Benefi ciary Database and the Social Security Statistics Annual Report in 2007. The incidence rate of disability pension from back pain was estimated according to gender and age by Brazilian states. There were also estimated working days lost due to back pain disability by occupation.
RESULTS: Idiopathic back pain was the most common cause of disability among social security pension and accidental retirement. Most pensioners were living in urban areas and were commercial workers. The rate of disability pension from back pain in Brazil was 29.96 per 100,000 benefi ciaries. A higher rate was seen among males and older individuals. Rondônia showed the highest rate, four times as high as expected (RR= 4.05) followed by Bahia with a rate about twice as high as expected (RR=2.07). Commercial workers accounted for 96.9% of working days lost due to disability.
CONCLUSIONS: Back pain was a major cause of disability in 2007 mostly among commercial workers showing great differences between the Brazilian states.
DESCRIPTORS: Back Pain. Insurance, Disability, utilization. Social Security. Occupational Health. Health Inequalities.
INTRODUCTION
Back pain is a public health concern in many Western countries.7,12,22,27 It is
estimated a point prevalence of back pain around 30% and a lifetime prevalence of 70% to 80%.1 Although back pain is a highly prevalent condition, in about
85% of cases an accurate pathological diagnosis cannot be made and they are considered either idiopathic or of nonspecifi c origin.5,19
For most experts back pain is synonymous of low (lumbar) back pain.6 Some
studies have examined secondary data with the International Classifi cation of Diseases (ICD) codes for the outcome and back pain included cervical pain, thoracic pain, sciatic pain, intervertebral disc disorders, spondylosis, radicu-lopathy, in addition to the most common of these conditions, low back pain.14,15,27
Despite the diffi culty in standardizing the outcome, the resulting economic loss has been signifi cantly high according to studies on costs of back pain and low back pain. In the UK, in 1998, back pain caused the greatest economic burden among all other diseases assessed.22 In the Netherlands, in 1991, Van Tulder
et al27 found that the indirect costs associated with absenteeism and disability
concluded that patients with back pain had low health-related quality of life than those with other conditions such as diabetes, angina and asthma.
In the United States, Deyo et al4 reported that the costs
with epidural steroid injections, opioid analgesics for back pain, lumbar magnetic resonance imaging and spinal fusion increased, 629%, 423%, 307% and 220% respectively in recent decades. However, this cost increase was not parallel to reduced work-related disability rates in the population. In contrast, for those conditions with more effective prevention and treat-ment as well as cardiovascular and pulmonary diseases, work-related disability rates dropped during this same period.4 In a study conducted in North Carolina, US,
on the trends of low back pain, the authors concluded that much of the growing costs with chronic low back pain were due to its increasing prevalence.11 Another
study showed that back problems were the second leading cause of lost productivity in the US following headache.25 Although the direct costs associated with
back pain management are increasing, most studies have showed that they are largely related to temporary and permanent work-related disability.7,8,22,27 The most
severe outcome of this condition is permanent disability pension, which is hardly reverted.20,21
According to two studies carried out in Norway,14,15 the
risk factors for disability pension and prognostic factors for back pain included being female; low education level and low socioeconomic condition; comorbidities; fatigue; and low professional qualifi cations.
A population-based study conducted in southern Brazil found a prevalence of chronic low back pain of 4.2%23
associated with female gender, older age, married status, low education level, smoking, increased body mass index, working in a lying down position, weight bearing and repetitive movements.
In addition to work-related physical demands, psycho-social factors such as psycho-social support, working condi-tions and increasing pressure for higher productivity were independently associated with low back pain in plastic industry workers in Salvador, northeast Brazil.10 Nursing providers and oil workers showed a
high prevalence of low back pain.9,13 Both occupations
require constant weight bearing.
Knoplich18 found in 1987 that back conditions were the
second leading cause of disability benefi t and disability pension in Brazil. Musculoskeletal conditions were the main cause of social security disability benefi ts paid to workers in Porto Alegre, southern Brazil, in 1998, followed by mental disorders and cardiovascular diseases.2 In a study conducted in Bahia, northeast
Brazil, based on data from the Brazilian Social Security Administration, among the benefi ts paid due to occupa-tional diseases, 70% were due to musculoskeletal and
connective tissue diseases and 14.5% nervous system diseases. Higher rates of lumbar disc conditions were seen among workers in the industries of transport, postal services and telecommunications, but causation was not established in a signifi cant proportion of benefi t cases.24
In Brazil there are neither studies assessing the rate of disability from back pain in macroregions and states nor economic analyses including direct and indirect costs associated to this condition. Thus, the objective of the present study was to describe disability pension from back pain.
METHODS
Descriptive study based on data from the Brazilian Social Security Beneficiary Database and Social Security Statistics Annual Reports. Information on disability (B32) and injury (B92) pension benefi ts for the years 2005, 2006 and 2007 were obtained by gender, age, wage level, industry, area (rural or urban), type of benefi ciary (permanent; contracted; self-employed; home worker; special taxpayer category; elective taxpayer category; unemployed); and federal unit for the following the International Classifi cation of Diseases, Tenth Revision (ICD-10) codes: M54 (dorsalgia), M47 (spondylosis), M48.0 (spinal stenosis), M50 (cervical disc disorders) and M51 (other intervertebral disc disorders). There was also collected information on all causes for disability and injury pensions for assessing the 10 top ICD-10 codes in these benefi ts.
Only the 2007 data were used in the analysis due to a signifi cant reduction in the benefi ts between 2005 (24,239) and 2007 (10,839) and the fact that the team of medical experts who were paid per case examination was replaced with experts from the Brazilian Social Security Administration.
The incidence rates of back pain in disability pensions by age, gender and Brazilian macroregions and states were estimated using as denominator the average monthly number of social security taxpayers by the same variables. The correlation between the Human Development Index (HDI) and these rates by state were assessed using Spearman’s correlation coeffi cient. For variables with unknown total taxpayers, we calculated the proportions, ratios of proportions and 95% confi -dence intervals (95% CI) of disability benefi ts from back pain by federal unit and industry. A test for differ-ences between proportions was performed to compare the proportion of rural and commercial workers in each Brazilian state and nationwide.
cases where the benefi ciary status was lost due to non-payment. The Social Security Statistics Annual Reports do not have information available on the actual number of benefi ciaries. Thus, the average monthly number of social security taxpayers was used as denomi-nator to calculate back pain rates in order to prevent overestimating the denominator with taxpayers who made only a few contributions. A similar method was used by Hagen & Thune16 in a study on work-related
disability from low back pain. They estimated the rate of back pain associated with temporary disability using as denominator the total number of employees in the public and private sectors in Norway. However, using the average monthly number of individual taxpayers as denominator may have slightly underestimated the rates as they were 33,333,012 and 36,177,021 in 2006 and 2007, a 7.9% difference.
Benefi ciaries of disability pensions from back pain included permanent, temporary, contracted, self-employed workers, home workers, and elective and special categories of taxpayers, however, the latter three are not entitled to injury pension.
There were estimated working days lost due to disability among employed workers by industry according to the number of benefi ts by age for each category. We chose to restrict our estimates to employed workers as benefi -ciaries of the other categories might not have the same representativeness regarding working days lost. Also, as age in our data was not a continuous variable we used the median fi ve-year interval for each age group plus 0.5 year. It was then subtracted from 65 (males) or 60 years (females), multiplied by the number of benefi ts for each age group studied and multiplied by 365.
The outcome disability pension from back pain was dichotomized into idiopathic back pain (M54 – dorsalgia) and back pain with pathological changes (M47 – spondylosis, M48.0 – spinal stenosis, M50 – cervical disc disorders, M51 – other intervertebral disc disorders) for the calculation of proportions. There were excluded infl ammatory and infectious spondylopathies. The benefi ts were also stratifi ed into disability (B32) and injury (B92) pensions.
The databases obtained were extracted into electronic datasheets and exported to R-project for statistical analysis.
The study was approved by the Research Ethics Committee at the Instituto de Medicina Social of Universidade do Estado do Rio de Janeiro (protocol no. CAAE 0028.0.259.000-09, 12/09/2009).
RESULTS
Most pensioners were male aged 50–64 living in urban areas and had an income of up to three minimum
wages. Among them, 33.3% were employed, 26.0% unemployed, 22.8% self-employed and 4.3% retired due to work-related injury.
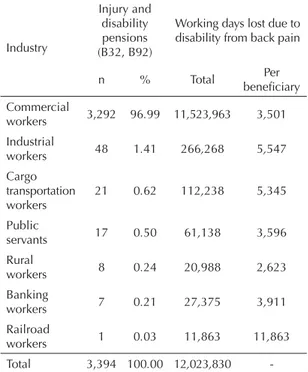
The number of working days lost due to disability from back pain was greater than 12 million days. Most were commercial workers and they were benefi ciaries of 97.0% of all benefi ts due to disability from back pain and, consequently, had the greatest numbers of working days lost. However, the highest number of days lost per benefi ciary was found among cargo transport and railroad workers, but only one benefi t was granted to railroad workers (Table 1).
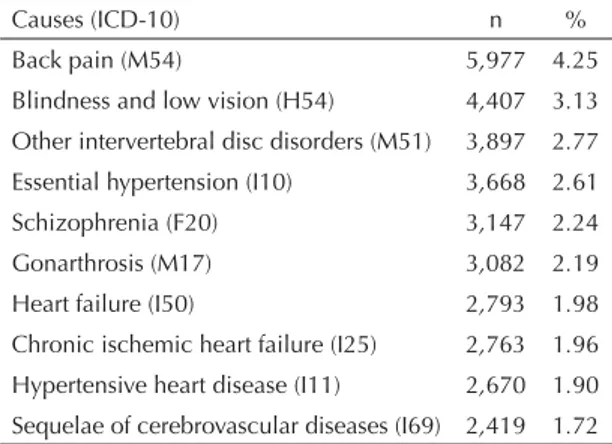
Out of all disability pensions from back pain, 6,200 (57.2%) were due to idiopathic causes. The most common conditions were dorsalgia (33.4%), low back pain with sciatica (29.0%), and low back pain (22.9%). Cervical pain was found in 7.2% of nonspecifi c cases. Among the pathological causes, 4,061 (88.0%) were intervertebral disc disorders associated to low back condition. Cervical disc disorders were seen in only 3.6% of specifi c cases. Idiopathic back pain was the leading cause of disability (Table 2) and injury (not shown in Table) pensions in Brazil in 2007.
In 2007, the incidence rate of back pain in disability pensions in Brazil was 29.96 per 100,000 taxpayers (Figure 1). This rate increased with age reaching 392.59 per 100,000 among males aged 60–64 with an expected reduction from the age 65 –normal retire-ment age. However, the same was not seen among
Table 1. Injury and disability pensions from back pain granted to workers and working days lost by industry. Brazil, 2007.
Industry
Injury and disability pensions (B32, B92)
Working days lost due to disability from back pain
n % Total Per
benefi ciary Commercial
workers 3,292 96.99 11,523,963 3,501 Industrial
workers 48 1.41 266,268 5,547
Cargo transportation workers
21 0.62 112,238 5,345
Public
servants 17 0.50 61,138 3,596
Rural
workers 8 0.24 20,988 2,623
Banking
workers 7 0.21 27,375 3,911
Railroad
workers 1 0.03 11,863 11,863
-women. The highest rate among females was 533.87 per 100,000 taxpayers in those aged 65–69 with a reduction only after the age of 70. The highest rates were seen in the North Region (45.46), followed by the South (34.27), Northeast (30.04), Southeast (28.65) and Central-west (19.87).
The northern state of Rondônia showed the highest rates of disability pensions from back pain (121.39 per 100,000 taxpayers), more than four times as high as expected (p<0.000001), followed by Bahia, twice as high as expected (62.04 per 100,000 taxpayers) (Figure 2).
Only in Rondônia the proportion of rural workers was greater than commercial workers (Table 3). In the northern state of Roraima, half of the pensions were granted to rural workers while in all other states and the Federal District the proportion of pensions granted to commercial workers was higher.
In all Brazilian macroregions and states pension rates were not correlated with the HDI (data not shown).
Even after disregarding the outlier rate of Rondônia, the rate in the North region fell to 34.14 and was almost similar to that seen in the South, but still there was no correlation with the HDI.
DISCUSSION
Back pain was the leading cause of disability benefi ts and pensions in Brazil in 2007 (data on disability benefi ts not shown).
Most disability pensions were from idiopathic back pain (57.2%) which corroborates the fi ndings of other authors who suggested that only 5% to 10% of back pain cases have a defi ned cause.5,19 Although lower than
that of idiopathic causes, the proportion of pathological causes was higher than that reported in other studies.5,19
One explanation would be that these other studies included the general population that is less likely to have back pain associated with pathological changes than disability pensioners.
Among the idiopathic conditions, complaints in the low back pain were the most common, which is a consensus in the literature.6 The rate of dorsalgia (M54) was high,
which can be explained by ill-defi ned location of back pain during expert examination. It is likely that this category, without a subcategory, refl ects the diffi culty of identifying pain location or it even refl ects there are more subcategories of idiopathic back pain in a single individual.
Intervertebral disc disorders (M51) were the most common condition among cases with pathological causes. These fi ndings were expected because changes of intervertebral discs are common even in asymptom-atic individuals.17
Figure 1. Back pain incidence rates in disability pensions by gender and age group per 100,000 taxpayers. Brazil, 2007.
600 per 100,000
500
400
300
200
100
0
25-34 35-39 40-44 Total
Males Females
45-49 50-54 55-59 60-64 65-69 70 or more Table 2. Disabilty pensions by top 10 causes. Brazil, 2007.
Causes (ICD-10) n %
Back pain (M54) 5,977 4.25
Blindness and low vision (H54) 4,407 3.13 Other intervertebral disc disorders (M51) 3,897 2.77 Essential hypertension (I10) 3,668 2.61
Schizophrenia (F20) 3,147 2.24
Gonarthrosis (M17) 3,082 2.19
Heart failure (I50) 2,793 1.98
The number of working days lost per beneficiary suggests that back pain disability occurs at an earlier age in some industries, probably due to the physical demands of the related occupations. The estimate of working days lost included only days lost due to disability. But if there were included days lost due to temporary medical leave and disability benefi ts it would certainly increase even more this estimate. Despite these limitations, the study fi ndings suggest that back pain is an extremely high economic burden in Brazil.
Regarding different rates found by gender, it is likely there is a greater proportion of women disabled from back pain who have not made suffi cient social security contributions for retirement even though the normal retirement age is 60 among women.
A limitation of the present study is that there was missing information on denominators. Thus, we were not able to estimate the average monthly number of social security taxpayers in each industry by state and check whether workers in Rondônia are more vulner-able to disability from back pain or if there are propor-tionally more rural workers who are social security
benefi ciaries in this state. If the latter assumption is true, the high rate of disability pension from back pain in Rondônia could be explained by greater physical demands on rural workers who are therefore more likely to suffer from disabling back pain.
Also because of missing information we were not able to estimate age-standardized rates. However, even if the age distribution of social security taxpayers in Rondônia were different from other states, it could not explain the huge difference between the rates.
Another limitation of this study is that benefi t granting depends on Ministry of Social Security policies and they may change from one administration to another. Besides, it is affected by expert examinations which can be quite inconsistent. The most recent guidelines of the Brazilian Medical Association for the diagnosis of low back pain and sciatica were published in 2001. Many studies on the diagnosis and prognosis of disability from low back pain and sciatica have been published since then and these guidelines need to be regularly updated. The development of specifi c guidelines for back pain can be a valuable support for medical experts working
Figure 2. Back pain incidence rates in disability pensions by federal unit per 100,000 taxpayers. Brazil, 2007. Rondônia
Bahia Espírito Santo Alagoas Santa Catarina Roraima Pará Paraná Minas Gerais Mato Grosso do Sul Tocantins São Paulo Amazonas Goiás Rio Grande do Sul Acre Sergipe Piauí Rio de Janeiro Mato Grosso
Maranhão Paraíba
Rio Grande do Norte Ceará Pernambuco Amapá Distrito Federal
121.39 62.04
56.66 53.48 48.36 48.27 43.50 36.33 35.09 33.97 29.26 27.33 24.89 23.44 22.48 22.07 21.73 19.24 19.03 17.53 16.09 14.94 14.01 13.34 7.82 7.45 7.29
Disability from bac
k pain
Meziat F
ilho N &
Azev
edo e Silv
a G
Feederal unit Pensions
(B32, B92) servants,
% (n)
transportation workers % (n)
workers % (n)
Industrial workers % (n)
Other % (n)
% (n) RP (95% CI) % (n) RP (95% CI)
Rondônia 230 39.1 (90) 0.44 (0.38;0.50) 58.3 (134) 6.86 (6.28;7.48) - 2.6 (6) - -
-Bahia 996 86.6 (863) 0.98 (0.97;0.99) 10.4 (104) 1.22 (1.02;1.42) 0.2 (2) 1.8 (18) 0.2 (2) 0.7 (7)
-Espírito Santo 433 85.7 (371) 0.97 (0.95;0.99) 10.6 (46) 1.25 (0.94;1.56) - 3.7 (16) - -
-Alagoas 157 89.2 (140) 1.01 (0.54;1.48) 10.2 (16) 1.20 (1.00;1.40) - 0.6 (1) - -
-Santa Catarina 869 86.7 (753) 0.98 (0.97;0.99) 10.9 (95) 1.28 (1.06;1.50) 0.2 (2) 1.7 (15) - 0.3 (3)
-Roraima 20 50.0 (10) 0.56 (0.34;0.78) 50 (10) 5.88 (3.70;8.04) - - - -
-Pará 262 76.0 (199) 0.86 (0.82;0.90) 16.4 (43) 1.93 (1.45;2.41) 2.7 (7) 3.4 (9) 0.4 (1) 1.1 (3)
-Paraná 868 82.5 (716) 0.93 (0.91;0.95) 13.8 (120) 1.62 (1.38;1.87) 0.1 (1) 2.9 (25) - 0.6 (5) 0.1 (1)
Minas Gerais 1464 90.2 (1320) 1.02 (0.87;1.18) 6.9 (101) 0.81 (0.79;0.83) 0.1 (2) 2.1 (31) 0.1 (1) 0.5 (8) 0.1 (1)
Mato Grosso do Sul 144 95.8 (138) 1.08 (0.57;1.59) 0.7 (1) 0.08 (0.04;0.12) - 2.8 (4) - 0.7 (1)
Tocantins 47 74.5 (35) 0.84 (0.74;0.95) 17 (8) 2.00 (0.86;3.14) 6.4 (3) 2.1 (1) - -
-São Paulo 3186 97.0 (3092) 1.09 (0.98;1.20) 0.8 (24) 0.09 (0.08;0.10) - 1.7 (54) - 0.5 (16)
-Amazonas 87 88.5 (77) 1.00 (0.37;1.63) 4.6 (4) 0.54 (0.44;0.65) - 5.7 (5) - 1.1 (1)
-Goiás 230 92.2 (212) 1.04 (0.65;1.44) 4.3 (10) 0.51 (0.45;0.58) 0.9 (2) 2.6 (6) - -
-Rio Grande do Sul 576 86.3 (497) 0.97 (0.96;0.98) 13.4 (77) 1.58 (1.28;1.88) - 0.3 (2) - -
-Acre 14 71.4 (10) 0.80 (0.59;1.01) 28.6 (4) 3.36 (0.89;5.83) - - - -
-Sergipe 56 87.5 (49) 0.99 (0.96;1.02) 7.1 (4) 0.84 (0.74;0.94) - 3.6 (2) - 1.8 (1)
-Piauí 45 73.3 (33) 0.83 (0.72;0.94) 20 (9) 2.35 (1.11;3.59) - 6.7 (3) - -
-Rio de Janeiro 649 96.9 (629) 1.09 (0.85;1.33) 1.4 (9) 0.16 (0.13;0.19) - 0.6 (4) 0.2 (1) 0.9 (6)
-Mato Grosso 90 85.6 (77) 0.97 (0.94;1.01) 11.1 (10) 1.31 (0.61;2.01) - 3.3 (3) - -
-Paraíba 58 70.7 (41) 0.80 (0.70;0.90) 20.7 (12) 2.44 (1.34;3.55) - 6.9 (4) - - 1.7 (1)
Maranhão 51 58.8 (30) 0.66 (0.53;0.79) 37.3 (19) 4.39 (3.03;5.75) 2 (1) 2 (1) - -
-Rio Grande do Norte 58 74.1 (43) 0.84 (0.75;0.93) 25.9 (15) 3.05 (1.87;4.24) - - - -
-Ceará 121 66.9 (81) 0.75 (0.67;0.83) 28.1 (34) 3.31 (2.54;4.08) 0.8 (1) 3.3 (4) 0.8 (1) -
-Pernambuco 76 75.0 (57) 0.85 (0.77;0.93) 18.4 (14) 2.16 (1.24;3.09) 1.3 (1) 3.9 (3) - 1.3 (1)
-Amapá 4 100.0 (4) 1.13 (0.00;4.23) 4.2 (2) 0.49 (0.00;0.98) - - -
-Distrito Federal 48 95.0 (46) 1.07 (0.20;1.95) - - -
-Total (Brazil) 10839 88.7 (9613) - - 8.50 (925) - - 0.2 (22) 2.0 (217) 0.1 (7) 0.5 (52) 0.02 (3)
For the calculation of ratios of proportions (RP) data from Brazil was used.
at the Social Security Administration.
A reduced waiting period for obtaining social secu-rity benefits would help protect worker’s health. Streamlining this process with immediate referral to occupational rehabilitation services would probably improve disability management and reduce the need for retirement.
According to Takahashi & Iguti,26 the Worker’s
Rehabilitation Program, a social security program designed to restore physical and psychosocial health of workers on disability benefi ts, was neglected in the 1990s. This program should be restructured based on current information. Moreover, the observed differences between the incidence rates by state stress the need for further studies to better understand the factors associated with this major disease burden among Brazilian workers.
1. Andersson GB. Epidemiological features of chronic low-back pain. Lancet.1999;354(9178):581-5. DOI:10.1016/S0140-6736(99)01312-4
2. Boff BM, Leite DF, Azambuja MIR. Morbidade subjacente à concessão de benefício por
incapacidade temporária para o trabalho. Rev Saude Publica. 2002;36(3):337-42. DOI:10.1590/S0034-89102002000300013
3. Burström K, Johannesson M, Diderichsen F. Swedish population health-related quality of life results using the EQ-5D. Qual Life Res. 2001;10(7):621-35. DOI:10.1023/A:1013171831202
4 Deyo RA, Mirza SK, Turner JA, Martin BI. Overtreating chronic back pain: time to back off? J Am Board Fam Med. 2009;22(1):62-8. DOI:10.3122/ jabfm.2009.01.080102
5. Deyo RA, Weinstein JN. Low back pain. N Engl J Med. 2001;344(5):363-70. DOI:10.1056/ NEJM200102013440508
6. Dionne CE, Dunn KM, Croft PR, Nachemson AL, Buchbinder R, Walker BF, et al. A consensus approach toward the standardization of back pain defi nitions for use in prevalence studies. Spine. 2008;33(1):95-103. DOI:10.1097/BRS.0b013e31815e7f94
7. Ekman M, Johnell O, Lidgren L. The economic cost of low back pain in Sweden in 2001. Acta Orthop. 2005;76(2):275-84. DOI:10.1080/00016470510030698
8. Ekman M, Jönhagen S, Hunsche E, Jönsson L. Burden of illness of chronic low back pain in Sweden: a cross-sectional, retrospective study in primary care setting. Spine. 2005;30(15):1777-85.
9. Fernandes RCP, Carvalho FM. Doença do disco intervertebral em trabalhadores da perfuração de petróleo. Cad Saude Publica. 2000;16(3):661-9. DOI:10.1590/S0102-311X2000000300014
10. Fernandes RCP, Carvalho FM, Assuncao AA, Silvany Neto AM. Interactions between physical and psychosocial demands of work associated to low back pain. Rev Saude Publica. 2009;43(2):326-34. DOI:10.1590/S0034-89102009000200014
11. Freburger JK, Holmes GM, Agans RP, Jackman AM, Darter JD, Wallace AS, et al. The rising prevalence of chronic low back pain. Arch Intern Med. 2009;169(3):251-8. DOI:10.1001/ archinternmed.2008.543
12. From the Centers for Disease Control and Prevention. Prevalence of disabilities and associated health conditions among adults--United States, 1999. JAMA. 2001;285(12):1571-2. DOI:10.1001/jama.285.12.1571
13. Gurgueira GP, Alexandre NM, Correa Filho HR. Prevalência de sintomas músculo-esqueléticos em trabalhadoras de enfermagem. Rev Lat Am Enferm. 2003;11(5):608-13. DOI:10.1590/S0104-11692003000500007
14. Hagen KB, Holte HH, Tambs K, Bjerkedal T. Socioeconomic factors and disability retirement from back pain: a 1983-1993 population-based prospective study in Norway. Spine. 2000;25(19):2480-7.
15. Hagen KB, Tambs K, Bjerkedal T. A prospective cohort study of risk factors for disability retirement because of back pain in the general working population. Spine. 2002;27(16):1790-6.
16. Hagen KB, Thune O. Work incapacity from low back pain in the general population. Spine. 1998;23(19):2091-5.
17. Jensen MC, Brant-Zawadzki MN, Obuchowski N, Modic MT, Malkasian D, Ross JS. Magnetic resonance imaging of the lumbar spine in people without back pain. N Engl J Med. 1994;331(2):69-73. DOI:10.1056/ NEJM199407143310201
18. Knoplich J. Agressões posturais da profi ssão de desenhista. Rev Bras Saude Ocup. 1987;15(57):55-8.
19. Krismer M, van Tulder M. Strategies for prevention and management of musculoskeletal conditions. Low back pain (non-specifi c). Best Pract Res Clin Rheumatol. 2007;21(1):77-91. DOI:10.1016/j.berh.2006.08.004
20. Magnussen L, Nilsen S, Raheim M. Barriers against returning to work--as perceived by disability pensioners with back pain: a focus group based qualitative study. Disabil Rehabil. 2007;29(3):191-7. DOI:10.1080/09638280600747793
21. Magnussen L, Strand LI, Skouen JS, Eriksen HR. Motivating disability pensioners with back pain to return to work: a randomized controlled trial. J Rehabil Med. 2007;39(1):81-7. DOI:10.2340/16501977-0004
22. Maniadakis N, Gray A. The economic burden of back pain in the UK. Pain. 2000;84(1):95-103.
23. Silva MC, Fassa AG, Valle NCJ. Dor lombar crônica em uma população adulta do Sul do Brasil: prevalência e fatores associados. Cad Saude Publica. 2004;20(2):377-85. DOI:10.1590/S0102-311X2004000200005
Article based on Master’s dissertation by Meziat Filho N submitted to the Institute of Social Medicine, Universidade do Estado do Rio de Janeiro in 2010.
The authors declare no confl icts of interests.
24. Souza NSS, Santana VS, Albuquerque-Oliveira PR, Barbosa-Branco A. Doenças do trabalho e benefícios previdenciários relacionados à saúde, Bahia, 2000. Rev Saude Publica. 2008;42(4):630-8. DOI:10.1590/ S0034-89102008000400008
25. Stewart WF, Ricci JA, Chee E, Morganstein D, Lipton R. Lost productive time and cost due to common pain conditions in the US workforce. JAMA. 2003;290(18):2443-54. DOI:10.1001/ jama.290.18.2443
26. Takahashi MABC, Iguti AM. As mudanças nas práticas de reabilitação profi ssional da Previdência Social no Brasil: modernização ou enfraquecimento da proteção social?. Cad Saude Publica. 2008;24(11):2661-70. DOI:10.1590/S0102-311X2008001100021