Delayed information cascades in Flickr: Measurement, analysis,
and modeling
Meeyoung Cha
a, Fabrício Benevenuto
b,⇑, Yong-Yeol Ahn
c, Krishna P. Gummadi
d aGraduate School of Culture Technology, KAIST, Republic of KoreabComputer Science Department, Federal University of Ouro Preto, Brazil cSchool of Informatics and Computing, Indiana University, USA dMax Planck Institute for Software Systems, Germany
a r t i c l e
i n f o
Article history: Received 4 March 2011
Received in revised form 7 September 2011 Accepted 25 October 2011
Available online 20 November 2011
Keywords:
Information dissemination Cascades
Social networks Epidemiology
a b s t r a c t
Online social networks exhibit small-world network characteristics, implying that infor-mation can spread in the network quickly and widely. This ability to spread inforinfor-mation rapidly has led to high expectations for word-of-mouth and viral campaigns in online social networks. However, a recent study of the Flickr social network has shown that popular photos do not spread as quickly as one might expect, but show a steady linear growth of popularity over several years. In this paper, we investigate possible reasons for this delay in word-of-mouth propagation by studying the behavior of Flickr users. We identify two factors of a social network that can alter how information spreads: the burstiness of user login times and content aging. We study the impact of these factors using an epidemiolog-ical model that was adapted to allow us to investigate the speed of propagation in word-of-mouth propagation. Our simulation shows that the two factors can explain the patterns observed on the real data and help us to understand how these factors affect a small-world network’s ability to spread information quickly and widely.
Ó2011 Elsevier B.V. All rights reserved.
1. Introduction
Social networks are small-world networks; they exhibit strong local clustering and a small diameter[29,42]. These small-world properties have been shown in several types of networks: scientific collaboration networks[31], biologi-cal networks[17], the WWW[3], as well as online commu-nities like Orkut, Facebook, Livejournal, Flickr, YouTube, and Cyworld[2,10,27,30]. In small-world networks, most users are only a few hops away from a random user, which has the important implication that information can spread quickly and widely throughout the network[37,43].
A recent study of Flickr[12], however, showed that the spreading pattern of photos was in conflict with our expec-tation about quick and viral spread. Like bookmarks, Flickr users can favorite-mark photos that others have uploaded.
The list of a user’s favorite photos is easily accessible to her friends and this allows a photo to spread through word-of-mouth, when friends further bookmark the same photo. In [12], the authors studied the spread of photo bookmarks and found that some photos experienced a long time to propagate from one friend to another, experiencing an ini-tial phase of exponenini-tial growth in the number of fans, fol-lowed by a phase of slow and linear growth over several years. These findings differ from the common expectations about viral spreading[37,43].
In this paper, we provide new insights on this delayed information propagation by studying the behavior of Flickr users. Particularly, we investigate two factors that can cause significant delay in the word-of-mouth propagation:
1. Bursty login times: In Flickr, a user must visit the web-site to browse photo updates from friends. Because users are not always-on, individual’s login times can be thought of as their window of opportunity to receive
1389-1286/$ - see front matterÓ2011 Elsevier B.V. All rights reserved.
doi:10.1016/j.comnet.2011.10.020
⇑ Corresponding author. Tel.: +55 31 35591682. E-mail address:[email protected](F. Benevenuto).
Contents lists available atSciVerse ScienceDirect
Computer Networks
content from their neighbors. Therefore, this factor directly contributes to the delay in information propagation.
2. Content aging: The availability of a photo from a partic-ular user diminishes as new photos displace old ones. This requires additional clicks to access old photos and limits the ability of the photos to spread.
To understand if the combined effect of content aging and bursty login behavior can delay information propagation in Flickr, we extended an epidemiological model to reproduce word-of-mouth information propagation and we simulated the addition of both delay factors in a photo spreading system. Our approach qualitatively explains the dynamic state of photo spreading over time in the Flickr social network. Our model is inspired by the SIR model, which is widely used in describing disease outbreaks. Like infectious diseases, popular photos can ‘‘infect’’ the users who favorite-mark them, users then ‘‘recover’’ from their favorite-marked photos over time. Our model can effectively explains the epidemic dynamics of the linear growth pattern seen in photo popularity. While the total number of fans grows steadily over time thereby exposing the picture to an ever increasing number of users in theory, our model estimates that the number of infected people who can effectively propagate photos in fact remain rather constant over time.
Our experiments help us to better understand why small-world networks do not always propagate informa-tion rapidly and how the delay factors we studied can af-fect the shape of the information propagation paths. The delay factors we studied are common in many online social networks, and we believe that our results can be applied in understanding the inherent delay associated with word-of-mouth propagation in many other online social networks. The rest of the paper is organized as follows. The next section summarizes the main characteristics of the Flickr network and the photo spreading patterns that motivated this work. We perform measurements and analyses to identify potential factors of delay in information propaga-tion in Secpropaga-tion3. As two key factors, we introduce content aging and dynamics in login times. In Section4we use an epidemiological model to verify whether these two factors are able to delay information cascades in Flickr. Section5 discusses how delay factors can affect information cas-cades paths in a social network. Finally, Section 6briefly surveys related work and Section 7concludes the paper and offers directions for future research.
2. Dataset and motivation
In this section we first briefly describe the Flickr social network and the methodology used for measuring photo popularity. We then review the delayed propagation pat-terns of photo spreading identified in[12]by reproducing the same experiments that motivated our work.
2.1. Flickr dataset
Flickr is a photo sharing site with social networking fea-tures, where users can create friend relationships with one
another and share photos. Users can upload photos, tag photos, comment on photos, bookmark photos as favorite. Users also join groups and upload photos into the groups. To use most of these features, users must create a Flickr ac-count and they must be logged-in.
Flickr users can create two types of links: links to favor-ite photos (calledfavorites) and links to other users (called
contacts). Like bookmarks, Flickr users favorite-mark
pho-tos to archive and share interesting phopho-tos with others. Users who favorite-marked a photo are calledfansof the photo. The list of a user’s favorite photos and contacts are available at the user’s profile and login page. More importantly, each user’s favorite photos list is publicly vis-ible, and, when users login into the system, they receive a list of all new photos of friends as well as all the new pho-tos their friends favorite marked. These mechanisms create a suitable environment for photos to spread across social links in the Flickr network.
In this paper we use a Flickr dataset available for the re-search community1that contains the list of favorite photos for all users and the topology snapshot of the social network. Because the Flickr API provides information about the exact time when a user marked a photo as a favorite, we can recre-ate favorite marking events over the social network topol-ogy. The dataset contains information about 35 million favorite markings of 11 million distinct photos by 2.5 million users. We refer the readers to[12]for the detailed descrip-tion of the data, data analysis on the general properties of the network, and limitations of the data.
2.2. Delayed information propagation in Flickr
Previous study showed that the Flickr social network exhibits ‘‘small-world’’ property [12]. In a network with the small-world property[29], the average path length be-tween people is so small that every pair of users can be connected in a few hops even when the size of network reaches planetary-scale [16]. Fig. 1(a) shows that about 70% of all users can be reached from an average user within four hops. The average path length is 5.67.
Although the Flickr graph ensures that users can reach any other’s content within a few hops, it is important to know what fraction of the late adopters got to know of the photo through a friend (as opposed to other mecha-nisms like search and external web links). Knowing this is important because if a new fan is connected to an exist-ing fan, this means that information likely propagated from an existing fan to the new one. InFig. 1(b) we examine the fraction of fans that are located 1, 2, or 3 or more hops away from the uploaders. We can note a strong content locality. About 90% of all favorite-markings come from a 2-hop neighborhood of uploaders. This observation associ-ated with the small-world properties of the Flickr topology suggest that information can propagate quickly and effec-tively through the Flickr social network.
However, the actual spreading pattern of very popular photos in Flickr is in conflict with such conclusion. Fig. 2(a) shows a steady linear growth of popularity of a
sampled photo over 600 days. Many other popular photos exhibit similar trends, where the linear steady growth is sustained over extended periods of time. Indeed,Fig. 2(b) shows the median growth pattern based on all popular pho-tos in Flickr that were favorite-marked more than 100 times by the end of the first year of photo upload. The plot shows the fraction of fans a photo obtained at the given age, out of the total number of fans it obtained at the end of the first year. The graph shows that these photos experienced a surge in popularity during the first few days. However, after the first 30 days, they enter a period of steady growth. The med-ian growth rate is relatively steady even 300 days after the photo upload. For the majority of pictures, nearly 65% of fans were acquired after the first 10 days.
A steady increase in popularity is observed for long per-iod of time: even after two years the growth rate does not show any sign of slowing down. As a result of the steady growth pattern, the fans these pictures obtained during the first few days accounts for an ever decreasing fraction of total fans. For a majority of popular pictures, over 90% of fans were acquired after the first 30 days. This suggests that Flickr users take a long time to find out about interesting pictures.
This delayed propagation of photos in Flickr cannot be easily explained by traditional information diffusion
theories[37,40], which predict a rather swift exponential initial growth of the number of people interested in an item and its eventual slowdown by a saturation or matu-rity. In theory, the small-world property of the Flickr net-work structure ensures that every pair of users can be connected in a few hops, thereby accelerating the informa-tion propagainforma-tion process[16,29]. In the rest of this paper we focus on verifying two potential causes of such delay in information propagating in Flickr: the bursty login times associated with content aging.
2.3. Popularity and content age
The delayed information propagation is prominent in the spread of online content. In order to investigate the prevalence of delayed information propagation in Flickr, we examined what fraction of favorite-markings from any given week are made on new and old photos, based on the entire Flickr trace we gathered.Fig. 3shows the re-sult for a representative week, out of many randomly cho-sen weeks we examined. Thex-axis represents the age of photos at the time of favorite-marking and they-axis rep-resents the total number of fans that all photos of the same age obtained. The vertical line marks the age of 30 days.
1−hops 2−hops 3−hops 4+ hops 0
20 40 60 80 100
Distance from a given user
Neighbors reachable (%)
1−hops 2−hops 3−hops 4+ hops 0
20 40 60 80 100
Distance from uploaders
Favorite−markings (%)
Fig. 1.Patterns of the Flickr topology and photo-spreading through social network links. An open circle represents the average value and the vertical line
represents an error bar of standard deviation.
0 100 200 300 400 500 600
0 500 1000 1500 2000 2500
Days since picture upload
# fans
steady growth
day 0 32 fans
0 100 200 300 400 500 600 700 0
20 40 60 80 100
Days since picture upload
Cumulative fan growth (%)
median
10th perc. 90th perc.
The figure shows a prominent peak towards an age of zero, indicating that a typical Flickr photo actively attracts new fans at the beginning of its lifetime. As photos get old-er (i.e., have been in the system for a longold-er pold-eriod of time), their ability to attract new fans diminishes quickly. While most photos receive their fans at the beginning of their lifetime and remain unnoticed, a small fraction of the pop-ular photos continue to receive new fans even after several months and years of their uploads. In fact, photos aged up to 30 days collectively received only 35% of all new fans on any given week. The remaining 65% of the fans went to-wards content older than one month. This observation sug-gests that Flickr photos acquire a significative fraction of their fans after month and not immediately after they are created.
3. Measurement observations on Flickr photo propagation process
So, what are the possible factors underpinning the sur-prisingly delayed propagation of popular Flickr photos? In this section we examine the behavior of Flickr users and identify two possible factors that delay information propagation.
Consider a fictitious Flickr user Carol. To have any chance of receiving and further propagating a photo, Carol should not only be active (i.e., logged on), but also the photo should be easily accessible, ideally, shown at the login page. If Carol sees the photo, then with a certain probability she will favorite-mark it and participates in further spreading. Car-ol’s friends, when they login to Flickr, can see newly favor-ite-marked photo. This simple example captures two key factors that can delay information propagation in word-of-mouth: login behavior of users and content availability over time. We describe each factor in turn below.
3.1. Bursty login behavior
Flickr is a pull-based system, where a user must regu-larly login to check updates from friends. Here, we exam-ine the frequency at which users login to Flickr and the variations of login behavior among individuals.
Because we cannot directly measure the login interval of users, we infer this information based on the times
be-tween two consecutive activities for each user. More for-mally, we utilize a time seriest(i), i= 1, 2, 3,. . .to denote the time of theith activity of each user. The time series a(i) is defined ast(i+ 1)t(i) and it denotes the time be-tween theith andi+ 1th activities that belong to the same user. We considered two forms of activities in our analysis: upload of photos and favorite-markings.Fig. 4shows the probability distribution function intervals between two consecutive activities for all users with at least two regis-tered activities in the entire dataset. While users do not necessarily upload photos or favorite-mark photos each time they login, these statistics suggests a lower bound on login intervals.
The probability of occurrence of times between activi-ties is higher when the activity interval is close to zero, which means that users repeat the same activity fre-quently within a short period of time. When uploading photos, a user is likely to upload multiple photos at once. Prominent peaks appear every 24 h, indicating a strong periodicity in the Flickr login times: people consistently access Flickr at almost the same time of day. Peak heights decrease as the time interval increases, but the probability is still significant and exhibits clear periodicity even after a week. This indicates that there are prominent fluctuations in user’s behavior. We do not observe any particular weekly pattern.
We also look at the last login times of users at any given time. Based on the final time stamp of the dataset, we in-ferred the last login time of users by examining the last time stamp they engaged in any activity (i.e., favorite-marking or photo upload). We consider users who did not exhibit any activity for more than 90 days to be inac-tive.Fig. 5shows the distribution of the time between lo-gin times for 255,593 users. For comparison, we also plot the last login times from another online social network. Re-cently, Torkjazi et al.[39]studied the user participation of MySpace users based on ‘‘date of last login’’ information available on a user’s MySpace page. We obtained their data and present the last login times of 10,553 users who ac-cessed MySpace within the 90 days of the data collection inFig. 5.
As expected, individual users show large variations in the frequency of their login times. We can note that only 25% of users in Flickr and 55% in MySpace login more fre-quently than once a week and 60% of the Flickr users and 75% of MySpace users login more frequently than once a month. As a consequence, these observations suggest that
0 200 400 600 800 1000 0
10.000 20.000 30.000 40.000 50.000 60.000 70.000
Age group of photos (days)
Total favorite−markings per week
← 35% of all favorite−markings in a week go to recent photos (uploaded within 30 days)
Old photos in aggregate receive 65% of all favorite−markings
Fig. 3.Relationship between the number of new fans and photo age in
Flickr.
0 24 48 72 96 120 144 168 192 0.0001
0.001 0.01 0.1 1
Inter−activity time (hour)
Probability
favorite−mark
photo upload
Fig. 4.Time intervals between two consecutive activities show regularity
a large fraction of the users (25–40%) login less frequently than once a month.
Because users are not always-on in the Flickr system but log on sporadically and show activities in a bursty fash-ion, individual’s login times can be thought of as their win-dow of opportunity to receive content from their neighbors. A user who logs in infrequently will find photos of her friends much later in time than those who login to Flickr daily. Consequently favorite-marking of photos by those users will naturally come later in time in terms of photo age. Therefore, this factor can directly contribute to the delay in information cascade.
3.2. Content aging
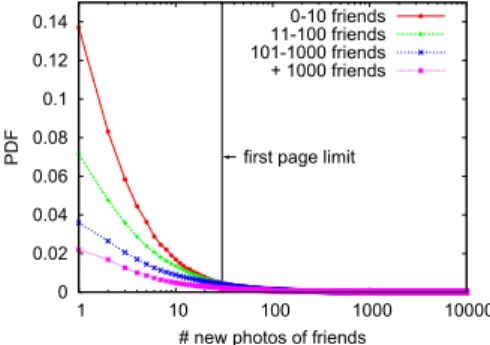
The second factor, content aging, is based on the obser-vation that new content constantly displaces old content. While users can have multiple favorites, as the number of photos marked as favorites grows, the bookmarked pho-tos are paged. As a result, accessing old phopho-tos requires an additional click, which can limit the ability of the photos to spread widely in the network. The rate of content aging de-pends on how quickly new content displace old content, in other words, how frequently a user’s friends send updates. In order to study content aging, we examine the proba-bility that a user favorite-marks a photo as the number of clicks that is required to find a given photo increases. One way to see this trend is the photo updates from friends. As mentioned earlier, all new photos of friends as well as pho-tos favorite marked by friends are shown to the user at the login page. This list is chronologically ordered, so that the newest photos are shown on the first page (where each page typically contains 30 photos). Let us consider a user who consecutively favorite-marks two photos P and Q that are shared by her friends. To infer how many photo pages the user would have browsed, we count the number of all photo uploads by her friends between P and Q’s uploads.Fig. 6 shows this trend. Because the number of photo updates from friends can vary largely according to how many friends a user has, we grouped users by their number of friends.
Fig. 6 clearly demonstrates that the probability of checking photos drops rapidly as the number of webpage clicks increases. A vertical bar in the figure represents the first page limit of 30 photos. A user typically consumes content on the first page with a probability of 0.53, depending on the number of friends she has. As the num-ber of clicks a user needs to make increases to find a given photo, the probability a user browses that content
de-creases. This indicates that content aging limits the chance for a photo to spread.
Interestingly, content aging is directly associated with bursty login times. Infrequent users can accumulate a large number of updates from friends. Consequently, when they finally login, it is unlikely they check all the updates from their friends. A typical Flickr page contains only tens of photos which means that a large fraction of updates from friends will be moved to the second, third, or even tenth page, requiring an additional click to access, making them much less accessible.
4. Simulation of word-of-mouth
In the previous section we have have shown that the lo-gin behavior of users is bursty, and we have established that content availability drops rapidly over time. In this section, we investigate if these two factors can lead to the steady popularity pattern. We first present the simple model for word-of-mouth we incorporate these factors into the model through simulation to test if they are able to delay the spread of a photo and lead to the same pat-terns we observed with real data.
4.1. A model of word-of-mouth
We choose to study word-of-mouth propagation using a simple model that is inspired by the SIR model, usually used to study the spread of infectious diseases through hu-man populations[28,33]. The key idea behind the SIR mod-el is to divide the population into three non-overlapping states: those who are susceptible to infection (referred to asS), those who are infected and can spread a disease to other susceptible individuals (denoted I), and those who have recovered from a disease and are immune to subse-quent re-infection (denoted R). The state transition hap-pens in the direction of S?I?R. In this model, two
transition rates S?I (infection) and I?R (recovery)
determine the cumulative number of infected people. The SIR model has great similarity to word-of-mouth content propagation. Like infectious diseases, a photo can ‘‘infect’’ a user who likes it, and the infection can be spread along social links. A user would be recovered from the in-fected photo only if she removes the photo from her favor-ite list. There are, however, (at least) two fundamental differences between the two processes. First is at the
1 7 20 30 40 50 60 70 80 90 0
0.2 0.4 0.6 0.8 1
Days since last login
CDF
25−40% of users login once a month or less frequently
Myspace Flickr
Fig. 5.Distribution of the time since last login.
0 0.02 0.04 0.06 0.08 0.1 0.12 0.14
1 10 100 1000 10000
# new photos of friends first page limit
0-10 friends 11-100 friends 101-1000 friends + 1000 friends
condition for infection. In disease spreading, a susceptible individual gets equal exposure to all the infectious diseases the user encounters. In content spreading, however, a user’s attention is scarce and a user consumes only easily accessible content (e.g., what is shown on the web page). The second difference is the infectiousness quality of con-tent. In disease spreading, encountering an infected person increases an individual’s chance of catching a disease. In content spreading, however, increased exposure does not necessarily make the user more likely to like the content. Furthermore, the times when a content could be viral (i.e., infectious) may vary widely, especially for topical or seasonal content. Disease, in contrast, do not typically ‘‘age’’ quickly like information.
To account for the above differences, we use SEIR model [6], which has one additional state called exposed (denoted E) between the S and I states (Fig. 7). In our SEIR model, all Flickr users start in thesusceptiblestate, which indicates that the user has not yet seen the photo. When a seed user shares a photo (via upload or favorite-marking), the friends of that user can move to theexposedstate. This transition is constrained by user login dynamics and content aging. Once a user is exposed to a photo, the user can move to either theinfectedstate by favorite-marking the photo or to therecoveredstate. Unlike the spread of most infectious diseases, an infected user will retain the same favorite indefinitely–there is no recovery–unless she removes the photo from her favorite list and becomes recovered (i.e.,
r
0). Because individual photos vary in their infectious-ness and availability, the model of word-of-mouth in Fig. 7needs to be considered for each photo.In the standard SEIR model, the exposed state represents the time during which an individual is infected but not yet infectious, and the latent time in this state is often assumed to follow an exponential distribution. A transition from the exposed state to the recovered state is similar to being im-mune to the photo[5]. In reality, it is possible that users need to be exposed multiple times to the same photo before deciding to favorite-mark the photo (see threshold influence models in viral marketing[44]). In this paper’s scope, we as-sume that a user immediately makes a decision on whether to favorite-mark a photo the moment she sees the photo.
4.2. Word-of-mouth in theory
Consider a population ofNusers at timet, whereSt,Et,It, andRtare the users in the statesS,E,I, andR, respectively, and N=St+Et+It+Rt. The number of users in each state can be described as a function of time
Stþ1¼St
a
StItEtþ1¼Etþ
a
StItbEt ð1bÞEtItþ1¼ItþbEt
r
ItRtþ1¼Rtþ ð1bÞEtþ
r
It; 8> > > <
> > > :
where
a
is the probability of a susceptible user, with at least one infected friend, be exposed to the content. The parameterbis the probability that an exposed user favorite marks the photo and becomes infected. We assume that exposed users that do not favorite mark the photo will not favorite mark it anymore in the future, thus, becoming immune to the photo. As a result, exposed users have prob-ability 1bto move to the recovered state. The parameterr
is the probability that an infected user remove the photo from her favorite list and, consequently, recovers.The state transition rates from one state to another are depicted inFig. 7. The model assumes that recovered users are immune to the infection and, thus, they cannot favorite mark that photo anymore.
We tested the model using real social network data, which we sampled from the largest connected component of the Flickr social network topology. We used networks of different sizes (i.e. ranging from 5,000 to 1 million users). These networks were created considering the social net-work of users involved in real favorite-marking cascades. Thus, this strategy ensured that each network forms a sin-gle connected component. Our simulation works as fol-lows: Given a network topology, we start with a single infected user. The remaining users are in the susceptible state. Each user in the network is assigned a login interval. At each simulation time unit, users who login have a chance to move from one state to another according to the dynamics of the proposed model.
To illustrate the dynamics of the model, we show one instance of a simulation run based on a network of 5,000 users.Fig. 8 depicts the spreading dynamics of a photo, using model parameters of
a
= 0.2,b= 0.2,r
= 0, and no de-lay factors. In this scenario, all users are assumed to login to Flickr once every day. The simulation result shows that the number of exposed users increases quickly and all the users become either infected or recovered. Upon encoun-tering a photo (i.e., when a friend has favorite-marked any photo), users have a 20% chance of favorite-marking the photo. Consequently, the number of infected users quickly increases and the epidemic stabilizes after 15 days. This baseline simulation showed a similar pattern across a variety of network sizes and values for the b parameter. For larger networks, more users remain in the susceptible state when the epidemic pattern stabilizes. When we decrease the bvalue, the number of total in-fected users decreases. Regardless of these changes, we al-ways observed rapid popularity growth of photos, followed by saturation.Fig. 7.Model of word-of-mouth propagation.
0 1000 2000 3000 4000 5000
0 10 20 30 40 50
Number of users
Time Susceptible
Exposed Infected Recovered
4.3. Word-of-mouth in practice
Now we use our model to explain the epidemic dynam-ics of photo spreading under the two delay constraints: bursty login times and content aging. First, as a baseline for comparisons, we simulate photo spreading without any delay factors. We then gradually add the two delay fac-tors in the model and study how spreading dynamics changes. Across all simulations, we used a network of 500,000 users and setb= 0.1, and
r
= 0.4.3.1. Baseline
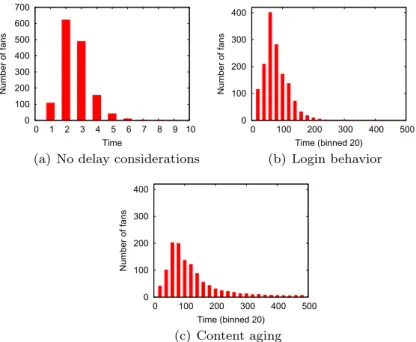
First, as a baseline for comparisons, we perform the simulation without any delay factors that we suggest. Fig. 9(a) shows the number of newly infected users over time. The parameter
a
is set to 1.0 and users login once every day. The photo propagates quickly over the network and obtains all possible fans in the first 10 days. At the end of the simulation, the photo had 1,444 fans.4.3.2. Simulating login dynamics
Next, we assigned each user a login interval that is drawn from our measurements in Section4.1. Every user was active at least once every 90 days, but some users logged in more frequently than others. 20% of users logged in at least once every week and 40% of users logged on once a month or less frequently.
Fig. 9(b) shows the number of newly infected users over time, binned by 20 days. Unlike the baseline result, we ob-serve that the photo gains fans even after the first month. In the first 10 days, the photo gained only 8% of the total fans. Because users do not login frequently, the exposure of content is delayed for all users. This delay in the word-of-mouth propagation adds up when the photo spreads through multiple hops. The entire cascade process is de-layed consequently. The infection spreads across 1,462
users only after 335 days. In total, 14,414 users had the opportunity to see the photo.
4.3.3. Simulating content aging
Finally we incorporate content aging in the simulation. We assume that a bookmarked photo moves to lower posi-tions of one’s favorites list as the user continues to book-mark new photos. When a photo appears in the lower position of a page or gets pushed out of the first page of the favorites list, it becomes harder to access.
There are several variables that can affect the amount of information available to the user and push faster or slower photos out of the first page. For simplicity, we represent this mechanism by decreasing the
a
parameter each time the user’s login. More specifically, because a photo can ap-pear in a different position of the favorites list for each user, we consider a uniquea
u,pvalue for each useruand each photo p. When a user U favorite-marks a photo P, for each friend F of U, we set thea
f,pvalue as 1.0. So, friends of U, when they login to Flickr, are exposed to photo P from U with a probability 1.0. When a user U logs on once more, we decrease thea
value by half, assuming that friends of U would now have new photos in her favorites list. When U logs onktimes, we set thea
u,pvalue to 1/k.Fig. 9(c) shows the number of newly infected users over time when we add both content aging and login dynamics. Now, a photo keeps gaining fans even after 300 days and the photo popularity stays steady over a longer period of time. After 335 simulation steps, the infection spreads across 1,030 users. We notice that the number of fans has dropped to 62% (907/1462). This implies that content aging not only delayed the word-of-mouth process, but also hindered the photo from spreading widely. Compared to the baseline, a higher fraction of Flickr users (20%) were not able to see to the photo at the end of the simulation.
0 100 200 300 400 500 600 700
0 1 2 3 4 5 6 7 8 9 10
Number of fans
Time
0 100 200 300 400
0 100 200 300 400 500
Number of fans
Time (binned 20)
0 100 200 300 400
0 100 200 300 400 500
Number of fans
Time (binned 20)
One interesting trend that we observe is that, due to the combined effect of login dynamics and content aging, a user can easily miss the first opportunity to see a photo (
a
u,p1). But when another friend bookmarks the same photo, the user is again exposed to the photo with a high probabilityða
u0;p1Þ. This sustained word-of-mouth effect keeps a constant residual fraction of exposed users in the system. Consequently, the fraction of infected users con-tinues to grow at a constant, linear rate, with a pattern similar to the observed in real data.5. Detour path in word-of-mouth
Our results demonstrate that two common factors in online social networks, bursty login behaviors and content aging, significantly delay information propagation through word-of-mouth and lead to a steady popularity pattern of content. Here, we first discuss how these realistic delay factors affect a small-world network’s ability to spread information quickly and widely. We then discuss how the two delay factors affect the information cascade paths.
One interesting consequence of the delay described in Sections4 and 5is that paths of influence often do not follow the shortest possible path. A user does not always learn about a photo the first time one of her friends introduces it. Instead, she might learn about the photo through other friends later in time. This means that information is not
always propagated along the shortest path but, sometimes, one of the longer alternatives. This phenomenon, in fact, can be observed in everyday life. Society consists of hierarchies and within these hierarchies messages are often delivered not by the shortest path, but via a detour path[24]. We usu-ally hear about the whereabouts of our friends through an-other friend. Sometimes direct conversation is actually slower and more costly than a multi-hop conversation.
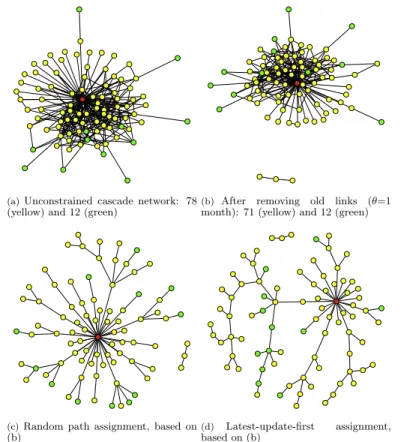
Note that there may exist multiple possible friends (or sources) a user could have received a piece of information from. To calculate the path length, we considered two strategies for assigning a single probable cascade path for each fan. First strategy is a random path assignment, where we randomly assign one incoming link per user. The sec-ond strategy is the latest-update-first assignment, where we select the neighbor who favorite-marked the same photo the most recently as a source. We also enforce con-tent aging and remove all links where the time of favorite-marking is distanced by more than 1 month (i.e., users are not likely to check out old favorite-markings of a friend). Fig. 10illustrates a typical cascade network from a photo, and the cascade paths based on these link assignment strategies. The photo used for illustration obtained a total of 137 fans. Among them, 90 had links to either the photo uploader or other fans. They form a connected component as shown in Fig. 10(a). To easily distinguish the hop distance of users in the social network topology, we
Fig. 10.Cascade networks of an example photo (unconstrained and after pruning links) and the resulting cascade paths for random and the
colored 1 hop fans in yellow and fans that are 2 or more hops away in green. The network structure shows that the lower bound on the maximum chain length is 2.
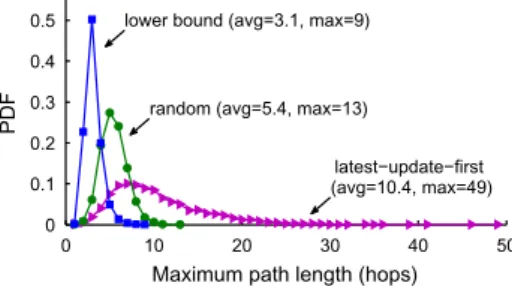
In order to further understand the relationship between the two delay factors and path length, we measured the in-crease in the maximum number of hops information could have traversed in the network, with and without detour factors. For simulation, we focused on the popular photos that had more than 100 fans in the data. There were 3,685 photos with a total of 57,756 favorite-markings. We constructed instances of the information cascade net-works for each of these 3,685 photos, then compared the maximum chain length in the basic topology (lower bound case), random path assignment, and latest-update-first path assignment. Fig. 11 shows the distribution of the maximum path lengths for all 3,685 photos. The average maximum chain length grows rapidly from 3.1 for lower bound case to 5.4 for random assignment and 10.4 for lat-est-update-first assignment. This simulation result demon-strates that pieces of information, when word-of-mouth is delayed, take detour paths to propagate.
6. Related work
We briefly review related work on the topics of human dynamics, modeling of cascade in the network, and informa-tion propagainforma-tion in online social networks. We begin with related studies on human dynamics. Studies related to social cascades go as far back as the 1950s[36,40]. Seminal work on persuasive communication, the branching process, and the diffusion of innovations spawned an extensive literature in sociology, economics, social psychology, political science, marketing, and epidemiology[28,33,34]. With the advent of OSN data, a number of research presented data-driven anal-ysis and measured patterns of information spreading across social network links. Gruhl et al.[23]studied the diffusion of information in the blogosphere based on the use of key-words in blog posts. They presented a pattern of information propagation within blogs based on the theory of infectious diseases to model the flow. Adar and Adamic[1]further ex-tended the idea of applying epidemiological models in describing the information flow and relied on the explicit use of URL links between blogs to track the flow of informa-tion. Bakshy et al.[7]studied content propagation in the context of the social network existent in Second Life, a mul-ti-player virtual game. By examining cascading trees they find that the social network plays a significant role in the adoption of content.
More recently, Leskovec et al.[25]developed a frame-work for tracking short, distinctive phrases that travel rel-atively intact through online media. They observed a typical lag of around 2.5 h between the peak of attention to a phrase in the news media compared to blogs. Simi-larly, Sun et al.[38]also found long chains by studying cas-cades on Facebook pages, but also showed that these diffusion chains on Facebook are typically started by a sub-stantial number of users. Figueiredo et al.[18]studied how YouTube videos acquire popularity over time and identi-fied the main mechanism through which users reach vid-eos on YouTube.
Gomez-Rodriguez et al.[21]investigated the problem of tracing paths of diffusion and influence and proposed an algorithm to decide a near-optimal set of directed edges that will maximize influence propagation. Ghosh and Ler-man [20] compared a number of influence metrics over Digg.com data and suggested that a centrality-based mea-sure is the best predictor of influence. Galuba et al. [19] propose a propagation model that predicts which users are likely to mention which URLs in Twitter. Recently, Rodrigues textitet al. [35] provide a number of analyses about the patterns of information propagation in Twitter. In addition to quantify the increase on the audience caused by word-of-mount, they also identify typical characteris-tics of the structure of cascade trees in Twitter. Finally, Cha et al. [11] showed that highly influential users are not necessarily the most followed users. In contrast to all these works, our study unveils different aspects of word-of-mouth information propagation.
The bursty dynamics of human behavior has been ob-served in several contexts[4,9,14,32]. The most prominent model of this behavior is based on a queuing model with a priority queue[8,41]. This model assumes that every indi-vidual prioritizes different activities and executes the task with the highest priority. With this assumption, this model shows that the waiting time of tasks follows a power-law. Additionally, a rich set of theoretical work has focused on the interplay between the social network structure and information flow. Granovetter [22] proposed a linear threshold model, where an adopter of innovation needs to have enough proportion (or threshold) of his neighbors who have previously adopted the same innovation. Dodds and Watts[15]extended this model from the perspective of epidemiology. Watts [43] proposed a mathematical model of global cascades based on sparse Erd}os-Rényi ran-dom networks and found that global-scale cascade could occur even with few early adopters. Watts examined the conditions for when such cascade happens under homoge-nous thresholds of user susceptibility.
Finally, there are a number of efforts towards character-izing and modeling cascade events [15,35]. Next, we re-view the two most relevant to our work, in addition to the SIR model already described in Section 4.1. First is the Internet chain letter model by Liben-Nowell and Klein-berg [26], which introduces a discard-rate parameter reflecting the probability that a given person discards the letter. In this model, however, the spreading is driven by a push-based mechanism, as opposed to the Flickr dynam-ics that are mainly based on a pull mechanism.
0 10 20 30 40 50 0
0.1 0.2 0.3 0.4 0.5
Maximum path length (hops)
random (avg=5.4, max=13)
latest−update−first (avg=10.4, max=49) lower bound (avg=3.1, max=9)
Second is the social interaction model by Crandall et al. [13]. This model is used to describe a social media system where people come across others while performing partic-ular activities. The model assumes that people’s future behavior can be predicted by their past behaviors and those of friends. This model displays the social selection and social influence phenomenon seen in the editing his-tory of Wikipedia articles. The Flickr social network evolves in a similar fashion, since people with similar taste on photos are likely to meet each other through various mechanisms. However, this paper does not cover the evo-lution of social networks or other social interactions, but rather how information propagates through the social network.
7. Concluding remark
In a network with small-world properties, the average path length between people is so small that every pair of users can be connected in a few hops even when the size of the network reaches planetary-scale[16]. Therefore, a social network with small-world properties in theory can spread pieces of information quickly and widely through social links (i.e., word-of-mouth). The structure of the Flickr social network satisfies this condition of quick infor-mation spreading [12]: The average path length is short and a randomly chosen user can reach a large fraction of all users within a few hops. However, we saw that photos spread through social links in a substantially delayed manner.
In this paper we investigate possible explanations for this mismatch in theory and practice. Particularly, we stud-ied the behavior of Flickr users and uncovered two factors that delay word-of-mouth propagation. These factors are (a) the bursty temporal dynamics of individuals’ login times and (b) the diminishing availability of content from a particular user as new content displaces old ones. Taken together, the two factors impose a crucial constraint on information propagation: a user should not only be active, but also content from a friend should be easily available at the time of a user’s activity. As a result, information takes a long time to propagate through each social link and collec-tively this means that popularity of content is steady over time. The delay factors we studied are common in many online social networks, and we believe that our results can be applied to understand the inherent delay associated with word-of-mouth propagation in many other online so-cial networks.
There are a number of directions for future work. An exciting extension of this work will be to apply our model to other types of social media, such as tracking the spread of videos and audio content in social networks. Multimedia content might show similar traits in the way they are adopted in the social network and transmitted to different parts of the network.
Acknowledgment
Meeyoung Cha was supported by Basic Science Re-search Program through the National ReRe-search Foundation
of Korea(NRF) funded by the Ministry of Education, Science and Technology (2011-0012988).
References
[1] E. Adar, L.A. Adamic, Tracking Information Epidemics in Blogspace, in: ACM International Conference on Web Intelligence, 2005. [2] Y.-Y. Ahn, S. Han, H. Kwak, S. Moon, H. Jeong, Analysis of topological
characteristics of huge online social networking services, in: International World Wide Web Conference (WWW), 2007. [3] R. Albert, H. Jeong, A.-L. Bárabási, The diameter of the WWW, Nature
401 (1999) 130–131.
[4] H.R. Anderson, Fixed Broadband Wireless System Design, Wiley, New York, 2003.
[5] R.M. Anderson, R.M. May, Infectious Diseases of Humans: Dynamics and Control, Oxford University Press, Oxford, UK, 1992.
[6] J. Aron, I. Schwartz, Seasonality and period-doubling bifurcations in an epidemic model, Journal of Theoretical Biology 110 (4) (1984) 665–679.
[7] E. Bakshy, B. Karrer, L.A. Adamic, social influence and the diffusion of user-created content, in: ACM Conference on Electronic Commerce (EC), 2009.
[8] A.-L. Bárabási, The origin of bursts and heavy tails in humans dynamics, Nature 435 (2005) 207.
[9] F. Benevenuto, T. Rodrigues, M. Cha, V. Almeida, Characterizing user behavior in online social networks, in: ACM SIGCOMM Internet Measurement Conference (IMC), 2009, pp. 49–62.
[10] F. Benevenuto, T. Rodrigues, V. Almeida, J.M. Almeida, K.W. Ross, Video interactions in online video social networks, ACM Transactions on Multimedia Computing, Communications and Applications (TOMCCAP) 5 (4) (2009) 1–25.
[11] M. Cha, H. Haddadi, F. Benevenuto, K. Gummadi, Measuring user influence in twitter: the million follower fallacy, in: International AAAI Conference on Weblogs and Social Media (ICWSM), 2010. [12] M. Cha, A. Mislove, K.P. Gummadi, A Measurement-Driven Analysis
of Information Propagation in the Flickr Social Network, in: International World Wide Web Conference (WWW), 2009. [13] D. Crandall, D.C. ley, D. Huttenlocher, J. Kleinberg, S. Suri, Feedback
effects between similarity and social influence in online communities, in: ACM SIGKDD Conference on Knowledge Discovery and Data Mining (KDD), 2008.
[14] C. Dewes, A. Wichmann, A. Feldman, An analysis of internet chat systems, in: ACM Internet Measurement Conference (IMC), 2003. [15] P. Dodds, D. Watts, A generalized model of social and biological
contagion, Journal of Theoretical Biology 232 (4) (2005) 587–604. [16] P.S. Dodds, R. Muhamad, D.J. Watts, An experimental study of search
in global social networks, Science 301 (2003) 827.
[17] S.N. Dorogovtsev, J.F.F. Mendes, Evolution of Networks: From Biological Networks to the Internet and WWW, Oxford University Press, 2003.
[18] F. Figueiredo, F. Benevenuto, J. Almeida, The tube over time: Characterizing popularity growth of youtube videos, in: ACM International Conference of Web Search and Data Mining (WSDM), 2011.
[19] W. Galuba, K. Aberer, D. Chakraborty, Z. Despotovic, W. Kellerer, Outtweeting the twitterers – predicting information cascades in microblogs, in: USENIX Conference on Online Social Networks (WOSN), 2010, pp. 1–9.
[20] R. Ghosh, K. Lerman, Predicting influential users in online social networks, in: AAAI International Conference on Weblogs and Social Media (ICWSM), 2010.
[21] M. Gomez-Rodriguez, J. Leskovec, A. Krause, Inferring networks of diffusion and influence, in: ACM SIGKDD Conference on Knowledge Discovery and Data Mining (KDD), 2010.
[22] M. Granovetter, Threshold models of collective behavior, American Journal of Sociology 83 (6) (1978) 1420–1443.
[23] D. Gruhl, R. Guha, D. Liben-Nowell, A. Tomkins, Information diffusion through blogspace, in: International World Wide Web Conference (WWW), 2004.
[26] D. Liben-Nowell, J. Kleinberg, Tracing information flow on a global scale using internet chain-letter data, Proceedings of the National Academy of Sciences (PNAS) 105 (12) (2008) 4633–4638. [27] D. Liben-Nowell, J. Novak, R. Kumar, P.R.A. Tomkins, Geographic
routing in social networks, Proceedings of the National Academy of Sciences (PNAS) 102 (2005). 11623-1162.
[28] R.M. May, A.L. Lloyd, Infection dynamics on scale-free networks, Physical Review E 64 (6) (2001) 066112.
[29] S. Milgram, The small world problem, Psychology Today 1 (1) (1967) 61–67.
[30] A. Mislove, M. Marcon, K.P. Gummadi, P. Druschel, B. Bhattacharjee, Measurement and analysis of online social networks, in: ACM Internet Measurement Conference, 2007.
[31] M.E.J. Newman, The structure of scientific collaboration networks, in: Proceedings of the National Academy of Sciences (PNAS), vol. 98, 2001.
[32] J.G. Oliveira, A.-L. Barabási, Human dynamics: the correspondence patterns of darwin and einstein, Nature 437 (2005) 1251. [33] R. Pastor-Satorras, A. Vespignani, Epidemics and Immunization in
Scale-Free Networks, Wiley, Berlin, 2005.
[34] R. Pastor-Satorras, A. Vespignani, Infection dynamics on scale-free networks, chapter epidemics and immunization in Scale-Free Networks, Handbook of Graphs and Networks.
[35] T. Rodrigues, F. Benevenuto, M. Cha, K.P. Gummadi, V. Almeida, On word-of-mouth based discovery of the web, in: ACM SIGCOMM Internet Measurement Conference (IMC), 2011, pp. 381–393. [36] E.M. Rogers, Diffusion of Innovations, Free Press, New York, NY,
1962.
[37] E.M. Rogers, Diffusion of Innovations, fifth ed., Free Press, New York, NY, 2003.
[38] E. Sun, I. Rosenn, C. Marlow, T. Lento, Gesundheit! modeling contagion through facebook news feed, in: AAAI International Conference on Weblogs and Social Media (ICWSM), 2009. [39] M. Torkjazi, R. Rejaie, W. Willinger, Hot Today, Gone Tomorrow: On
the migration of myspace users, in: ACM SIGCOMM Workshop on Social Networks (WOSN), 2009.
[40] T.W. Valente, Network Models of the Diffusion of Innovations, Hampton Press, Cresskill, N.J., 1995.
[41] A. Vázquez, J.G. Oliveira, Z. Dezsö, K.-I. Goh, I. Kondor, A.-L. Barabási, Modeling bursts and heavy tails in human dynamics, Physical Review E 73 (2006) 036127.
[42] D. Watts, S. Strogatz, Collective dynamics of ‘small-world’ networks, Nature 393 (1998) 440–442.
[43] D.J. Watts, A simple model of global cascades on random networks, Proceedings of the National Academy of Sciences (PNAS) 99 (9) (2002) 5766–5771.
[44] D.J. Watts, P.S. Dodds, Influentials, networks, and public opinion formation, Journal of Consumer Research 34 (4) (2007) 441–458.
Meeyoung Cha an assistant professor at
Graduate School of Culture Technology in KAIST. Meeyoung received a Ph.D. degree in Computer Science from KAIST in 2008. She was a post-doctoral researcher at Max Planck Institute for Software Systems (MPISWS) in Germany from 2008 to 2010. Meeyoung’s research interests are in the analysis of large-scale online social networks. She received the best paper award from Usenix/ACM SIG-COMM Internet Measurement Conference 2007 for her work on YouTube. Her work on the user influence in Twitter in 2010 has been featured on New York Times websites and Harvard Business Review’s research blog.
Fabrício Benevenutoan assistant professor at
the Computer Science Department in Federal University of Ouro Preto (UFOP), in Brazil. He received his Ph.D. (2010) and M.S. (2006) in Computer Science from Federal University of Minas Gerais, in Brazil. During his Ph.D., Fab-rício held research intern positions at HP Labs and MPI-SWS (Max Planck Institute for Soft-ware Systems). His interests are focused on exploiting and understanding the character-istics of online social network systems.
Yong-Yeol Ahn is an assistant professor at
School of Informatics and Computing in Indi-ana University Bloomington. He received his Ph.D. degree in Statistical Physics from KAIST in 2008. He was a postdoctoral research at the Center for Complex Network Research at Northeastern University in Boston, MA from 2008 to 2011. His research interests are analysis of complex networks and social media.
Krishna Gummadileads the Networked